The Continental Intercalaire Aquifer at the Kébili Geothermal Field ...
The Continental Intercalaire Aquifer at the Kébili Geothermal Field ...
The Continental Intercalaire Aquifer at the Kébili Geothermal Field ...

You also want an ePaper? Increase the reach of your titles
YUMPU automatically turns print PDFs into web optimized ePapers that Google loves.
Agoun<br />
c<strong>at</strong>ions, concentr<strong>at</strong>ion of boron and o<strong>the</strong>r toxic elements<br />
and, <strong>the</strong> concentr<strong>at</strong>ion of bicarbon<strong>at</strong>e. <strong>The</strong> C.I. w<strong>at</strong>er<br />
quality is close to <strong>the</strong> limits of potability and <strong>the</strong>refore well<br />
within <strong>the</strong> limits of use for agriculture. In fact, it is well<br />
suited for agricultural uses.<br />
TUN<br />
LIB<br />
<strong>The</strong> dissolved oxygen results are from on-site analysis but<br />
are not very accur<strong>at</strong>e. In fact, <strong>the</strong> high concentr<strong>at</strong>ion of<br />
oxygen can be from <strong>at</strong>mospheric origin due to <strong>the</strong> loc<strong>at</strong>ion<br />
of <strong>the</strong> sample sites. So, <strong>the</strong> solubility of oxygen in distilled<br />
w<strong>at</strong>er in contact with air depends on <strong>the</strong> temper<strong>at</strong>ure. At<br />
70°C <strong>the</strong> w<strong>at</strong>er s<strong>at</strong>ur<strong>at</strong>ed with oxygen, <strong>the</strong> concentr<strong>at</strong>ion is<br />
about 3.8 mgO 2 /kg. <strong>The</strong> w<strong>at</strong>er from C.I. aquifer is far from<br />
<strong>at</strong>mospheric oxygen. <strong>The</strong>refore a recommended place to<br />
take a represent<strong>at</strong>ive sample of <strong>the</strong> w<strong>at</strong>er from each well is<br />
through a sampling point in <strong>the</strong> horizontal side <strong>at</strong> 1.5 m<br />
from <strong>the</strong> wellhead in order to get a way from <strong>the</strong> turbulent<br />
flow of <strong>the</strong> fluid.<br />
δ D<br />
40<br />
20<br />
0<br />
-20<br />
-40<br />
-60<br />
-80<br />
-100<br />
-120<br />
Meteoric w<strong>at</strong>er world wide:<br />
δ D = 8*δ18Ο + 10<br />
-140<br />
-16 -14 -12 -10 -8 -6 -4 -2 0 2 4 6<br />
δ 18O<br />
Legend<br />
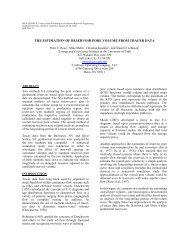
Figure 6: A δD vs δ 18 O plot for <strong>the</strong> collected samples<br />
5.2. Origin of w<strong>at</strong>er<br />
Analysis of isotopic composition radiocarbon analysis in<br />
previous studies (Edmunds et al., 1997), shows th<strong>at</strong><br />
radiocarbon is present between 2 - 10 pmc which leads to<br />
<strong>the</strong> conclusion th<strong>at</strong> <strong>the</strong> w<strong>at</strong>ers were recharged during <strong>the</strong><br />
l<strong>at</strong>e-Pleistocene, in <strong>the</strong> period 25 kyr BP, corresponding to<br />
<strong>the</strong> last glacial maximum in Europe (Edmunds et al., 1997).<br />
<strong>The</strong> stable isotopes of hydrogen and oxygen are used to<br />
obtain more inform<strong>at</strong>ion about <strong>the</strong> origin and <strong>the</strong> possibility<br />
of recharge of this aquifer. Figure 6 shows <strong>the</strong> rel<strong>at</strong>ionship<br />
between δD and δ 18 O of <strong>the</strong> geo<strong>the</strong>rmal w<strong>at</strong>er from <strong>the</strong> C.I.<br />
aquifer in <strong>the</strong> <strong>Kébili</strong> area. <strong>The</strong> d<strong>at</strong>a points are concentr<strong>at</strong>ed<br />
along <strong>the</strong> meteoric line of Craig (1961), indic<strong>at</strong>ing <strong>the</strong><br />
meteoric origin of <strong>the</strong> geo<strong>the</strong>rmal w<strong>at</strong>er. δ 18 O ranges from -<br />
7.5 to -9% and this sign<strong>at</strong>ure is characteristic of<br />
palaeow<strong>at</strong>ers in northwest of Africa. An estim<strong>at</strong>e of <strong>the</strong><br />
current recharge of <strong>the</strong> C.I. aquifer w<strong>at</strong>er using <strong>the</strong> isotopes<br />
shows th<strong>at</strong> <strong>the</strong> groundw<strong>at</strong>er reserves are non-renewable<br />
(Edmunds et al., 1997).<br />
11<br />
12<br />
14<br />
16<br />
2<br />
6<br />
7<br />
8<br />
10<br />
4<br />
9<br />
13<br />
5<br />
ALG<br />
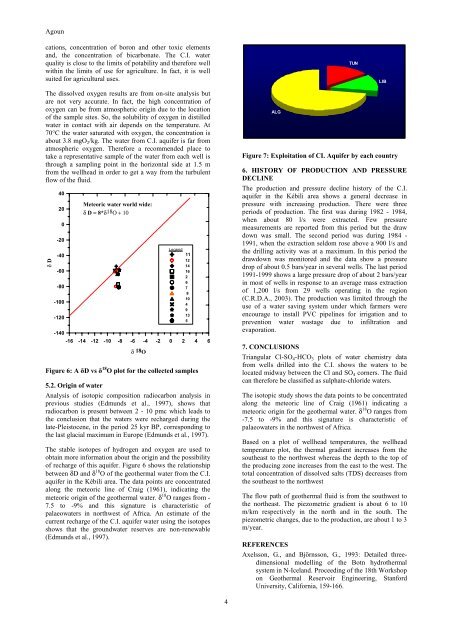
Figure 7: Exploit<strong>at</strong>ion of CI. <strong>Aquifer</strong> by each country<br />
6. HISTORY OF PRODUCTION AND PRESSURE<br />
DECLINE<br />
<strong>The</strong> production and pressure decline history of <strong>the</strong> C.I.<br />
aquifer in <strong>the</strong> <strong>Kébili</strong> area shows a general decrease in<br />
pressure with increasing production. <strong>The</strong>re were three<br />
periods of production. <strong>The</strong> first was during 1982 - 1984,<br />
when about 80 l/s were extracted. Few pressure<br />
measurements are reported from this period but <strong>the</strong> draw<br />
down was small. <strong>The</strong> second period was during 1984 -<br />
1991, when <strong>the</strong> extraction seldom rose above a 900 l/s and<br />
<strong>the</strong> drilling activity was <strong>at</strong> a maximum. In this period <strong>the</strong><br />
drawdown was monitored and <strong>the</strong> d<strong>at</strong>a show a pressure<br />
drop of about 0.5 bars/year in several wells. <strong>The</strong> last period<br />
1991-1999 shows a large pressure drop of about 2 bars/year<br />
in most of wells in response to an average mass extraction<br />
of 1,200 l/s from 29 wells oper<strong>at</strong>ing in <strong>the</strong> region<br />
(C.R.D.A., 2003). <strong>The</strong> production was limited through <strong>the</strong><br />
use of a w<strong>at</strong>er saving system under which farmers were<br />
encourage to install PVC pipelines for irrig<strong>at</strong>ion and to<br />
prevention w<strong>at</strong>er wastage due to infiltr<strong>at</strong>ion and<br />
evapor<strong>at</strong>ion.<br />
7. CONCLUSIONS<br />
Triangular Cl-SO 4 -HCO 3 plots of w<strong>at</strong>er chemistry d<strong>at</strong>a<br />
from wells drilled into <strong>the</strong> C.I. shows <strong>the</strong> w<strong>at</strong>ers to be<br />
loc<strong>at</strong>ed midway between <strong>the</strong> Cl and SO 4 corners. <strong>The</strong> fluid<br />
can <strong>the</strong>refore be classified as sulph<strong>at</strong>e-chloride w<strong>at</strong>ers.<br />
<strong>The</strong> isotopic study shows <strong>the</strong> d<strong>at</strong>a points to be concentr<strong>at</strong>ed<br />
along <strong>the</strong> meteoric line of Craig (1961) indic<strong>at</strong>ing a<br />
meteoric origin for <strong>the</strong> geo<strong>the</strong>rmal w<strong>at</strong>er. δ 18 O ranges from<br />
-7.5 to -9% and this sign<strong>at</strong>ure is characteristic of<br />
palaeow<strong>at</strong>ers in <strong>the</strong> northwest of Africa.<br />
Based on a plot of wellhead temper<strong>at</strong>ures, <strong>the</strong> wellhead<br />
temper<strong>at</strong>ure plot, <strong>the</strong> <strong>the</strong>rmal gradient increases from <strong>the</strong><br />
sou<strong>the</strong>ast to <strong>the</strong> northwest whereas <strong>the</strong> depth to <strong>the</strong> top of<br />
<strong>the</strong> producing zone increases from <strong>the</strong> east to <strong>the</strong> west. <strong>The</strong><br />
total concentr<strong>at</strong>ion of dissolved salts (TDS) decreases from<br />
<strong>the</strong> sou<strong>the</strong>ast to <strong>the</strong> northwest<br />
<strong>The</strong> flow p<strong>at</strong>h of geo<strong>the</strong>rmal fluid is from <strong>the</strong> southwest to<br />
<strong>the</strong> nor<strong>the</strong>ast. <strong>The</strong> piezometric gradient is about 6 to 10<br />
m/km respectively in <strong>the</strong> north and in <strong>the</strong> south. <strong>The</strong><br />
piezometric changes, due to <strong>the</strong> production, are about 1 to 3<br />
m/year.<br />
REFERENCES<br />
Axelsson, G., and Björnsson, G., 1993: Detailed threedimensional<br />
modelling of <strong>the</strong> Botn hydro<strong>the</strong>rmal<br />
system in N-Iceland. Proceeding of <strong>the</strong> 18th Workshop<br />
on Geo<strong>the</strong>rmal Reservoir Engineering, Stanford<br />
University, California, 159-166.<br />
4