Financial Performance - GMR
Financial Performance - GMR
Financial Performance - GMR

Create successful ePaper yourself
Turn your PDF publications into a flip-book with our unique Google optimized e-Paper software.
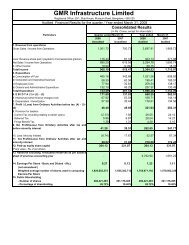
Airports Segment: <strong>Financial</strong> <strong>Performance</strong><br />
Rs. mn<br />
Quarterly Results<br />
Annual Results<br />
Q4 FY09 Q1 FY10 Q1 FY09 FY 09 FY 08<br />
Gross Revenue 4,020 4,475 3,862 16,729 8,770<br />
Aero Revenue 1,438 1,549 1,271 5,478 3,238<br />
Non Aero Revenue 2,582 2,897 2,592 11,251 5,532<br />
Mgmt Services 0 29 0<br />
Less: Revenue Share 1,156 1,235 1,093 4,570 4,031<br />
Net Revenue 2,864 3,240 2,769 12,159 4,739<br />
Total Expenditure 2,223 2,067 2,274 9,881 4,380<br />
EBITDA 640 1,174 495 2,278 359<br />
EBITDA margin 15.9% 36.2% 17.9% 18.7% 7.6%<br />
Other Income (75) 18 27 37 91<br />
Interest & Finance Charges 653 836 317 2,036 25<br />
Depreciation 595 722 375 2,077 119<br />
PBT (682) (365) (170) (1797) 307<br />
Tax 202 (54) 14 (120) 317<br />
PAT (Before Minority Interest) (481) (311) (185 (1678) (11)<br />
PAT Margin (11.9)% (9.6)% (6.7)% (13.8)% (0.2)%<br />
Minority Interest (165) (115) 2 (497) 78<br />
PAT (After Minority Interest) (316) (197) (187) (1181) (88)<br />
Cash Profit 114 355 192 204 398