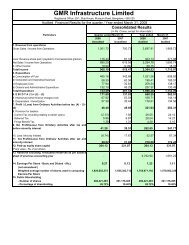
Financial Performance - GMR
Financial Performance - GMR
Financial Performance - GMR

Create successful ePaper yourself
Turn your PDF publications into a flip-book with our unique Google optimized e-Paper software.
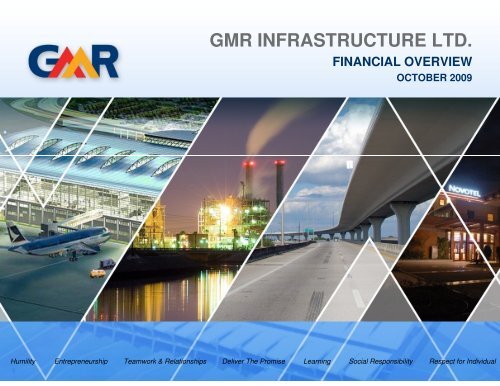
<strong>GMR</strong> INFRASTRUCTURE LTD.<br />
FINANCIAL OVERVIEW<br />
OCTOBER 2009<br />
Humility Entrepreneurship Teamwork & Relationships Deliver The Promise Learning Social Responsibility Respect for Individual
Presentation Flow<br />
Page No.<br />
Overview<br />
2<br />
Airports Segment<br />
4<br />
Energy Segment<br />
14<br />
Highways & Urban Infrastructure Segments<br />
20<br />
Consolidated <strong>Financial</strong> <strong>Performance</strong><br />
25
Overview
Leading Infrastructure Developer of India<br />
Infrastructure<br />
Construction Division<br />
Airports<br />
Energy<br />
Highways<br />
Urban<br />
Infrastructure<br />
Indian Businesses<br />
Delhi Airport (Pax Traffic ~ 22.9 mn)<br />
Hyderabad Airport (Pax Traffic ~ 6.2 mn)<br />
Assets in Operation - 823 MW<br />
Assets under Development – 6,808 MW<br />
Assets in Operation - 421 kms<br />
Assets under Development - 210 kms<br />
At Delhi Airport<br />
250 acres for Commercial Development<br />
At Hyderabad Airport<br />
1,000 acres for Commercial Development<br />
250 acres Aviation SEZ<br />
250 acres Logistic SEZ<br />
In Tamil Nadu<br />
3,300 acres SEZ<br />
InterGen N.V.<br />
International Businesses<br />
Istanbul Airport (Pax Traffic ~ 4.4 mn)<br />
Assets in Operation - 7,658 MW<br />
– UK - 2,385 MW<br />
– Mexico - 2,223 MW<br />
– Netherlands - 820 MW<br />
– Philippines - 460 MW<br />
– Australia - 1,770 MW<br />
Assets under Construction - 428 MW<br />
– Netherlands - 428 MW<br />
Island Power<br />
Assets under Development - 800 MW<br />
– Singapore - 800 MW
Airports Segment
Delhi Airport: Developing India’s Largest Airport<br />
ecent Developments<br />
Quarterly Operational <strong>Performance</strong><br />
New Integrated<br />
Terminal (T3)<br />
Passenger (mn)<br />
6.1 5.9 6.2<br />
1.9 2.1<br />
1.8<br />
4.2 3.9 4.5<br />
% Growth<br />
Q-o-Q Y-o-Y<br />
3.4% (1.5%)<br />
(8.6%)<br />
9.8%<br />
6.7%<br />
(4.8%)<br />
Integrated Terminal (T3) – 76% completed as on 30 Sep 09<br />
To be operationalized by March 2010<br />
Domestic Departure Terminal (T1D) operationalized in Apr 2009<br />
10 mn Passenger Capacity added<br />
Airport Development Fees R.s 1,827 bn securitized<br />
JVs signed for Duty-free & F&B Concession in T3<br />
49.9% stake in Duty-free JV with Aer Rianta & Indian Duty<br />
Free Services<br />
40% stake in F&B JVs with Travel Food Services & Devyani<br />
International<br />
Operation Support Period for AAI employees completed<br />
Awarded 29.3 acres of Land Parcels for Commercial<br />
Development<br />
Enhanced flexibility in land usage for 250 acres<br />
Q1 FY 10 Q4 FY 09 Q1 FY 09<br />
Cargo (’000 tons)<br />
113.3<br />
99.9<br />
114.4<br />
78.3<br />
69.4<br />
80.1<br />
35.1 30.5 34.4<br />
Q1 FY 10 Q4 FY 09 Q1 FY 09<br />
ATMs (’000)<br />
55.4 53.2 57.7<br />
15.4 14.7 14.7<br />
40.0 38.5 43.0<br />
Q1 FY 10 Q4 FY 09 Q1 FY 09<br />
Domestic International<br />
% Growth<br />
Q-o-Q Y-o-Y<br />
13.4% (1.0%)<br />
12.7%<br />
14.9%<br />
(2.3%)<br />
<br />
2.0%<br />
% Growth<br />
Q-o-Q Y-o-Y<br />
4.1% (4.0%)<br />
4.8%<br />
3.9%<br />
4.8%<br />
(7.0%)
Delhi Airport: Annual Operational <strong>Performance</strong><br />
1<br />
Passengers (Pax)<br />
2<br />
Air Traffic Movements (ATMs)<br />
CAGR: 16%<br />
CAGR: 16%<br />
(in mn)<br />
(in nos.)<br />
3<br />
Cargo Traffic Movement<br />
Delhi Airport Overview<br />
CAGR: 5%<br />
Terminal 1D<br />
Domestic<br />
International
Delhi Airport: <strong>Financial</strong> <strong>Performance</strong><br />
Rs. mn<br />
1<br />
2<br />
3<br />
Quarterly Results Annual Results<br />
Q4 FY09 Q1 FY10 Q1 FY09 FY 09 FY 08<br />
Gross Revenue 2,391 2,577 2,282 9,476 8,706<br />
Aero Revenue 866 919 898 3,421 3,219<br />
Non Aero Revenue 1,525 1,658 1,384 6,056 5,487<br />
Less: Revenue Share 1,110 1,189 1,059 4,406 4,027<br />
Net Revenue 1,281 1,388 1,223 5,070 4,679<br />
Total Expenditure 1,156 937 1,058 4,444 3,748<br />
EBITDA 125 451 166 626 931<br />
EBITDA margin 5.2% 32.5% 13.5% 12.4% 19.9%<br />
Other Income (20) 7 16 50 48<br />
Interest & Finance Charges 258 327 3 494 5<br />
Depreciation 232 247 23 525 91<br />
PBT (385) (116) 155 (342) 883<br />
Tax (127) (37) 5 (107) 316<br />
PAT (Before Minority Interest) (259) (80) 150 (235) 567<br />
PAT Margin (10.8)% (5.7)% 12.3% (4.6)% 12.1%<br />
Minority Interest (129) (39) 75 (117) 283<br />
PAT (After Minority Interest) (130) (40) 75 (118) 284<br />
Cash Profit (27) 131 173 159 948<br />
1<br />
2<br />
3<br />
Increase in Q1 FY10 Non-Aero revenue (YoY) is mainly due to 1) Increase in Duty-Free revenue due to leasing of additional space;<br />
2) Baggage screening charges for International Terminal initiated in Aug 2008; 3) Additional land leased for Hanger.<br />
Reduction in Q1 FY10 Expenses (YoY) as Operation Support Period for AAI employees was completed in May 2009.<br />
Increase in Q1 FY10 Interest and Depreciation (YoY) due to capitalization of New Runway and Domestic Departure Terminal (T1D)
Hyderabad Airport: India’s First Greenfield Airport Through PPP<br />
Recent Developments<br />
Quarterly Operational <strong>Performance</strong><br />
Passenger (mn)<br />
1.50 1.45<br />
0.42 0.37<br />
1.80<br />
0.40<br />
% Growth<br />
Q-o-Q Y-o-Y<br />
5.8% (13.5%)<br />
11.1%<br />
8.1%<br />
New Terminal<br />
Building<br />
1.13 1.08<br />
1.40<br />
3.9%<br />
(19.5%)<br />
Q1 FY 10 Q4 FY 09 Q1 FY 09<br />
10% increase in Aero Charges from 1 Jul 2009;<br />
Includes Landing and Parking Charges<br />
JV for MRO with Malaysian Aerospace Engineering (MAE)<br />
MAE – Certified by 31 National Aviation Authorities Globally<br />
Cargo (’000 tons)<br />
14.0 13.4 14.2<br />
9.1 7.1 8.8<br />
4.9 6.3 5.5<br />
Q1 FY 10 Q4 FY 09 Q1 FY 09<br />
% Growth<br />
Q-o-Q Y-o-Y<br />
4.5% (1.7%)<br />
27.2%<br />
(21.4%)<br />
3.8%<br />
(10.5%)<br />
MoU with CFM International (CFM) to develop Training Center<br />
CFM – Leading Supplier of Engines to Airbus & Boeing<br />
Hyderabad positioned as a “Transshipment Hub”<br />
Appointed Districon as Consultant<br />
ATMs (’000)<br />
20.1 19.6<br />
3.2 3.1<br />
16.9 16.4<br />
22.4<br />
2.6<br />
19.8<br />
% Growth<br />
Q-o-Q Y-o-Y<br />
2.7% (10.2%)<br />
1.3%<br />
3.0%<br />
20.9%<br />
(14.4%)<br />
Q1 FY 10 Q4 FY 09 Q1 FY 09<br />
Domestic<br />
International
Hyderabad Airport: Annual Operational <strong>Performance</strong><br />
1<br />
Passengers (PAX)<br />
2<br />
Air Traffic Movements (ATMs)<br />
CAGR: 22%<br />
CAGR: 23%<br />
(in mn)<br />
(in nos.)<br />
3<br />
Cargo Traffic Movement<br />
Hyderabad Airport Overview<br />
CAGR: 12%<br />
Domestic<br />
International
Hyderabad Airport: <strong>Financial</strong> <strong>Performance</strong><br />
Rs. mn<br />
1<br />
Quarterly Results<br />
Annual Results<br />
Q4 FY09 Q1 FY10 Q1 FY09 FY 09<br />
Gross Revenue 1,041 1,132 851 3,859<br />
Aero Revenue 571 630 373 2,058<br />
Non Aero Revenue 470 501 478 1,802<br />
Less: Revenue Share 46 46 34 163<br />
Net Revenue 996 1,086 817 3,696<br />
Total Expenditure 460 502 519 2,266<br />
EBITDA 536 584 298 1,430<br />
EBITDA margin 51% 54% 36% 39%<br />
Other Income 17 16 8 36<br />
Interest & Finance Charges 427 505 301 1,536<br />
Depreciation 319 315 257 1,122<br />
PBT (193) (221) (252) (1,192)<br />
Tax 5 0 4 19<br />
PAT (Before Minority Interest) (187) (221) (256) (1,211)<br />
PAT Margin (18)% (20)% (31)% (33)%<br />
Minority Interest (73) (81) (95) (448)<br />
PAT (After Minority Interest) (114) (139) (161) (763)<br />
Cash Profit 299 94 1 (89)<br />
1<br />
Increase in Q1 FY10 Aero Revenues (YoY) is mainly due to start of collection of User Development Fees (UDF).<br />
UDF collection for International Passengers started from 23 April 08 & for Domestic Passengers started from 22 August 08.
Turkey Airport (ISGIA) : Rapidly Growing Airport<br />
Recent Developments<br />
ISGIA Project on Schedule<br />
New Terminal Building Inauguration scheduled for<br />
31 Oct 2009<br />
New multi-storey car park operationalised in Apr 2009<br />
VIP lounge & Trigen facility to be developed<br />
Quarterly Operational <strong>Performance</strong><br />
Passenger (mn)<br />
1.5<br />
0.5<br />
1.1 1.1<br />
0.3 0.4<br />
1.0 0.8 0.7<br />
Q1 FY 10 Q4 FY 09 Q1 FY 09<br />
% Growth<br />
Q-o-Q Y-o-Y<br />
29.4% 31.8%<br />
45.9% 16.5%<br />
23.0% 40.3%<br />
Financing Secured<br />
Cargo (’000 tons)<br />
19.7<br />
% Growth<br />
Q-o-Q Y-o-Y<br />
2.9% (64.0%)<br />
Master Plan for Development<br />
7.1 6.9<br />
17.6<br />
(27.5%)<br />
(72.0%)<br />
A<br />
D<br />
C<br />
B<br />
A<br />
B<br />
C<br />
D<br />
Existing terminals<br />
New terminal<br />
Car park<br />
Hotel<br />
5.0<br />
2.1 6.9 0.0 2.1<br />
Q1 FY 10 Q4 FY 09 Q1 FY 09<br />
ATMs (’000)<br />
11.9<br />
10.0<br />
11.7<br />
4.1<br />
3.6<br />
5.1<br />
7.8 6.4 6.6<br />
0.0%<br />
% Growth<br />
Q-o-Q Y-o-Y<br />
19.0% 1.7%<br />
13.9%<br />
21.9%<br />
(19.6%)<br />
18.2%<br />
Q1 FY 10 Q4 FY 09 Q1 FY 09<br />
Domestic<br />
International
Turkey Airport (ISGIA): <strong>Financial</strong> <strong>Performance</strong><br />
Rs. mn<br />
1<br />
2<br />
Quarterly Results<br />
Annual Results<br />
Q4 FY 09 Q1 FY 10 Q1 FY 09 FY 09<br />
Gross Revenue 365 604 586 2,669<br />
Aero Revenue – – – –<br />
Non Aero Revenue 365 604 586 2,669<br />
Less: Revenue Share – – – –<br />
Net Revenue 365 604 586 2,669<br />
Total Expenditure 414 491 593 2,573<br />
EBITDA (49) 113 (8) 96<br />
EBITDA margin (13)% 18.7% (1.3)% 3.59%<br />
Other Income (90) – – (67)<br />
Interest & Finance Charges (8) 10 17 14<br />
Depreciation 69 148 86 394<br />
PBT (200) (44) (110) (380)<br />
Tax (73) (22) 0 (61)<br />
PAT (Before Minority Interest) (127) (23) (110) (319)<br />
PAT Margin (34.0)% (3.7)% (18.9)% (11.9)%<br />
Cash Profit (58) 106 (24) 13<br />
* All <strong>Financial</strong> Numbers represent GIL’s 40% ownership share<br />
* Q1 FY09 numbers represents results for May 2008 & June 2008 (SGIA assumed control of Project in May 2008)<br />
1<br />
Increase in Q1 FY10 EBITDA (YoY) is mainly due to Revenue mix shift from 1) Increase in higher margin Duty-Free and Passenger Service<br />
Fees revenue; 2) Reduction in lower margin Fuel Sale revenue.<br />
2<br />
Increase in Q1 FY10 Depreciation (YoY) due to capitalization of Car Parking.
Airports Segment: <strong>Financial</strong> <strong>Performance</strong><br />
Rs. mn<br />
Quarterly Results<br />
Annual Results<br />
Q4 FY09 Q1 FY10 Q1 FY09 FY 09 FY 08<br />
Gross Revenue 4,020 4,475 3,862 16,729 8,770<br />
Aero Revenue 1,438 1,549 1,271 5,478 3,238<br />
Non Aero Revenue 2,582 2,897 2,592 11,251 5,532<br />
Mgmt Services 0 29 0<br />
Less: Revenue Share 1,156 1,235 1,093 4,570 4,031<br />
Net Revenue 2,864 3,240 2,769 12,159 4,739<br />
Total Expenditure 2,223 2,067 2,274 9,881 4,380<br />
EBITDA 640 1,174 495 2,278 359<br />
EBITDA margin 15.9% 36.2% 17.9% 18.7% 7.6%<br />
Other Income (75) 18 27 37 91<br />
Interest & Finance Charges 653 836 317 2,036 25<br />
Depreciation 595 722 375 2,077 119<br />
PBT (682) (365) (170) (1797) 307<br />
Tax 202 (54) 14 (120) 317<br />
PAT (Before Minority Interest) (481) (311) (185 (1678) (11)<br />
PAT Margin (11.9)% (9.6)% (6.7)% (13.8)% (0.2)%<br />
Minority Interest (165) (115) 2 (497) 78<br />
PAT (After Minority Interest) (316) (197) (187) (1181) (88)<br />
Cash Profit 114 355 192 204 398
Energy Segment
Click to edit Master title style<br />
Diversified Portfolio of Energy Assets<br />
Project<br />
Recent Developments<br />
Project Pipeline<br />
Vemagiri<br />
Expansion<br />
(768 MW)<br />
<strong>GMR</strong> Energy<br />
(Mangalore)<br />
(235 MW)<br />
768 MW expansion planned<br />
Adequate land available at the site<br />
KG Basin Gas allocation expected<br />
100% of Power on Merchant Tariff<br />
To be relocated to Kakinada by Apr 2010<br />
Gas allocated from KG Basin<br />
9,000<br />
8,000<br />
7,000<br />
6,000<br />
5,000<br />
4,000<br />
3,000<br />
2,000<br />
1,000<br />
0<br />
823<br />
2,418<br />
1,200<br />
2,460<br />
730 7,631<br />
Kamalanga<br />
(1,050 MW)<br />
Achieved financial closure for ~Rs. 45 bn<br />
EPC contract awarded to SEPCO of<br />
China<br />
2009 2012 2013 2014 2015 Ultimate Capac<br />
Chattisgarh<br />
(1,200 MW)<br />
Land acquired<br />
Evaluating bids for BTG and BoP<br />
package<br />
Recommended for coal linkage by CEA 1<br />
Operational <strong>Performance</strong> (PLF)<br />
Q1FY 10 Q4 FY09 Q1 FY09<br />
Acquired 100% stake of Thermal Coal<br />
Plant in Maharashtra<br />
<strong>GMR</strong> Energy<br />
(220 MW)<br />
28 % 90 % 28 %<br />
EMCO<br />
Energy<br />
(600 MW)<br />
Land acquired<br />
Key approvals such as Coal Linkages,<br />
Water Allocation, MOEF 2 Approval<br />
received<br />
Construction to commence in Q4 FY10<br />
<strong>GMR</strong> Power<br />
(200 MW)<br />
Vemagiri<br />
(388 MW)<br />
84 % 78 % 86 %<br />
80 % 39 % 25 %<br />
1 CEA: Central Electricity Authority<br />
2 MOEF: Ministry of Environment and Forestry
Click to edit Master title style<br />
Energy Segment: Quarterly Operational <strong>Performance</strong><br />
Total Portfolio Q1 FY 2010 – 1,202 mn Units<br />
Power Offtake Break-up<br />
Fuel Source Break-up<br />
Merchant,<br />
136 mn Units<br />
11%<br />
Liquid Fuel Plant,<br />
504 mn Units<br />
42%<br />
Contracted,<br />
1,066 mn Units<br />
89%<br />
Gas Plant,<br />
698 mn Units<br />
58%<br />
Vemagiri Power <strong>GMR</strong> Energy <strong>GMR</strong> Power<br />
INR per Unit INR per Unit INR per Unit
Energy Sector: <strong>Financial</strong> <strong>Performance</strong><br />
1<br />
Rs. mn<br />
Quarterly Results<br />
Annual Results<br />
Q4 FY09 Q1 FY10 Q1 FY09 FY 09 FY 08<br />
Gross Revenue 6,537 6,356 5,114 21,527 15,530<br />
Contracted 2,680 4,064 5,071 13,555 15,412<br />
Merchant Sale 2,609 912 – 4,784 –<br />
Power Trading 930 1,308 – 1,320 –<br />
Management Fees 318 72 44 1,868 118<br />
Cost of Fuel 3,723 3,707 3,824 13,450 10,237<br />
Operating Expenses 1,727 1,700 202 2,737 1,794<br />
EBITDA 1,087 949 1,088 5,341 3,499<br />
EBITDA margin 16.5% 14.9% 21.3% 24.8% 22.5%<br />
Other Income 2 31 39 114 511<br />
Interest & Finance Charges (Net) 243 310 217 955 1,065<br />
Depreciation 283 300 293 1,172 1,175<br />
PBT 563 370 617 3,328 1,770<br />
Tax 77 64 77 283 184<br />
PAT (Before Minority Interest) 486 306 540 3,045 1,586<br />
PAT Margin 7.3% 4.8% 10.6% 14.1% 10.2%<br />
Minority Interest 6 95 80 310 276<br />
PAT (After Minority Interest) 480 211 461 2735 1,310<br />
Cash Profit 769 606 833 4,217 2,760<br />
1<br />
Increase in Q1 FY10 Operating Expenses (YoY) due to initiation of Power Trading by <strong>GMR</strong> Energy Trading Ltd. (GETL) in [ ].
Highways & Urban Infrastructure Segments
Highways: Building Paths to Progress<br />
Recent Developments<br />
Highways - Annuity per Month (Rs. mn)<br />
Tindivanam - Ulundurpet commenced<br />
Commercial Operations on 23 Jul 2009<br />
73 kms, 4 lane project on a Toll Basis<br />
Awarded the Hyderabad - Vijaywada project<br />
181 kms, 4 lane project on a Toll Basis<br />
Total estimated outlay of Rs. 22,000 mn<br />
Awarded the Chennai Outer Ring Road project<br />
Highways - Toll Collection per Month (Rs. mn)<br />
30 kms, 6 lane and 2 Service Road on an<br />
Annuity Basis<br />
Total estimated outlay of Rs. 11,000 mn<br />
Shortlisted to submit price bids for 8 Projects<br />
Total estimated outlay of Rs. 99,710 mn
Highways: <strong>Financial</strong> <strong>Performance</strong><br />
Rs. mn<br />
1<br />
Quarterly Results<br />
Annual Results<br />
Q4 FY09 Q1 FY10 Q1 FY 09 FY 09 FY 08<br />
Gross Revenue 464 764 347 1,523 1,397<br />
Annuity Income 365 617 347 1,414 1,397<br />
Toll Collection 99 147 – 109 –<br />
Operating Expenses 70 111 60 266 217<br />
EBITDA 394 653 287 1,257 1,180<br />
EBITDA margin 84.91% 85.5% 82.7% 82.5% 84.5%<br />
Other Income 10 7 5 14.71 1.6<br />
Interest & Finance Charges (Net) 178 379 66 392 273<br />
Depreciation 179 308 113 557 443<br />
PBT 47 (27) 113 322 465<br />
Tax 13 14 13 56 49<br />
PAT (Before Minority Interest) 34 (41) 100 267 417<br />
PAT Margin 7% (5)% 29% 17.52% 29.84%<br />
Minority Interest 38 35 39 163 190<br />
PAT (After Minority Interest) (4) (76) 61 104 227<br />
Cash Profit 213 267 213 824 860<br />
1<br />
Increase in Q1 FY10 Gross Revenue (YoY) due to induction of revenue from Ambala, Jadcherala & Pochanpally Highway Projects.
Urban Infrastructure and Construction<br />
Urban Infrastructure Segment<br />
Construction Division<br />
~50% of 3,300 acres of land acquired for Multi-Product<br />
SEZ in Krishnagiri, Tamil Nadu<br />
SEZ to focus on Biotechnology, IT & ITES,<br />
Electronics & Engineering Industries<br />
Phase-I (around 250 acres) to cost ~Rs. 10 bn<br />
Finalization of MoU to initiate Phase-I<br />
Signed Agreement with SEPCO (Chinese supplier) for<br />
Kamalanga Project in Orrissa<br />
Township Development & Parts of Balance of Plants<br />
Submitted bids for Highway Projects<br />
Hyderabad – Vijaywada & Chennai ORR Projects<br />
Completed Break-water structure at GEL – Barge
Urban Infrastructure & Others: <strong>Financial</strong> <strong>Performance</strong><br />
Rs. mn<br />
Quarterly Results<br />
Annual Results<br />
Q4 FY09 Q1 FY10 Q1 FY09 FY 09 FY 08<br />
Gross Revenue 3,223 1,415 624 4,983 1,282<br />
Income from Investment 338 186 588 1,756 1,098<br />
Operating Income 2,885 1,229 36 3,226 184<br />
Operating Expenses 2,673 979 108 3,188 335<br />
EBITDA 749 436 517 1,794 947<br />
EBITDA margin 23.2% 30.8% 82.8% 36.0% 73.8%<br />
Other Income 56 65 2 45.6 94.1<br />
Interest & Finance Charges (Net) 79 73 89 299 324<br />
Depreciation 47 43 18 93 49<br />
PBT 679 385 412 1,448 668<br />
Tax 296 99 -2 310.9 33.5<br />
PAT (Before Minority Interest) 383 286 414 1,137 634<br />
PAT Margin 11.8% 20.2% 66.3% 22.8% 49.5%<br />
Cash Profit 430 315 419 1,194 673<br />
1<br />
<br />
Increase in Q1 FY10 Operating Income (YoY) due to Income from Construction JV for Turkey Airport Project
Consolidated <strong>Financial</strong> <strong>Performance</strong>
Consolidated Profitability Statement<br />
Rs. mn<br />
Quarterly Results<br />
Annual Results<br />
Q4 FY09 Q1 FY10 Q1 FY09 FY 09 FY 08<br />
Gross Revenue 14,434 13,010 9,948 44,762 26,979<br />
Airports 4,020 4,475 3,862 16,729 8,770<br />
Power 6,528 6,356 5,114 21,527 15,530<br />
Roads 465 764 347 1,523 1,397<br />
Other 3,421 1,415 625 4,981 1,282<br />
Net Revenue 13,278 11,775 8,855 40,192 22,948<br />
Total Expenditure 10,416 8,563 6,468 29,524 16,963<br />
EBITDA 2,862 3,213 2,387 10,668 5,985<br />
EBITDA margin 19.8% 27.3% 27.0% 26.5% 26.1%<br />
Other Income (7) 121 72 214 698<br />
Interest & Finance Charges (Net) 1,152 1598 689 3,682 1,687<br />
Depreciation 1,105 1373 799 3,898 1,785<br />
PBT 598 362 972 3,301 3,210<br />
Tax 186 122 102 530 584<br />
PAT (Before Minority Interest) 412 240 870 2,771 2,627<br />
PAT Margin 2.8% 2.0% 9.8% 6.9% 11.4%<br />
Minority Interest (120) 15 121 (23) 526<br />
PAT (After Minority Interest) 532 225 749 2,794 2,101<br />
Cash Profit 1,517 1,544 1,656 6,438 4,692
Consolidated Balance-Sheet<br />
Rs. mn<br />
Quarterly Results Annual Results<br />
Q1 FY10 Q1 FY09 FY 09 FY 08<br />
Equity 3667 3641 3641 3641<br />
Reserves & Surplus 62740 58415 61070 57531<br />
Minority Interest 17846 13002 18061 11126<br />
Total Networth 84,254 75,059 82,840 72,300<br />
Total Debt 147,870 85,021 120,240 79,770<br />
Secured 126,002 73,453 106,604 68,438<br />
Unsecured 21,872 11,568 13,636 11,332<br />
Deffered Tax Liability 122 413 190 430<br />
Total Liabilities 232,250 160,493 203,270 152,500<br />
Gross Block 119984 70717 114326 66917<br />
Less: Accumulated Depreciation 19003 14933 17809 14218<br />
Net Fixed Assets 100,980 55,784 96,520 52,700<br />
Capital Work in Progress 82,090 57,680 67,910 45,230<br />
Investment 23,366 42,531 14,110 49,000<br />
Cash & Bank Balance 24,495 7,078 23,660 8,940<br />
Net Current Assets 1,319 (2,580) 1,070 (3,370)<br />
Total Assets 232,250 160,493 203,270 152,500
Segment-wise <strong>Financial</strong> <strong>Performance</strong> for Q1 FY2010<br />
Net Revenue<br />
EBITDA<br />
12%<br />
6%<br />
28%<br />
54%<br />
Total = Rs. 11.78 bn<br />
Total = Rs. 3.2 bn<br />
Cash Profit<br />
Capital Employed<br />
Total = Rs. 1.5 bn<br />
Total = Rs. 84.38 bn<br />
Power Airports Highways Others
InterGen: <strong>Financial</strong> <strong>Performance</strong><br />
US$ In Mn<br />
Half yearly Results<br />
Annual Results<br />
H2 CY08 H1 CY09 H1 CY08 CY08 CY 07<br />
Revenue – Proportional 1,152 915 1,017 2,169 1,748<br />
Revenue – Consol 761 602 679 1,440 1,113<br />
EBITDA-Tier I 188 98 241 429 405<br />
EBITDA-Tier II 136 122 78 214 242<br />
Corporate & Development (21) 18 (18) (39) (118)<br />
Consol EBITDA 303 238 301 604 529<br />
Consolidated Debt (Proportional) 4,113 4,298 4,225 3,208 4,090<br />
Proportional Adjusted EBITDA<br />
Tier I<br />
Coryton 75 46 111 186 179<br />
Rocksavage 35 (7) 51 85 83<br />
Spalding 38 52 48 87 73<br />
LaRosita 40 6 31 71 69<br />
Tier II<br />
Rijnmond 49 26 17 66 61<br />
Millmerran 9 12 23 32 32<br />
Callide 1 9 (10) (9) 33<br />
Quezon 38 33 33 71 72<br />
Bijio 26 28 15 40 45<br />
Campeche 9 (12) - 9 -<br />
Chihuahua 4 13 - 4 -<br />
Libramiento 0.9 11 - 0.9 -<br />
1<br />
Decrease in H1 CY09 EBITDA (YoY) due to expected events such as,<br />
1) expiration of Coryton Gas supply contract in 2008; 2) major planned outages combines with weaker spark spread market outcome in 2009;<br />
Positively impacted by events such as 1) acquisition of chihuahua and librammiento acquisition; 2) rebalancing foreign currency hedges
Operating Assets to Drive Revenue Growth<br />
Mar 2009<br />
FY15<br />
Energy<br />
Bajoli Holi<br />
Upper Karnali<br />
Upper Marsyangdi<br />
FY13<br />
Energy<br />
Chhattisgarh<br />
FY14<br />
Energy<br />
Coastal Power<br />
Plants<br />
Alaknanda<br />
Talong<br />
Highways<br />
Hyderabad-Vijayawada<br />
Chennai-Outer ring road<br />
730 MW<br />
FY10<br />
Airport<br />
Delhi T3<br />
Turkey<br />
FY12<br />
Energy<br />
Kamalanga<br />
Vemagiri Expansion<br />
EMCO<br />
1,200 MW<br />
210 kms<br />
2,460 MW<br />
Mar 2015<br />
Airports<br />
(2)<br />
Energy<br />
(13)<br />
Highways<br />
(8)<br />
Intl.<br />
(1)<br />
Highways<br />
Ulundurpet -<br />
Tindivanam<br />
54 mn PAX<br />
73 kms<br />
2,418 MW<br />
72 mn PAX 7,631 MW 631 kms<br />
Hyderabad<br />
Delhi<br />
Coal – 4<br />
Gas – 3<br />
Liquid fuel – 1<br />
Hydro – 5<br />
Annuity–4<br />
Toll–4<br />
25 mn PAX<br />
800 MW<br />
Turkey<br />
Island Power
Asset Growth Over Next Five Years<br />
Assets Under Operations<br />
Assets Under Construction<br />
Capital Outlay : Rs. 90.97 bn;<br />
Equity : Rs. 26.99 bn; Debt : Rs. 63.99 bn<br />
Capital Outlay: Rs. 164.92 bn;<br />
Equity : Rs. 58.93 bn; Debt : Rs. 106.09 bn<br />
Assets Under Development<br />
Total Assets Base<br />
Capital Outlay: Rs. 258.23 bn;<br />
Equity : Rs. 58.3 bn; Debt : Rs. 187.78 bn<br />
Capital Outlay: Rs. 514.12 bn;<br />
Equity : Rs. 144.12 bn; Debt : Rs. 357.86 bn<br />
Power Airports Highways Others
Thank You