Hain, M., Strecker, M.R., Bookhagen, B., Alonso, R.N., Pingel, H. and ...
Hain, M., Strecker, M.R., Bookhagen, B., Alonso, R.N., Pingel, H. and ...
Hain, M., Strecker, M.R., Bookhagen, B., Alonso, R.N., Pingel, H. and ...

You also want an ePaper? Increase the reach of your titles
YUMPU automatically turns print PDFs into web optimized ePapers that Google loves.
TC2006<br />
HAIN ET AL.: SALTA FORELAND FRAGMENTATION<br />
TC2006<br />
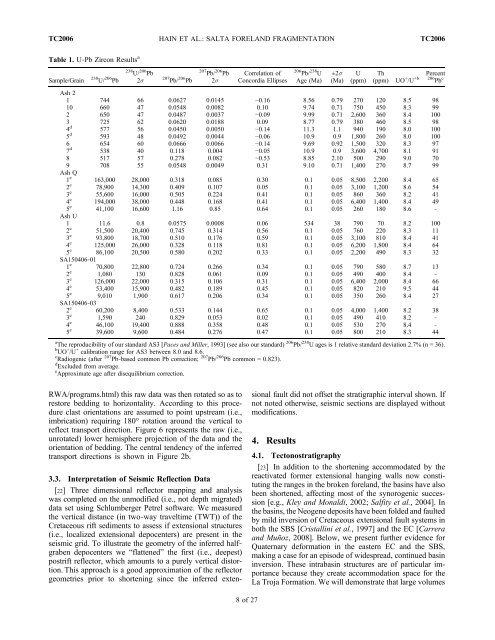
Table 1. U‐Pb Zircon Results a<br />
Sample/Grain<br />
238 U/ 206 Pb<br />
238 U/ 206 Pb<br />
2s<br />
207 Pb/ 206 Pb<br />
207 Pb/ 206 Pb<br />
2s<br />
Correlation of<br />
Concordia Ellipses<br />
206 Pb/ 238 U<br />
Age (Ma)<br />
±2s<br />
(Ma)<br />
U<br />
(ppm)<br />
Th<br />
Percent<br />
(ppm) UO + /U +b 206 Pb c<br />
Ash 2<br />
1 744 66 0.0627 0.0145 −0.16 8.56 0.79 270 120 8.5 98<br />
10 660 47 0.0548 0.0082 0.10 9.74 0.71 750 450 8.3 99<br />
2 650 47 0.0487 0.0037 −0.09 9.99 0.71 2,600 360 8.4 100<br />
3 725 62 0.0620 0.0188 0.09 8.77 0.79 380 460 8.5 98<br />
4 d 577 56 0.0450 0.0050 −0.14 11.3 1.1 940 190 8.0 100<br />
5 d 593 48 0.0492 0.0044 −0.06 10.9 0.9 1,800 260 8.0 100<br />
6 654 60 0.0666 0.0066 −0.14 9.69 0.92 1,500 320 8.3 97<br />
7 d 538 40 0.118 0.004 −0.05 10.9 0.9 3,600 4,700 8.1 91<br />
8 517 57 0.278 0.082 −0.53 8.85 2.10 500 290 9.0 70<br />
9 708 55 0.0548 0.0049 0.31 9.10 0.71 1,400 270 8.7 99<br />
Ash Q<br />
1 e 163,000 28,000 0.318 0.085 0.30 0.1 0.05 8,500 2,200 8.4 65<br />
2 e 78,900 14,300 0.409 0.107 0.05 0.1 0.05 3,100 1,200 8.6 54<br />
3 e 55,600 16,000 0.505 0.224 0.41 0.1 0.05 860 360 8.2 41<br />
4 e 194,000 38,000 0.448 0.168 0.41 0.1 0.05 6,400 1,400 8.4 49<br />
5 e 41,100 16,600 1.16 0.85 0.64 0.1 0.05 260 180 8.6 ‐<br />
Ash U<br />
1 11.6 0.8 0.0575 0.0008 0.06 534 38 790 70 8.2 100<br />
2 e 51,500 20,400 0.745 0.314 0.56 0.1 0.05 760 220 8.3 11<br />
3 e 93,800 18,700 0.510 0.176 0.59 0.1 0.05 3,100 810 8.4 41<br />
4 e 125,000 26,000 0.328 0.118 0.81 0.1 0.05 6,200 1,800 8.4 64<br />
5 e 86,100 20,500 0.580 0.202 0.33 0.1 0.05 2,200 490 8.3 32<br />
SA150406‐01<br />
1 e 70,800 22,800 0.724 0.266 0.34 0.1 0.05 790 580 8.7 13<br />
2 e 1,080 130 0.828 0.061 0.09 0.1 0.05 490 400 8.4 ‐<br />
3 e 126,000 22,000 0.315 0.106 0.31 0.1 0.05 6,400 2,000 8.4 66<br />
4 e 53,400 15,900 0.482 0.189 0.45 0.1 0.05 820 210 9.5 44<br />
5 e 9,010 1,900 0.617 0.206 0.34 0.1 0.05 350 260 8.4 27<br />
SA150406‐03<br />
2 e 60,200 8,400 0.533 0.144 0.65 0.1 0.05 4,000 1,400 8.2 38<br />
3 e 1,590 240 0.829 0.053 0.02 0.1 0.05 490 410 8.2 ‐<br />
4 e 46,100 19,400 0.888 0.358 0.48 0.1 0.05 530 270 8.4 ‐<br />
5 e 39,600 9,600 0.484 0.276 0.47 0.1 0.05 800 210 8.3 44<br />
a The reproducibility of our st<strong>and</strong>ard AS3 [Paces <strong>and</strong> Miller, 1993] (see also our st<strong>and</strong>ard) 206 Pb/ 238 U ages is 1 relative st<strong>and</strong>ard deviation 2.7% (n = 36).<br />
b UO + /U + calibration range for AS3 between 8.0 <strong>and</strong> 8.6.<br />
c Radiogenic (after 207 Pb‐based common Pb correction; 207 Pb/ 206 Pb common = 0.823).<br />
d Excluded from average.<br />
e Approximate age after disequilibrium correction.<br />
RWA/programs.html) this raw data was then rotated so as to<br />
restore bedding to horizontality. According to this procedure<br />
clast orientations are assumed to point upstream (i.e.,<br />
imbrication) requiring 180° rotation around the vertical to<br />
reflect transport direction. Figure 6 represents the raw (i.e.,<br />
unrotated) lower hemisphere projection of the data <strong>and</strong> the<br />
orientation of bedding. The central tendency of the inferred<br />
transport directions is shown in Figure 2b.<br />
3.3. Interpretation of Seismic Reflection Data<br />
[22] Three dimensional reflector mapping <strong>and</strong> analysis<br />
was completed on the unmodified (i.e., not depth migrated)<br />
data set using Schlumberger Petrel software. We measured<br />
the vertical distance (in two‐way traveltime (TWT)) of the<br />
Cretaceous rift sediments to assess if extensional structures<br />
(i.e., localized extensional depocenters) are present in the<br />
seismic grid. To illustrate the geometry of the inferred halfgraben<br />
depocenters we “flattened” the first (i.e., deepest)<br />
postrift reflector, which amounts to a purely vertical distortion.<br />
This approach is a good approximation of the reflector<br />
geometries prior to shortening since the inferred extensional<br />
fault did not offset the stratigraphic interval shown. If<br />
not noted otherwise, seismic sections are displayed without<br />
modifications.<br />
4. Results<br />
4.1. Tectonostratigraphy<br />
[23] In addition to the shortening accommodated by the<br />
reactivated former extensional hanging walls now constituting<br />
the ranges in the broken forel<strong>and</strong>, the basins have also<br />
been shortened, affecting most of the synorogenic succession<br />
[e.g., Kley <strong>and</strong> Monaldi, 2002; Salfity et al., 2004]. In<br />
the basins, the Neogene deposits have been folded <strong>and</strong> faulted<br />
by mild inversion of Cretaceous extensional fault systems in<br />
both the SBS [Cristallini et al., 1997] <strong>and</strong> the EC [Carrera<br />
<strong>and</strong> Muñoz, 2008]. Below, we present further evidence for<br />
Quaternary deformation in the eastern EC <strong>and</strong> the SBS,<br />
making a case for an episode of widespread, continued basin<br />
inversion. These intrabasin structures are of particular importance<br />
because they create accommodation space for the<br />
La Troja Formation. We will demonstrate that large volumes<br />
8of27