V - DWC
V - DWC
V - DWC

You also want an ePaper? Increase the reach of your titles
YUMPU automatically turns print PDFs into web optimized ePapers that Google loves.
56<br />
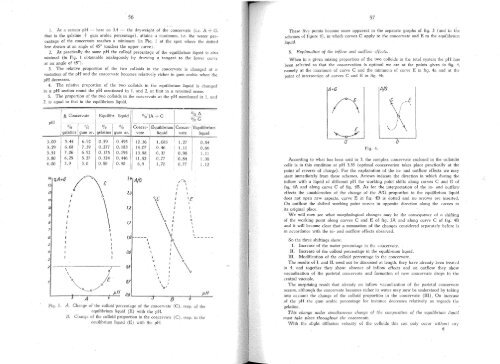
1. At a certain pH -- here ca 3.4 - the dryweight of the coacervate (i.c. A -+ G.<br />
that is the gelatine -+ gum arabic percentage). attains a maximum, i.e. the water percentage<br />
of the coacervate reaches a minimum (in Fig.lat the spot where the dotted<br />
Jine drawn at an angle of 45° touches the upper curve).<br />
2. At practicaJly the same pH the coJloid percentage of the equilibrium Jiquid is also<br />
minimal (in Fig. 1 obtainable analogously by drawing a tangent to the lower curve<br />
at an angle of 45°).<br />
3. The relative proportion of the two colJoids in the coacervate is changed at a<br />
variatiol1 of the pH and the coacervate becomes relatively richel' in gum arabic when the<br />
pH decreases.<br />
4. The relative proportion of the two colloids in the equilibrium liquid is changed<br />
in a pH section round the pH mentioned in 1. and 2. at first in a reversed sense.<br />
5. The proportion of the two colJoids in the coacervate at the pH mentioned in 1. and<br />
2. is equal to that in the equilibrium Jiquid.<br />
pH -- : -<br />
I<br />
% % %<br />
i gelatine gum ar.] gelatine<br />
3.00 5.44 6.92 0.59<br />
3.29 6.68 7.39 0.277<br />
3.51 7.06 6.92 0.175<br />
3.80 6.25 5.27 0.324<br />
4.00 3.9 3.0 0.80<br />
fit<br />
%A+6<br />
%lA+G<br />
%A<br />
o/;G<br />
I ----- --- -----------------,.------------ -_.---------<br />
I 1 1<br />
% i Coacer- I Equilibrium I Coacer- ! Equilibrium<br />
gum ar. I va te I liquid vate I liquid<br />
1<br />
0.495 1 12.36 I 1.085<br />
1<br />
1.27 0.84<br />
1<br />
0.183<br />
1<br />
14.07 ! 0.46 1.11 0.66<br />
1<br />
0 ..195<br />
13.98 0.37 0.98 I 1. 11<br />
i<br />
0.446 11 1 J .52 0.77 I 0.84 1. 38<br />
0.90 6.9<br />
I<br />
1. 70 0.77 I 1.12<br />
I1<br />
1 1<br />
1.'t A/6<br />
IO~\c<br />
~-o<br />
I<br />
13 I I<br />
12 1.3 I<br />
I 0<br />
'\<br />
11 IE<br />
I<br />
\<br />
I<br />
10 I<br />
1.2 I<br />
g<br />
0 0<br />
0<br />
8 1.1<br />
\'<br />
I<br />
7 0<br />
6<br />
1.0<br />
\<br />
1 \<br />
of I \<br />
!\<br />
I \<br />
I 09 \<br />
" I \<br />
3<br />
0 0<br />
2 0.8<br />
\ \ \0<br />
Fig. 3.<br />
ft<br />
\<br />
\<br />
\ \<br />
o<br />
0,1 \<br />
I<br />
~ 0 '0/<br />
i<br />
1 0 \ .... _----<br />
°--'0/<br />
pH<br />
0.6 pH<br />
1<br />
.ç.<br />
A<br />
8 4<br />
A. Change of the colloid 'percentage of the coacervate (C), resp. of the<br />
equilibrium liquid (E) with the pH.<br />
B. Change of the colJoid proportion in the coacervate (C), resp. in the<br />
eauilibrium liqll'id (E) with the pH.<br />
57<br />
These five points become more apparent in the separate graphs of fig. 3 (and in the<br />
schemes of figure 4), in which curves C apply to the coacervate and E to the equilibrium<br />
liquid.<br />
8. Explanation of the in[low ancl outflow etfeds.<br />
Wh en in a given mixing proportion of tbe two colloids in the total system the pH has<br />
been selected so that the coacervation is optimal we are at tbe points given in fig. 4,<br />
namely at the maximum of curve C and the minimum of curve E in fig. 4a and at the<br />
point of intersection of curves C and E in fig. 4b.<br />
o<br />
Fig. 4.<br />
A/G<br />
c ,, __ .{<br />
.<br />
• I<br />
'<br />
"-~'"<br />
I<br />
I<br />
I<br />
I<br />
b<br />
I<br />
I<br />
I<br />
,/ \<br />
According to what has been said in 3. the complex coacervate enclosed in the celloidin<br />
cells is in this condition at pH 3.35 (optimal coacervation takes place practically at the<br />
point of reverse of charge). For the explanation of the in- and outflow eHects we may<br />
start immediately from tbese schemes. Arrows indieate the direction in which during the<br />
inflow with a Iiquid of different pH thc working point shifts along curves C and E of<br />
fig. 4A and along curve C of fig. 4B. As for the interprctation of the in- and outflow<br />
eHeets thecol1sideration of the change of the AlG proportion in the equilibrium liquid<br />
does not open ncw aspects, curve E in fig. 4B is dotted and no arrows arc inserted.<br />
On outflow the shifted working point moves in opposite direction along the curves to<br />
its original place.<br />
We wil! now see what morphological changes may be the consequence of a shifting<br />
of the working point along curves C and E of fig. 3A and along curve C of fig. 4B<br />
and it wil! become deal' that a summation of the changes considered separate1y before is<br />
in accOl'dance with the in- and outflow eHeets observed.<br />
So the three shiftings sbow:<br />
I. Increase of the water percentage in thc coacervate.<br />
H. Increase of the colloid percentage in the equilibrium liquid.<br />
In. Modification of the colloid percentage in the coacervate.<br />
The results of I. and 11. need not be discussed at length, they have already been treated<br />
in 4. and together they show: absence of inflow eHects and on outflow they show<br />
vacuolization of the parietal coacervate and formation of new coacervate drops in the<br />
central vacuole.<br />
The surprising result that alrcady on in flow vacuolization of thc parietal coacervate<br />
occurs, although the coacervate becomes richel' in water may rlOW be understood by taking<br />
into acc~unt the change of tbc colloid proportion in the coacervate (lIl). On increase<br />
of thc pH the gum arabic percentage for instance d('creases relatively as regards the<br />
gelatine.<br />
This change uncler sinwltaneolls change of t!ze composition of the equilibrium liquicl<br />
must take place throughollt the eoacervate.<br />
With the slight diffusion velocity of the colloids this can only occur without any