Annual Report 2009 - British American Tobacco
Annual Report 2009 - British American Tobacco
Annual Report 2009 - British American Tobacco

Create successful ePaper yourself
Turn your PDF publications into a flip-book with our unique Google optimized e-Paper software.
OVERVIEW<br />
The Group grew revenue by 17 per cent<br />
in very difficult times, to £14,208 million.<br />
This was the result of favourable exchange<br />
rate movements, good pricing momentum,<br />
volume from acquisitions made in the middle<br />
of 2008 (Skandinavisk Tobakskcompagni (ST)<br />
and Tekel) and the acquisition of Bentoel in<br />
June <strong>2009</strong>. Revenue increased by 10 per cent<br />
at constant rates of exchange. All the regions<br />
contributed to this good result.<br />
The reported profit from operations was<br />
15 per cent higher at £4,101 million. Adjusted<br />
profit from operations was 20 per cent higher<br />
and would have been up 10 per cent at<br />
constant rates of exchange, despite the adverse<br />
transactional impact of exchange rates on costs.<br />
Group volumes from subsidiaries were<br />
724 billion, an increase of 1 per cent, as a result<br />
of the acquisitions of ST, Tekel and Bentoel.<br />
Americas<br />
Western<br />
Europe<br />
Africa and<br />
Middle East<br />
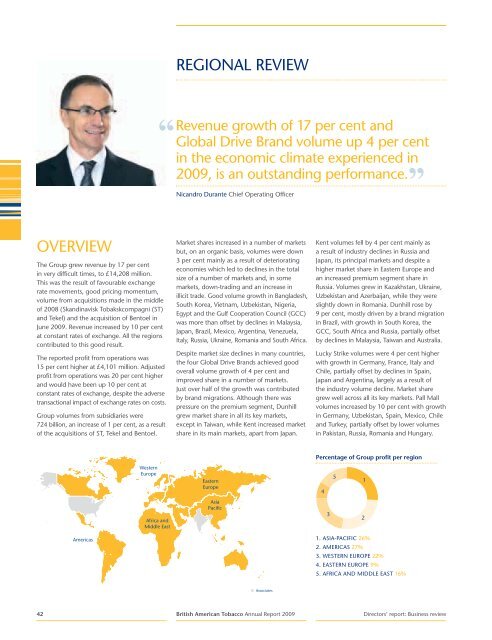
REGIONAL REVIEW<br />
“ Revenue growth of 17 per cent and<br />
Global Drive Brand volume up 4 per cent<br />
in the economic climate experienced in<br />
<strong>2009</strong>, is an outstanding performance. ”<br />
Nicandro Durante Chief Operating Officer<br />
Market shares increased in a number of markets<br />
but, on an organic basis, volumes were down<br />
3 per cent mainly as a result of deteriorating<br />
economies which led to declines in the total<br />
size of a number of markets and, in some<br />
markets, down-trading and an increase in<br />
illicit trade. Good volume growth in Bangladesh,<br />
South Korea, Vietnam, Uzbekistan, Nigeria,<br />
Egypt and the Gulf Cooperation Council (GCC)<br />
was more than offset by declines in Malaysia,<br />
Japan, Brazil, Mexico, Argentina, Venezuela,<br />
Italy, Russia, Ukraine, Romania and South Africa.<br />
Despite market size declines in many countries,<br />
the four Global Drive Brands achieved good<br />
overall volume growth of 4 per cent and<br />
improved share in a number of markets.<br />
Just over half of the growth was contributed<br />
by brand migrations. Although there was<br />
pressure on the premium segment, Dunhill<br />
grew market share in all its key markets,<br />
except in Taiwan, while Kent increased market<br />
share in its main markets, apart from Japan.<br />
Eastern<br />
Europe<br />
Asia<br />
Pacific<br />
Kent volumes fell by 4 per cent mainly as<br />
a result of industry declines in Russia and<br />
Japan, its principal markets and despite a<br />
higher market share in Eastern Europe and<br />
an increased premium segment share in<br />
Russia. Volumes grew in Kazakhstan, Ukraine,<br />
Uzbekistan and Azerbaijan, while they were<br />
slightly down in Romania. Dunhill rose by<br />
9 per cent, mostly driven by a brand migration<br />
in Brazil, with growth in South Korea, the<br />
GCC, South Africa and Russia, partially offset<br />
by declines in Malaysia, Taiwan and Australia.<br />
Lucky Strike volumes were 4 per cent higher<br />
with growth in Germany, France, Italy and<br />
Chile, partially offset by declines in Spain,<br />
Japan and Argentina, largely as a result of<br />
the industry volume decline. Market share<br />
grew well across all its key markets. Pall Mall<br />
volumes increased by 10 per cent with growth<br />
in Germany, Uzbekistan, Spain, Mexico, Chile<br />
and Turkey, partially offset by lower volumes<br />
in Pakistan, Russia, Romania and Hungary.<br />
42 <strong>British</strong> <strong>American</strong> <strong>Tobacco</strong> <strong>Annual</strong> <strong>Report</strong> <strong>2009</strong> Directors’ report: Business review<br />
Associates<br />
Percentage of Group profit per region<br />
4<br />
3<br />
5<br />
1. ASIA-PACIFIC 26%<br />
2. AMERICAS 27%<br />
3. WESTERN EUROPE 22%<br />
4. EASTERN EUROPE 9%<br />
5. AFRICA AND MIDDLE EAST 16%<br />
1<br />
2