Operating Book - Halifax Regional Municipality
Operating Book - Halifax Regional Municipality
Operating Book - Halifax Regional Municipality

Create successful ePaper yourself
Turn your PDF publications into a flip-book with our unique Google optimized e-Paper software.
Table of Contents<br />
Introduction . . . . . . . . . . . . . . . . . . . . . . . . . . . . . . . . . . . . . .<br />
HRM Map . . . . . . . . . . . . . . . . . . . . . . . . . . . . . . . . .<br />
Organizational Chart . . . . . . . . . . . . . . . . . . . . . . . . . . .<br />
B1<br />
B4<br />
B5<br />
Overview of Budgets . . . . . . . . . . . . . . . . . . . . . . . . . . . . . . . . . C1<br />
Budget Summary . . . . . . . . . . . . . . . . . . . . . . . . . . . . . C1<br />
<strong>Operating</strong> Budget . . . . . . . . . . . . . . . . . . . . . . . . . . . . . C2<br />
Project Budget . . . . . . . . . . . . . . . . . . . . . . . . . . . . . . C3<br />
Reserve Budget . . . . . . . . . . . . . . . . . . . . . . . . . . . . . . C5<br />
Key Assumptions . . . . . . . . . . . . . . . . . . . . . . . . . . . . . C5<br />
Significant Budgetary Issues and Challenges . . . . . . . . . . . . . . . C6<br />
Infrastructure & Asset Management . . . . . . . . . . . . . . . . . . . C6<br />
Provincial Assessment Cap . . . . . . . . . . . . . . . . . . . . . . . . C7<br />
Revenue Capacity . . . . . . . . . . . . . . . . . . . . . . . . . . . . . C7<br />
Challenges Ahead . . . . . . . . . . . . . . . . . . . . . . . . . . . . . C8<br />
Disaster Financial Assistance . . . . . . . . . . . . . . . . . . . . . . . C9<br />
Principles of Budgeting and Accounting . . . . . . . . . . . . . . . . . C9<br />
HRM Tax Structure . . . . . . . . . . . . . . . . . . . . . . . . . . . . C14<br />
Assessments and Taxation . . . . . . . . . . . . . . . . . . . . . . . . C16<br />
Accounting for Staff in HRM . . . . . . . . . . . . . . . . . . . . . . . C19<br />
Summary by Gross Expenditures and Revenues . . . . . . . . . . . . . C22<br />
Summary by Net Expenditures . . . . . . . . . . . . . . . . . . . . . . C23<br />
Summary by Expense and Revenue Types (Expenditures) . . . . . . . . C24<br />
Summary by Expense and Revenue Types (Revenues) . . . . . . . . . . C24<br />
Business Plans:<br />
Office of the Chief Administrator . . . . . . . . . . . . . . . . . . . . D1<br />
Service Level Changes . . . . . . . . . . . . . . . . . . . . . . . . . D14<br />
Summary of Gross Expenditures by Division . . . . . . . . . . . . . . D15<br />
Summary of Gross Revenue by Division . . . . . . . . . . . . . . . . D16<br />
Summary of Net Expenditures by Division . . . . . . . . . . . . . . . D17<br />
Summary by Expenditure & Revenue Types . . . . . . . . . . . . . . D18<br />
Office of the Auditor General . . . . . . . . . . . . . . . . . . . . . . Da1<br />
Summary of Gross Expenditures by Division . . . . . . . . . . . . . . Da1<br />
Summary of Gross Revenue by Division . . . . . . . . . . . . . . . . Da1<br />
Summary of Net Expenditures by Division . . . . . . . . . . . . . . . Da1<br />
Summary by Expenditure & Revenue Types . . . . . . . . . . . . . . Da1
Business Planning & Information Management . . . . . . . . . . . . E1<br />
Service Level Changes . . . . . . . . . . . . . . . . . . . . . . . . . E20<br />
Summary of Gross Expenditures by Division . . . . . . . . . . . . . . E21<br />
Summary of Gross Revenue by Division . . . . . . . . . . . . . . . . E23<br />
Summary of Net Expenditures by Division . . . . . . . . . . . . . . . E24<br />
Summary by Expenditure & Revenue Types . . . . . . . . . . . . . . E26<br />
Community Development . . . . . . . . . . . . . . . . . . . . . . . . F1<br />
Service Level Changes . . . . . . . . . . . . . . . . . . . . . . . . . F26<br />
Summary of Gross Expenditures by Division . . . . . . . . . . . . . . F27<br />
Summary of Gross Revenue by Division . . . . . . . . . . . . . . . . F30<br />
Summary of Net Expenditures by Division . . . . . . . . . . . . . . . F33<br />
Summary by Expenditure & Revenue Types . . . . . . . . . . . . . . F36<br />
Finance . . . . . . . . . . . . . . . . . . . . . . . . . . . . . . . . . . G1<br />
Service Level Changes . . . . . . . . . . . . . . . . . . . . . . . . . G11<br />
Summary of Gross Expenditures by Division . . . . . . . . . . . . . . G12<br />
Summary of Gross Revenue by Division . . . . . . . . . . . . . . . . G13<br />
Summary of Net Expenditures by Division . . . . . . . . . . . . . . . G14<br />
Summary by Expenditure & Revenue Types . . . . . . . . . . . . . . G15<br />
Fire & Emergency Services . . . . . . . . . . . . . . . . . . . . . . . H1<br />
Service Level Changes . . . . . . . . . . . . . . . . . . . . . . . . . H18<br />
Summary of Gross Expenditures by Division . . . . . . . . . . . . . . H19<br />
Summary of Gross Revenue by Division . . . . . . . . . . . . . . . . H20<br />
Summary of Net Expenditures by Division . . . . . . . . . . . . . . . H21<br />
Summary by Expenditure & Revenue Types . . . . . . . . . . . . . . H22<br />
Fiscal Services . . . . . . . . . . . . . . . . . . . . . . . . . . . . . . I1<br />
Summary of Gross Expenditures by Division . . . . . . . . . . . . . . I9<br />
Summary of Gross Revenue by Division . . . . . . . . . . . . . . . . I10<br />
Summary of Net Expenditures by Division . . . . . . . . . . . . . . . I11<br />
Summary by Expenditure & Revenue Types . . . . . . . . . . . . . . I12<br />
Summary of Non-Departmental Revenues . . . . . . . . . . . . . . . I13<br />
<strong>Halifax</strong> Libraries . . . . . . . . . . . . . . . . . . . . . . . . . . . . . J1<br />
Service Level Changes . . . . . . . . . . . . . . . . . . . . . . . . . J18<br />
Summary of Gross Expenditures by Division . . . . . . . . . . . . . . J19<br />
Summary of Gross Revenue by Division . . . . . . . . . . . . . . . . J20<br />
Summary of Net Expenditures by Division . . . . . . . . . . . . . . . J21<br />
Summary by Expenditure & Revenue Types . . . . . . . . . . . . . . J22
Human Resources . . . . . . . . . . . . . . . . . . . . . . . . . . . . K1<br />
Service Level Changes . . . . . . . . . . . . . . . . . . . . . . . . . K16<br />
Summary of Gross Expenditures by Division . . . . . . . . . . . . . . K17<br />
Summary of Gross Revenue by Division . . . . . . . . . . . . . . . . K17<br />
Summary of Net Expenditures by Division . . . . . . . . . . . . . . . K17<br />
Summary by Expenditure & Revenue Types . . . . . . . . . . . . . . K17<br />
HRM Police Services & RCMP . . . . . . . . . . . . . . . . . . . . . L1<br />
Service Level Changes . . . . . . . . . . . . . . . . . . . . . . . . . L13<br />
Summary of Gross Expenditures by Division . . . . . . . . . . . . . . L14<br />
Summary of Gross Revenue by Division . . . . . . . . . . . . . . . . L17<br />
Summary of Net Expenditures by Division . . . . . . . . . . . . . . . L19<br />
Summary by Expenditure & Revenue Types . . . . . . . . . . . . . . L22<br />
RCMP Summary of Gross Expenditures by Division . . . . . . . . . . L23<br />
RCMP Summary of Gross Revenue by Division . . . . . . . . . . . . L23<br />
RCMP Summary of Net Expenditures by Division . . . . . . . . . . . L23<br />
RCMP Summary by Expenditure & Revenue Types . . . . . . . . . . L23<br />
Infrastructure & Asset Management . . . . . . . . . . . . . . . . . . M1<br />
Service Level Changes . . . . . . . . . . . . . . . . . . . . . . . . . M15<br />
Summary of Gross Expenditures by Division . . . . . . . . . . . . . . M16<br />
Summary of Gross Revenue by Division . . . . . . . . . . . . . . . . M17<br />
Summary of Net Expenditures by Division . . . . . . . . . . . . . . . M18<br />
Summary by Expenditure & Revenue Types . . . . . . . . . . . . . . M19<br />
Legal Services . . . . . . . . . . . . . . . . . . . . . . . . . . . . . . N1<br />
Service Level Changes . . . . . . . . . . . . . . . . . . . . . . . . . N9<br />
Summary of Gross Expenditures by Division . . . . . . . . . . . . . . N10<br />
Summary of Gross Revenue by Division . . . . . . . . . . . . . . . . N10<br />
Summary of Net Expenditures by Division . . . . . . . . . . . . . . . N10<br />
Summary by Expenditure & Revenue Types . . . . . . . . . . . . . . N10<br />
Transportation & Public Works . . . . . . . . . . . . . . . . . . . . . O1<br />
Service Level Changes . . . . . . . . . . . . . . . . . . . . . . . . . O26<br />
Summary of Gross Expenditures by Division . . . . . . . . . . . . . . O27<br />
Summary of Gross Revenue by Division . . . . . . . . . . . . . . . . O31<br />
Summary of Net Expenditures by Division . . . . . . . . . . . . . . . O34<br />
Summary by Expenditure & Revenue Types . . . . . . . . . . . . . . O39
Reserve Budget<br />
Purpose of Reserves . . . . . . . . . . . . . . . . . . . . . . . . . . . P1<br />
Strategies for Reserves . . . . . . . . . . . . . . . . . . . . . . . . . . P1<br />
Equipment and <strong>Operating</strong> Reserves . . . . . . . . . . . . . . . . . . . P2<br />
Capital Reserves . . . . . . . . . . . . . . . . . . . . . . . . . . . . . P6<br />
Summary of Reserves Funds: Projections to March 31, 2010 . . . . . . P10<br />
Equipment and <strong>Operating</strong> Reserves: Projections to March 31, 2010 . . P11<br />
Capital Reserves: Projections to March 31, 2010 . . . . . . . . . . . . P12<br />
Projects<br />
Approved 2010-11 Project Budget by Asset Category . . . . . . . . . . Q1<br />
Approved 2011-12 Project Budget by Asset Category . . . . . . . . . . Q2<br />
Approved 2012-13 Project Budget by Asset Category . . . . . . . . . . Q3<br />
Approved 2013-14 Project Budget by Asset Category . . . . . . . . . . Q4<br />
Approved 2014-15 Project Budget by Asset Category . . . . . . . . . . Q5<br />
2010-11 Approved Projects . . . . . . . . . . . . . . . . . . . . . . . Q6<br />
2010-11 Approved <strong>Operating</strong> Costs for New Projects . . . . . . . . . . Q18<br />
Appendix "A" Financial Information Tables by Business Unit<br />
Glossary . . . . . . . . . . . . . . . . . . . . . . . . . . . . . . . . . . . . . . . R1
INTRODUCTION<br />
<strong>Halifax</strong> <strong>Regional</strong> <strong>Municipality</strong> (HRM) came into existence on April 1, 1996 as a result of the<br />
amalgamation of the former cities of <strong>Halifax</strong> and Dartmouth, the former Town of Bedford, the<br />
former <strong>Municipality</strong> of the County of <strong>Halifax</strong> and the Metropolitan Authority. Unlike other<br />
amalgamated regions in Canada, HRM has significant suburban and rural content, in addition to a<br />
large urban mix.<br />
The land area of the municipality is 5,577 square kilometers (2,224 square miles), which is an area<br />
slightly larger than the Province of Prince Edward Island. With approximately 200 communities<br />
within its boundaries, HRM is Nova Scotia's largest and most diverse municipality.<br />
Approximately 41 per cent of the total population of the province resides within HRM.<br />
European settlement first occurred in the region with the founding of <strong>Halifax</strong> by the British in<br />
1749. Nine years later in 1758, an election for Council members was held and <strong>Halifax</strong> became a<br />
forerunner in the later emergence of a democratically elected government in North America.<br />
Events of historical significance have greatly influenced the development of the Region. From<br />
1928 until 1971, over a million immigrants arrived in Canada through the Port of <strong>Halifax</strong>'s Pier<br />
21. Many of these immigrants settled in the area, enriching our social and cultural environment.<br />
Today, HRM is a region of diverse cultures, deeply rooted in history and tradition.<br />
From the historic downtown areas of <strong>Halifax</strong> and Dartmouth, which embrace the world's second<br />
largest natural harbour; to a coastal region encompassing more than 400 kilometers of shoreline;<br />
to the fertile farming land in the<br />
Musquodoboit Valley; to the urban<br />
communities of Sackville and Cole<br />
Harbour; HRM is a first class example of<br />
urban, suburban and rural living at its<br />
finest.<br />
The <strong>Halifax</strong> <strong>Regional</strong> <strong>Municipality</strong> is<br />
committed to supporting the<br />
development and growth of business<br />
within the Region. It has one of the<br />
country's best educated workforces.<br />
Through organizations such as the<br />
Greater <strong>Halifax</strong> Partnership, HRM has<br />
experienced steady economic growth<br />
HRM Statistics (2009)<br />
Inflation (Municipal): 1.51%<br />
Current Inflation (CPI): 1.9%<br />
Population (estimate): 3985,000<br />
Population growth (estimate): 0.8 %<br />
Dwelling Unit growth: 1.3 %<br />
Taxable Assessment:<br />
$32.0 Billion<br />
Avg. Residential Assessment:<br />
Single Family Home $182,400<br />
since amalgamation and is recognized as a great location to do business. It is emerging as a leader<br />
in the future of business prosperity.<br />
B1
The Local Economy<br />
While <strong>Halifax</strong> has a diverse economy, more than 87% of the workforce is employed in the service<br />
sector, and less than 13% in the goods sector (2006 Census). Total employment in 2008 averaged<br />
about 209,400 jobs. The public sector is the largest employer with approximately 23,000 people<br />
working for the three levels of government (federal, provincial and municipal). The total value of<br />
building permits in 2008 was about $692 million. Over 3.5 million passengers came through the<br />
<strong>Halifax</strong> Stanfield International Airport in 2008.<br />
The Municipal Government<br />
The municipality is governed by a Council/Chief Administrative Officer form of government,<br />
which includes one Councilor for each of the 23 Districts and a Mayor elected-at-large. It is the<br />
responsibility of the Chief Administrative Officer to provide advice to Council and carry out its<br />
policies and programs, as well as oversee the operation of the Administration and its 3,600 full<br />
and part-time employees.<br />
The services provided by HRM are varied and extensive, and include:<br />
$ 1,700 kilometers of streets maintained<br />
$ 800 kilometers of sidewalks<br />
$ 650 park properties<br />
$ 350 playgrounds, 200 ball fields and 180 sports fields<br />
$ 240 transit buses, 24 Access-A-Buses, 3 Community Transit Buses, and 3 ferries carrying<br />
18.7 million passengers annually<br />
$ 127,000 properties served with curbside collection of recyclables, organics and refuse<br />
$ 5 business and industrial parks housing 1,750 businesses<br />
$ 14 branch libraries lending 4.6 million items annually<br />
$ 4,940 building permits issued in 2007 with a construction value over $627 million<br />
$ approx. 1,000 emergency and non-emergency calls handled by the 911 Centre each day<br />
$ 60 fire stations of which 42 are in the rural area<br />
$ 47 front line fire trucks in the urban area, and 106 emergency fire vehicles in the rural area<br />
$ 138 schools servicing more than 52,600 students<br />
HRM operates on a 12 month fiscal cycle, from April 1 st to March 31 st of the following year.<br />
Under provincial law it is required to prepare an operating budget for ongoing items such as<br />
salaries, wages and other recurring costs, and a capital budget, for its fixed assets. HRM=s<br />
operating budget is fully balanced. Its capital budget is financed through a mixture of debt, cost<br />
sharing, reserve withdrawals and transfers from the operating budget. The latter is known as<br />
capital from operating or Apay as you go@.<br />
B2
Strategy<br />
As part of Council=s financial and other strategies there are a variety of policies and tools which<br />
interact with the <strong>Operating</strong> and Capital Budget process:<br />
S<br />
S<br />
S<br />
The Multi-Year Financial Strategy outlines Council=s APrinciples of Financial<br />
Management@ as well as its reserve, debt and capital spending policies;<br />
Business Plans are required to be developed by all HRM Business Units, including<br />
an overview of their operations, a financial and resource-utilization summary, an<br />
analysis of the challenges and opportunities facing the Unit, and a summary of the<br />
goals for the Business Unit, including specific objectives relating to these goals.<br />
Each Business Unit should also provide a summary of their accomplishments<br />
against their previous plan, and develop performance measures that they are using<br />
to gauge their efforts;<br />
Under HRM=s Tax Structure, approved by Council in 2003, there are three general<br />
property tax rates (urban, suburban and rural) and variety of area tax rates;<br />
HRM has prepared and approved five-year Capital Plans in the past and this year is in year two of<br />
its five-year Capital Plan. Included with this document is a five-year Capital Plan with the 2010-<br />
2011 Capital Budget as Year 1. Years 2 through 5 of the plan are planning documents and are<br />
subject to revision and alteration by Council.<br />
Council Focus Areas<br />
In an effort to provide a framework to debate program and service priorities, HRM underwent an<br />
exercise with Council in the fall of 2005 to identify the areas that they were most concerned with.<br />
These >Council Focus Areas= are intended to guide the immediate and long-term investments for<br />
the Region and to address many key issues facing our communities. They represent in essence<br />
Council=s commitment to residents to deal with these issues in a timely fashion.<br />
As part of setting the 2010-11 strategic direction Council agreed to have five Council Focus Area<br />
discussions which cover the following strategic topics. These Focus Areas are broken down into<br />
categories, and are analyzed in more detail in the Priorities section found in the Corporate Plan:<br />
Transportation<br />
Infrastructure<br />
Public Safety<br />
Community Planning<br />
Governance and Communication<br />
B3
ali-Facts...<br />
Population: 342,900 (more than one-third of Nova<br />
Scotia’s population)<br />
Area: 5,577 square kms<br />
Coastline: Over 400 km (250 miles) of coastline<br />
Trade: 60 percent wholesale and 40 percent retail<br />
Port: Second largest natural harbour, world’s<br />
deepest harbour ice-free year round<br />
Travel: Two hours closer to Europe by air than<br />
New York City, one day closer to Europe by<br />
water than any other North American port on the<br />
Atlantic Coast<br />
Other Facts:<br />
●Canada’s second largest scientific centre<br />
●Third largest oceanographic research centre<br />
●Financial centre of Eastern Canada<br />
●Home to Canada’s East Coast Navy<br />
Hubbards<br />
Queensland<br />
Queensland<br />
Beach<br />
St.Margarets Bay<br />
103<br />
3<br />
Head of<br />
St. Margarets<br />
Bay<br />
1<br />
Upper<br />
Sackville<br />
101<br />
Lower<br />
Sackville<br />
Grand<br />
Lake<br />
Lucasville<br />
Upper<br />
2<br />
Road<br />
102<br />
Hammonds Hammonds<br />
Plains Plains Bedford<br />
Stillwater<br />
213<br />
Lake<br />
Bedford<br />
Upper Tantallon<br />
Basin<br />
Rockingham<br />
Tantallon Timberlea<br />
Bayers<br />
Lake <strong>Halifax</strong><br />
Lakeside 3<br />
French Village<br />
Seabright<br />
Glen Margaret<br />
333<br />
Hacketts Cove Bayside<br />
Peggys<br />
Cove<br />
Indian Harbour Shad Bay<br />
West Dover<br />
Prospect<br />
<strong>Halifax</strong> <strong>Regional</strong> <strong>Municipality</strong> Key Map<br />
354<br />
BeaverBank<br />
103<br />
333<br />
Hatchet<br />
Lake<br />
Fall<br />
River<br />
Wellington<br />
2<br />
Enfield<br />
102<br />
Miller<br />
Lake<br />
Oldham<br />
118 Lake<br />
Major<br />
Waverley<br />
Goffs<br />
Cow<br />
Purcells Cove Eastern<br />
Bay<br />
Passage<br />
349 253<br />
Harrietsfield<br />
<strong>Halifax</strong> Harbour<br />
Herring Cove<br />
Gays River<br />
277<br />
Carolls<br />
Milford Corner<br />
212<br />
<strong>Halifax</strong><br />
International<br />
Airport<br />
Devon<br />
Porters<br />
Lake<br />
North<br />
Preston<br />
Porters<br />
Lake Lake<br />
7<br />
Echo<br />
Cherry East<br />
Brook Preston 107<br />
7 Preston<br />
Dartmouth<br />
Mineville<br />
Cole 207<br />
Harbour<br />
West<br />
322 Lawrencetown<br />
Whites Lake<br />
306<br />
Portuguese Cove<br />
Chebucto Head<br />
Sambro<br />
Ketch Harbour<br />
1<br />
Terence Bay<br />
Pennant Pt Crystal Crescent Beach<br />
Rainbow<br />
Haven<br />
Beach<br />
224<br />
Cooks<br />
Brook<br />
Dollar<br />
Lake<br />
Elderbank<br />
Musquodoboit River<br />
2<br />
Lawrencetown<br />
Beach<br />
Middle<br />
Musquodoboit<br />
Meaghers<br />
Grant<br />
Gibralter<br />
357<br />
Gaetz<br />
Brook<br />
9<br />
Higginsville<br />
Musquodoboit<br />
Harbour<br />
Head of<br />
Jeddore<br />
4<br />
East<br />
Petpeswick<br />
Ostrea<br />
Lake<br />
3 East<br />
Chezzetcook<br />
West<br />
Chezzetcook<br />
207<br />
Grand Desert Martinique<br />
Seaforth<br />
Beach<br />
Chezzetcook<br />
Three Fathom Inlet<br />
Harbour<br />
East Lawrencetown<br />
Upper<br />
Musqoudoboit<br />
Centre<br />
Musquodoboit<br />
Elmsvale<br />
224<br />
Newcomb<br />
Corners<br />
<strong>Halifax</strong> <strong>Regional</strong> <strong>Municipality</strong><br />
East Clam<br />
Jeddore Bay<br />
Clam<br />
Jeddore<br />
Harbour<br />
Cliff<br />
Beach<br />
Jeddore<br />
Harbour<br />
Moose River<br />
Gold Mines<br />
8<br />
Lake Charlotte<br />
Dean<br />
336<br />
Salmon<br />
River<br />
7 Bridge Lake<br />
Charlotte 6<br />
5<br />
Pleasant Valley<br />
Ship<br />
Harbour<br />
224<br />
Tangier Grand Lake<br />
Lower<br />
Ship<br />
Harbour<br />
Little<br />
Harbour<br />
East<br />
Ship<br />
Harbour<br />
Mooseland<br />
# Key map cultural / heritage sites<br />
1.S.S.Atlantic Park<br />
2.Old Hall Wilderness Heritage Centre<br />
3.Acadian House Museum<br />
4.Musquodoboit Railway Museum<br />
5.Fisherman’s Life Museum<br />
6.Memory Lane Heritage Village<br />
7.McPhee house<br />
8.Moose River Gold Mine Museum<br />
9.Bicentennial Theatre<br />
Marinette<br />
Harbour<br />
Popes<br />
Tangier Harbour<br />
Murphy<br />
Cove<br />
Ship Harbour<br />
Spry<br />
Spry<br />
Bay<br />
Sheet<br />
Harbour<br />
7<br />
7<br />
374<br />
Lochaber<br />
Mines<br />
Malay<br />
Falls<br />
Watts<br />
Section<br />
Sober Island<br />
Sheet Harbour<br />
Mushaboom Harbour<br />
Taylor<br />
Head<br />
7<br />
East Quoddy<br />
Port Dufferin<br />
Beaver Harbour<br />
Mushaboom<br />
Sheet Harbour Passage<br />
Hospital<br />
Ecum Secum<br />
MoserRiver<br />
Necum Teuch<br />
Legend:<br />
Hospital emergency<br />
Visitor information<br />
Beach<br />
Campground<br />
Cultural & heritage<br />
attractions<br />
Picnic area<br />
Necum<br />
Teuch<br />
Bay<br />
ATLANTIC OCEAN<br />
#
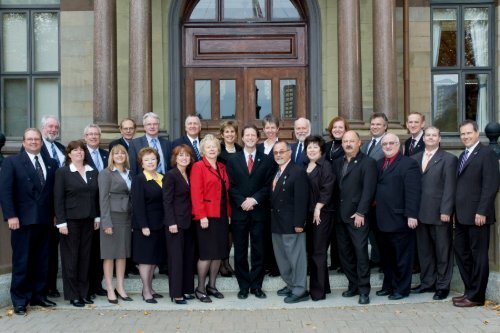
HALIFAX REGIONAL MUNICIPALITY<br />
HRM CITIZENS<br />
HALIFAX REGIONAL COUNCIL<br />
CHIEF ADMINISTRATIVE OFFICER<br />
Dan English<br />
Audit Committee<br />
OPERATIONS<br />
Deputy CAO, Wayne Anstey<br />
Mayor’s Office<br />
Manager, Deborah Chambers<br />
<strong>Halifax</strong> <strong>Regional</strong> Police Chief Frank Beazley<br />
RCMP Supt., Darrell Beaton<br />
External & Corporate Affairs<br />
Managing Director, Jennifer Church<br />
Councillors’ Office<br />
Manager, Cathie Barrington<br />
Fire & Emergency Service<br />
Chief Director Bill Mosher<br />
CORPORATE SERVICES & STRATEGY<br />
Deputy CAO, Mike Labrecque<br />
Municipal Auditor General<br />
Larry Munroe<br />
Community Development<br />
Director, Paul Dunphy<br />
Transportation & Public Works<br />
A/Director, Ken Reashor<br />
Acting Municipal Clerk<br />
Cathy Mellett<br />
Finance<br />
Director, Cathie O’Toole<br />
Infrastructure & Asset Management<br />
Director, Phil Townsend<br />
Human Resources<br />
Director, Cathi Mullally<br />
Legal & Risk Management<br />
Director, Mary Ellen Donovan<br />
Business Planning & Information Management<br />
Director, Brad Anguish<br />
Boards and Commissions: Liaison, Dan English, CAO<br />
<strong>Halifax</strong> Water Commission Carl Yates, General Manager<br />
Greater <strong>Halifax</strong> Partnership Paul Kent, Pres & CEO<br />
Police Commission Russell Walker, Chair<br />
Boards and Commissions: Liaison, Wayne Anstey, Deputy CAO<br />
<strong>Halifax</strong> <strong>Regional</strong> Library, Judith Hare, CEO January 2010
HRM 2010/2011<br />
Proposed Budget<br />
Overview of Budgets<br />
Budget Summary<br />
<strong>Operating</strong> Budget<br />
The development of the annual operating budget is a process that starts with Council Focus Areas<br />
and the development of the Fiscal Framework. The framework is presented to Council to provide<br />
an overview of revenues and expenditures, based on a status quo level of service. With this<br />
review, Council then provides staff with direction regarding the assumptions that underlie the<br />
development of the budget ensuring that the expenditure target incorporates Council priorities<br />
and strategic direction for the coming fiscal year. Following the receipt of the annual assessment<br />
roll from the Province of Nova Scotia, this direction is incorporated into the draft business unit<br />
budget envelopes. Each business unit develops their business plan within this envelope to deliver<br />
services required by the HRM Charter, as well as any new or enhanced services as directed by<br />
<strong>Regional</strong> Council through the Council Focus Areas.<br />
On March 23, 2010, <strong>Regional</strong> Council reviewed the Fiscal Framework for the 2010-2011 year<br />
and requested staff to complete the preparation of a budget based on an increase in transit area<br />
rates of $10,000,000 to include the additional cost of providing an expanded transit service, and<br />
to provide for a general tax revenue increase of $6,000,000. The remaining ‘gap’ of $14,000,000<br />
at that time would be closed through a combination of spending cuts and revenue enhancements.<br />
Some key highlights of the operating budget, as proposed, are:<br />
$ The gross amount of the operating budget is $729,815,877 million, a net increase of $26.2<br />
million or 3.7% over the 2009-10 budget.<br />
$ Increased demand due to growth in Transit, additional contributions to Solid Waste reserves,<br />
and additional compensation costs are some of the main reasons for increases to business unit<br />
costs.<br />
$ In the operating budget there are gross business unit revenues of $136 million, an increase of<br />
$11.5million over 2009-10<br />
$ The net budget by business unit is shown in the following table:<br />
1
HRM 2010/2011<br />
Proposed Budget<br />
Net <strong>Operating</strong> Budget Summary<br />
by Business Unit<br />
2009-2010 2010-2011 Change over<br />
Net Budget Net Budget Budget Var as %<br />
Office of the Auditor General 330,000 659,494 329,494 99.8<br />
CAO 9,910,990 10,391,427 480,437 4.8<br />
Fire & Emergency Services 54,247,800 55,630,216 1,382,416 2.5<br />
Financial Services 4,073,530 2,076,773 (1,996,757) (49.0)<br />
Human Resources 4,772,160 4,895,029 122,869 2.6<br />
Legal Services 2,194,390 2,228,105 33,715 1.5<br />
Transportation & Public Works 99,028,770 97,082,486 (1,946,284) (2.0)<br />
Infrastructure and Asset Mgmt 8,116,000 8,283,127 167,127 2.1<br />
Community Development 19,619,990 20,318,619 698,629 3.6<br />
<strong>Regional</strong> Police 66,381,740 69,154,989 2,773,249 4.2<br />
Outside Police BU (RCMP) 20,353,100 20,625,700 272,600 1.3<br />
Business Planning & Info Mgmt 19,013,818 19,287,095 273,277 1.4<br />
Library 15,148,000 15,541,750 393,750 2.6<br />
Total 323,190,288 326,174,810 2,984,522 0.9<br />
Project Budget<br />
Most funding for the project budget is provided through reserves, debt financing and direct transfers from the<br />
operating budget (Capital From <strong>Operating</strong> or Apay-as-you-go@). Since all of these funding sources require<br />
payments from the operating budget, the processes for operating, reserve and capital budgets are closely<br />
linked. The Debt Servicing Plan, HRM=s financial planning modelling system, and cash flow projections<br />
from reserves, are all used to determine the total funding capacity available for the capital budget.<br />
Contributions to reserves, principal and interest payments, and Capital from <strong>Operating</strong> are included in the<br />
operating budget. Non-Tangible Asset Projects are funded directly from the <strong>Operating</strong> Budget.<br />
$ The gross amount of the project budget is $157,250,866.<br />
$ The net amount of the project budget is $90,214,167, net of reserve withdrawals of $29 million, cost<br />
sharing of $33.5 million, $4.3 million of projects secured with local improvement charges, $225,000 in<br />
capital cost contribution charges.<br />
$ The net project budget will be funded by $28.9 million of capital from operating, $300,000 from the<br />
Capital Reserve Pool (Crespool), $25.6 million from Gas Tax, <strong>Operating</strong> Budget expenditures of $4.2<br />
million related to non-Tangible Capital Asset projects and borrowing of $31.2 million or 19.8% of the<br />
gross capital budget. This compares to borrowing of $51.2 million or 74% of the gross project budget in<br />
1997-98.<br />
2
HRM 2010/2011<br />
Proposed Budget<br />
Project Budget Summary<br />
Municipally Funded Portion of Project Budget<br />
2009-10<br />
Net Budget<br />
2010-2011<br />
Net Budget<br />
Increase<br />
(Decrease)<br />
%<br />
Change<br />
Buildings 21,086,448 25,820,667 4,734,219 22.5%<br />
Business Tools 1,528,300 743,000 (785,300) -51.4%<br />
Community & Property Development 1,687,000 1,892,000 205,000 12.2%<br />
District Activity Funds 1,495,000 1,495,000 0 0%<br />
Equipment & Fleet 7,225,000 7,707,200 482,200 6.7%<br />
Metro Transit 27,204,800 21,638,300 (5,566,500) -20.5%<br />
Parks & Playgrounds 6,350,000 5,939,000 (411,000) -6.4%<br />
Roads & Streets 21,500,000 16,500,000 (5,000,000) -23.2%<br />
Sidewalks, Curbs & Gutters 3,500,000 2,370,000 (1,113,000) -32.3%<br />
Solid Waste 0 0 0<br />
Traffic Improvements 8,435,000 6,109,000 (2,326,000) -27.6%<br />
HRM Total Projects 100,012,148 90,214,167 (9,797,981) -9.8%<br />
The net amount of the project budget is $90,214,167, net of reserve withdrawals of $29 million, cost sharing of $33.5 million, $4.3 million of<br />
capital projects secured with local improvement charges, $225,000 in capital cost contribution charges.<br />
As is the practice begun in 2008-09, Council will approve not only the project budget for the<br />
coming year (2010-2011), but also, in principle, the detailed project budget plans for the<br />
following years. This year, the project budget incorporates a 5 year capital plan with detailed<br />
project plans for 2011-12, 2012-13, 2013-14 and 2014-15.<br />
In 2010-2011 project spending will see a decrease of $9.8 million over the 2009-2010 budget.<br />
3
HRM 2010/2011<br />
Proposed Budget<br />
$110<br />
Long Term Project Plan<br />
Projected Net Budget<br />
The Long Term Project Plan<br />
Projected Spending<br />
$105<br />
$100<br />
Millions<br />
$95<br />
$90<br />
$85<br />
$80<br />
2010 2011 2012 2013 2014<br />
Year<br />
The main changes in HRM=s five (5) year Capital Plan relate to the expiry of infrastructure<br />
funding and the financing of projects approved in 2009/10 under various Federal and Provincial<br />
funding plans. HRM received Economic Stimulus Funding and Build Canada (Major<br />
Infrastructure Funding) in 2009/10 and will again in 2010/11.<br />
4
HRM 2010/2011<br />
Proposed Budget<br />
Reserve Budget<br />
Reserves are used in planning for HRM=s future needs. A reserve budget is created and this<br />
funding is incorporated into the financial plan as an integral part of the operating and capital<br />
budgets. Many reserves are funded through HRM=s general tax rate. Others are funded from<br />
independent revenue sources (e.g. Gas Tax Reserve, Burnside Industrial Park reserve etc).<br />
$ Reserve balances are projected to increase from $41.7 million to $62.7 million.<br />
$ Equipment and operating reserves will increase by $8.2M. Equipment and operating<br />
reserves are projected to increase mainly due to contributions to snow and ice reserve and<br />
the Operations Stabilization Reserve.<br />
$ Capital Reserves show an increase of $12.7 million. This increase is primarily due to a<br />
contribution of $10.3 million to the Waste Resources Reserve to plan for future<br />
expenditures. Within capital reserves there is a $25.6M contribution and corresponding<br />
expense related to Gas Tax projects.<br />
Key Assumptions<br />
Economics and Demographics<br />
$ The Consumer Price Index (CPI) is currently estimated at 1.9%. The CPI does not,<br />
however, include the goods and services typically purchased by municipalities. Inflation<br />
for HRM (MPI), based on its typical purchases, is estimated to rise by 3.0% (Conference<br />
Board, 2010).<br />
$ HRM has budgeted for fuel prices of 71.874 per litre for gasoline, 73.924 per litre for<br />
diesel, and 66.594 per litre for heating oil. HRM has assumed a US $85 per barrel oil<br />
price.<br />
$ The number of dwelling units will increase by 1.3% while population will increase by<br />
0.9%.<br />
Revenue<br />
$ The budget increases HRM=s overall residential general property tax rates by<br />
approximately 1.7% and Transit area rates by approximately 2.5%.<br />
$ Commercial tax rates have been adjusted for the phase-out of the Business Occupancy<br />
Tax.<br />
$ The deed transfer tax rate will not change. Deed transfer tax revenues are projected to<br />
increase by $.6 million.<br />
Expenditures<br />
$ The 2010-11 operating budget assumes there will be no surplus or deficit in 2010-11.<br />
$ Debt charges for HRM are $34.5 million principal and $10.9 million interest and other<br />
charges for a total cost of $45.4 million. This represents 6.2% of gross operating<br />
expenditures. Debt charges are found in both Fiscal Services and operating business units.<br />
5
HRM 2010/2011<br />
Proposed Budget<br />
$ For 2010-2011, HRM has estimated it will pay $6.4 million for its share of the cost of<br />
operating the provincial property assessment system.<br />
$ Collective agreements re-openers will be negotiated with MAPP and IAFF in 2010-11.<br />
Funds have been set aside to allow for these negotiations.<br />
Significant Budgetary Issues and Challenges<br />
Infrastructure<br />
HRM=s infrastructure and major capital assets support the delivery of municipal services, our<br />
future prosperity, economic development, competitiveness, public safety, and overall quality of<br />
life. The long term sustainability of the existing infrastructure and corporate assets directly<br />
impacts the ability to provide quality service to the community. Since amalgamation in 1996, the<br />
community has grown by 30,700 dwelling units and demand for sustainable, efficient, and<br />
effective service delivery has increased. In addition to these demands on existing resources, new<br />
infrastructure, assets, and service capacity improvements are proposed to support<br />
community-based initiatives such as the <strong>Regional</strong> Plan, Community Visions, the Cultural Plan,<br />
HRM by Design, the Active Transportation Plan, Sustainability Initiatives, HRM=s Economic<br />
Strategy, and the Community Facility Master Plan.<br />
Despite the fact that additional resources have been consistently applied to HRM=s project budget<br />
in recent years, the demand for service and cost of that service has grown at a pace that exceeds<br />
HRM=s funding capability. The gap is steadily growing between the demand for service and the<br />
ability to fund both maintenance of deteriorating infrastructure and acquisition and construction of<br />
new infrastructure. This "Infrastructure Gap" represents a significant challenge to HRM for the<br />
foreseeable future.<br />
The creation of the Infrastructure Council Focus Area provided staff with clear direction to<br />
address the "Infrastructure Gap". In response to this direction, the Infrastructure and Asset<br />
Management (IAM) business unit was created in October of 2007 solely dedicated to managing<br />
this important issue. By working closely with Council, internal HRM business units, and all<br />
HRM=s external business partners, IAM=s role is the development of prudent project business<br />
plans and project budgets and the creation of sound policy and long range plans focussed on the<br />
financial and environmental sustainability of the infrastructure and assets that support the delivery<br />
of services to the residents of HRM.<br />
On February 19, 2008, HRM Council gave direction that in 2008/09 a higher percentage of<br />
HRM=s project budget be focused on reinvestment in our infrastructure and assets, and that some<br />
alternatives be developed to enable increased investment in infrastructure. This is consistent with<br />
6
HRM 2010/2011<br />
Proposed Budget<br />
Economic Strategy objectives to see a higher level of municipal investment in public<br />
infrastructure.<br />
HRM is now required to be able to report on all of the assets owned by the municipality, their<br />
condition, their expected remaining useful life, and their estimated value as part of new financial<br />
accounting requirements for Nova Scotia municipalities. HRM=s Asset Management Project is<br />
well underway, and will provide information to refine and improve HRM=s infrastructure planning<br />
and project budgeting.<br />
Addressing these competing infrastructure related demands is a matter of prudent choices,<br />
effective timing and taking strategic advantage of leveraging opportunities when they arise. This<br />
budget exercises prudent financial management by taking the initial steps in a multi-year strategy<br />
to deal with the infrastructure gap while maintaining a balanced approach to meeting community<br />
needs.<br />
Provincial Assessment Cap<br />
In 2006, the Province of Nova Scotia enacted legislation which reduced the cap on property<br />
assessment increases from 10% (as set in 2005) to the Consumer Price Index (CPI). The cap<br />
applies only to certain homes and excludes apartment buildings, household improvements and<br />
commercial assessment. For the 2010-2011 tax year the cap has been set at the CPI rate of 0.0%.<br />
While market values of single family homes have increased by over 15% on average, these<br />
increases have been capped with no change for over 80% of homes.<br />
Revenue Capacity<br />
To maintain current levels of service, to rebuild and maintain a crumbling infrastructure and to<br />
plan for and fund future growth, HRM requires a predictable and appropriate revenue stream.<br />
With a heavy dependence on property tax revenue, and limited potential for additional revenue<br />
from this source, this creates some challenges.<br />
Pressures and constraints affect both HRM=s revenues and expenditures. On the expenditure side,<br />
a key factor is the rising costs of providing current levels of services. These costs typically<br />
increase much faster than the CPI inflation, as municipalities face significant construction costs,<br />
material costs and unionized labour contracts not reflected in CPI. In addition to the rising cost of<br />
maintaining existing services, there are many new initiatives that HRM would like to introduce,<br />
but cannot afford unless significant new revenues are found or substantive decisions are made to<br />
rationalize new and existing services.<br />
7
HRM 2010/2011<br />
Proposed Budget<br />
On the revenue side, HRM depends on taxation, grants and user charges to support its services<br />
and programs. Each of these sources have limited room for expansion. Ten years ago, HRM was<br />
facing a heavy debt burden with large debt servicing payments. With the introduction of the<br />
Multi-Year Financial Strategy in 1998, HRM has been steadily paying down this debt and limiting<br />
new debt issued. This has reduced the annual debt servicing payments required, freeing up more<br />
of HRM=s revenue for other purposes.<br />
Under Nova Scotia provincial legislation, municipalities may not budget for a deficit. Therefore,<br />
any increase in spending levels is fully dependent on either raising additional revenue or<br />
reallocating resources (funding new initiatives with the money saved by reducing or eliminating<br />
existing programs). This is something that is looked at each year within business units as they<br />
work with given levels of funding to provide the most important services in support of municipal<br />
objectives.<br />
Finding new sources of funding, using these funds in the best possible manner, and re-allocating<br />
resources to reflect shifting priorities will require decisions to be made. HRM faces difficult<br />
choices but will be assisted in these decisions by the planning and strategies put in place over the<br />
past few years, including but not limited to, the <strong>Regional</strong> Plan, the Economic Strategy and<br />
Council Focus Areas.<br />
Other Challenges Ahead<br />
HRM, as an organization, is facing several challenges and changes in the coming years, which<br />
include:<br />
$ a recovering economic situation;<br />
$ hosting the 2011 Canada Winter Games;<br />
$ the pending retirement of a significant number of senior HRM staff and difficulty in<br />
recruitment and retention of new employees; and<br />
$ changes in technological tools needed to deliver municipal services (i.e. implementation of<br />
the new Revenue Tool, continued optimization of HANSEN, SAP and other existing<br />
tools) and planning for future technological needs.<br />
8
HRM 2010/2011<br />
Proposed Budget<br />
Disaster Financial Assistance<br />
On September 28, 2003, Hurricane Juan, a category 2 storm, hit central Nova Scotia passing<br />
directly over <strong>Halifax</strong> <strong>Regional</strong> <strong>Municipality</strong> and a state of emergency was declared. In addition to<br />
the large clean up effort and emergency response required, the <strong>Municipality</strong> suffered significant<br />
damage to its critical infrastructure. In fiscal years 2003/04 through 2006/07, a total of $23.8<br />
million in clean up and recovery costs were incurred. While a portion of these costs have been<br />
recovered through insurance claims, charitable donations and the overall operating budget in each<br />
of those years, there is an estimated recovery of $17 million under the Disaster Financial<br />
Assistance Agreement (DFAA) which has been accrued in the financial statements. An advance of<br />
$11.5 million has been received against the estimated total recoverable under the DFAA program.<br />
The final amount recoverable under the DFAA program will not be known until all claims have<br />
been reviewed and adjudicated and any amount deemed not recoverable at that time will be a cost<br />
to the HRM operating budget. However, staff continue to work with the Province to ensure that<br />
appropriate, sufficient claim documentation is provided in support of the amounts claimed and<br />
considered eligible under the program.<br />
Principles of Budgeting and Accounting<br />
HRM=s overall accounting policies are driven by provisions of the Province of Nova Scotia<br />
Financial Reporting and Accounting Manual (FRAM) which require that financial statements be<br />
prepared in accordance with the Canadian Institute of Chartered Accountants standards as<br />
outlined in the Handbook of Public Sector Accounting Board=s (PSAB) recommendations. As<br />
part of those standards, HRM operates under a fund accounting system with an <strong>Operating</strong> fund, a<br />
Capital fund and a Reserve fund.<br />
A budget is prepared for each of the funds and includes all HRM business units as well as the<br />
<strong>Halifax</strong> <strong>Regional</strong> Library, a separate board of <strong>Regional</strong> Council. These fund budgets, however,<br />
do not include the <strong>Halifax</strong> <strong>Regional</strong> Water Commission, a separate corporation wholly-owned by<br />
HRM and regulated under the Nova Scotia Utility and Review Board, nor certain agencies,<br />
boards and commissions (often in the recreation area) which are owned or controlled by HRM.<br />
Separate budgets are prepared by these entities.<br />
The budget process concludes with <strong>Regional</strong> Council setting tax rates that will raise enough<br />
property tax revenue to cover the operating expenditures net of non tax revenues. As per the<br />
Municipal Government Act (MGA), HRM cannot budget for an operating deficit. Any prior year<br />
surplus or deficit, however, is carried forward into the current year=s operating budget.<br />
9
HRM 2010/2011<br />
Proposed Budget<br />
The project budget is funded through a variety of sources, including reserve funds, operating<br />
funds, grants and debt. As part of the project budget, estimates are developed and approved for<br />
individual projects. Under the MGA, only a one-year project budget may be approved by<br />
Council, however a 5-year project plan is presented to Council for approval, in principle only, of<br />
years 2 through 5. Nova Scotia municipalities are required to do any capital borrowing through<br />
the Nova Scotia Municipal Finance Corporation.<br />
FRAM was prescribed as a regulation under the MGA on June 21, 2006 and replaced the<br />
previous Municipal Accounting and Reporting Manual (MARM). Under MARM, budgeting<br />
followed the same basis as year-end financial statement reporting. The adoption of FRAM with<br />
PSAB as the basis for accounting resulted in changes in certain amounts required to be recorded<br />
in the financial statements. Specifically, it required that NS municipalities recognize certain costs<br />
in the financial statements earlier than under the MARM basis. As a result, in the year of<br />
transition, there were significant expenditures related to these items.<br />
To allow municipalities to incorporate these changes over a reasonable period of time, transitional<br />
provisions were included in FRAM for additional landfill closure and post closure accruals and<br />
employee benefit accruals. This allows a municipality to fund these costs at no less than 20%<br />
annually over a period that does not extend beyond March 31, 2012. Since, for financial<br />
statement purposes, the expenditures are to be fully accrued, this results in a difference between<br />
estimates for the tax rate calculation and the year-end audited financial statement results. The<br />
differences are recorded in the year end financial statements as amounts to be recovered from<br />
future revenues.<br />
In addition, under MARM, interest on long term debt was recorded on a cash basis in the financial<br />
statements and budget. PSAB requires that interest costs be accrued and although FRAM<br />
recommends that municipality’s budget for interest on an accrual basis, municipalities have the<br />
option of budgeting for interest on either a cash or accrual basis. HRM continues to budget for<br />
interest on long term debt on the cash basis and the difference between the amount of accrued<br />
interest recorded in the financial statements and the cash-based interest included in the budget is<br />
recorded as an amount to be recovered from future revenues in the financial statements.<br />
As at March 31, 2009, HRM’s financial statements, prepared in accordance with PSAB, included<br />
$9.0 million in amounts to be recovered from future revenues.<br />
For fiscal year ending March 31, 2010, HRM is implementing PSAB sections 1200 Financial<br />
Statement Presentation and 3150 Tangible Capital Assets. Section 1200 establishes general<br />
reporting principles and standards for the disclosure of information in government financial<br />
statements. Section 3150 requires governments to record and amortize their tangible capital asset<br />
in their financial statements. In prior years, tangible capital asset additions were expensed in the<br />
10
HRM 2010/2011<br />
Proposed Budget<br />
year of acquisition or construction.<br />
In conjunction with the implementation of Section 3150, HRM has introduced a Tangible Capital<br />
Asset Policy whereby only assets meeting the tangible asset criteria in the policy will be budgeted<br />
as capital. As a result, certain projects are being transferred from the capital to the operating<br />
budget. These include grants/donations to various organizations for capital improvements to their<br />
assets, infrastructure project costs associated with Provincial or <strong>Halifax</strong> Water capital assets,<br />
general study costs, business park lot inventory costs and expenditures which would be more of a<br />
maintenance cost as opposed to a tangible capital asset cost. These projects and the applicable<br />
funding will be transferred, therefore, no net impact on HRM’s overall budget.<br />
The budget is prepared on a non-consolidated basis since its purpose is primarily to support the<br />
setting of annual tax rates. The year-end financial statements are prepared on a consolidated<br />
basis. Throughout the fiscal year, HRM provides non-consolidated quarterly reports of actual<br />
year-to-date results to <strong>Regional</strong> Council, prepared on the same basis as the budget.<br />
The Annual Business Planning & Budgeting Process<br />
Every year, <strong>Halifax</strong> <strong>Regional</strong> Council reviews and establishes its strategic priorities through the<br />
ACouncil Focus Area@ process. Council debates their priority issues and, as a result, produce the<br />
refined Focus Areas. These provide guidance for staff in establishing business plans and budgets<br />
for the upcoming fiscal period. These Council Focus Areas represent the priorities of the<br />
community as determined by Council, and staff ensure that all municipal services align with these<br />
priorities to the extent of available resources.<br />
The Executive Management Team, led by the CAO, then establishes its corporate priorities, which<br />
speak to organizational issues such as succession planning, information technology and<br />
performance measurement. These AEMT Priorities@ ensure the organization can support the<br />
Council Focus Areas.<br />
As a result of this set of priorities (Community and Corporate), staff work between November<br />
and March every year to compile staffing counts, business cases and business plans in order to<br />
ensure that the work of the <strong>Municipality</strong> is in alignment with the strategic priorities.<br />
In order to prepare long-term financial plans, a computer model was developed to forecast the<br />
long term financial results and position of HRM. The model estimates future revenues and<br />
expenditures by setting a series of economic and demographic assumptions, detailing nearly eighty<br />
cost drivers and twenty service drivers, and incorporating these assumptions regarding tax rates,<br />
inflation, GDP, etc., into the forecast. By understanding where HRM is headed in terms of future<br />
revenues and expenditures, strategies can be developed for responding to the demands for<br />
11
HRM 2010/2011<br />
Proposed Budget<br />
programs and services. In terms of the annual Business Planning and Budgeting Process, the<br />
model provides Business Units with budget envelopes within which they develop business plans<br />
and budgets for the fiscal year. Each year, the assumptions of the draft envelopes are reviewed by<br />
EMT.<br />
Once Council determines the level of service and related expenditures, the current assessment roll<br />
is applied to produce the annual tax rates. Council balances the services and tax rates when<br />
making these decisions.<br />
12
HRM 2010/2011<br />
Proposed Budget<br />
A Multi-Year Financial Strategy (MYFS)<br />
The Multi-Year Financial Strategy (MYFS)<br />
HRM’s business planning and budgeting system has its origins in Council’s Multi-Year Financial<br />
Strategy, approved in 1999. An important component of that policy is the debt strategy. The<br />
goal of the original Capital Debt Policy was to reduce overall capital debt, provide predictability<br />
around debt available for the project budget each year and to provide improved structure around<br />
the project budget and related assumptions.<br />
In 2009 the Debt Servicing Plan was reviewed and revisions were approved by Council. Based on<br />
that review, the objective is to grow the Project Budget while reducing reliance on debt, and,<br />
increasing capital from operating. The goal is to eventually have all ongoing “Base” Projects (ie<br />
recapitalization) funded through Capital from <strong>Operating</strong> or Reserves and to use debt only for new<br />
“Capability” projects. To achieve this, targets for debt and capital from operating have been set<br />
based on a “per dwelling unit” amount. Tax supported debt per dwelling will be reduced by 3%<br />
each year. To support the project budget, Capital from <strong>Operating</strong> per dwelling will grow by 3%<br />
each year over the consumer price index (inflation). The combination of these two factors will<br />
allow the project budget to grow but the proportion of that budget being funded by debt to fall.<br />
HRM Debt outstanding at March 31 of each year is estimated as follows:<br />
$Million s<br />
$350<br />
$300<br />
$250<br />
347.5<br />
331.2<br />
320.5<br />
312.6 311.3<br />
297.2<br />
289.4<br />
281.3<br />
273.3<br />
21.8<br />
265.0 263.7<br />
3.7<br />
280.6 279.0<br />
$200<br />
1999<br />
2000<br />
2001<br />
2002<br />
2003<br />
2004<br />
2005<br />
2006<br />
2007<br />
2008<br />
2009<br />
2010<br />
1998-<br />
1999-<br />
2000-<br />
2001-<br />
2002-<br />
2003-<br />
2004-<br />
2005-<br />
2006-<br />
2007-<br />
2008-<br />
2009-<br />
2010-<br />
2011<br />
13
HRM 2010/2011<br />
Proposed Budget<br />
HRM Tax Structure<br />
Approved Tax Structure Model<br />
Service<br />
Rural (Base) General<br />
Tax Rate<br />
Suburban General Tax Rate<br />
Urban General Tax<br />
Rate<br />
Policing, Solid Waste,<br />
Recreation Programs,<br />
Planning, Libraries, Sports<br />
fields, Playgrounds,<br />
Administration<br />
Fire Suppression<br />
Street lighting<br />
Recreational and<br />
Community Facilities<br />
(Capital Costs - Cost<br />
Sharing)<br />
Included in the Base General Tax Rate<br />
Recreational and<br />
Community Facilities<br />
(<strong>Operating</strong> Costs) Area Rate Included in the Urban and Suburban General Tax Rates<br />
Crosswalk Guards<br />
Area Rate<br />
Sidewalks Area Rate Area Rate Included in the Urban<br />
General Tax Rate<br />
Transit Area Rate Area Rate Area Rate<br />
Fire Hydrants Area Rate Area Rate Area Rate<br />
The HRM tax structure includes a Base or General Tax Rate (for rural taxpayers); a Suburban<br />
General Tax Rate; and an Urban General Tax Rate. That structure was revised by Council in<br />
2003. Its guiding principles are to ensure that:<br />
$ each taxpayer pays for services received;<br />
$ each taxpayer shares in paying for services they have access to;<br />
$ each taxpayer pays for basic universal services to ensure a basic standard of service throughout<br />
HRM; and<br />
$ the commercial tax base exists for the benefit of all HRM<br />
14
HRM 2010/2011<br />
Proposed Budget<br />
The Base Rate includes most of the basic services available across HRM, including fire, policing,<br />
compost, recycling and solid waste collection, recreation programming, planning, libraries,<br />
streetlights, sports fields and playgrounds. Also included are internal and fiscal costs. Municipal<br />
Water service is paid for through the water bill, not the property tax system. Sewer service is<br />
paid by a charge on the water bill and is only levied on sewer users.<br />
Not included in the Base Tax Rate are several services, such as crosswalk guards and sidewalk<br />
maintenance. Both are included in the urban rate, and crosswalk guards are included in the<br />
suburban rate. They are "add-ons" to the suburban and rural areas of HRM, where provided.<br />
These property owners do not pay for such services unless they have access to them in their local<br />
area. In those instances, the costs are paid through a local area rate based on local costs. This<br />
system prevents Suburban and Rural taxpayers from paying for services they do not receive while<br />
allowing these areas the flexibility to acquire or manage services locally.<br />
HRM has changed the way it collects the existing transit taxes. Starting in 2009, existing transit<br />
taxes - that had been contained within the general rates - will be arranged as two separate tax<br />
rates. A <strong>Regional</strong> Transportation rate (5.3 cents per $100 of assessment) will cover services such<br />
as the MetroLink, MetroX and Ferries. The cost for these regional services will be shared by<br />
almost all taxpayers. Secondly, Alocal transit@ routes (such as routes 1 through 89 and community<br />
transit) will be paid by those who live within a one-km walk of a transit stop. This Local Transit<br />
Area Rate will be 10.8 cents per $100 of residential assessment.<br />
The inclusion of a service in the Base Tax Rate does not mean every community has equal access<br />
to individual services. There is no intention in the Council approved structure to provide the same<br />
level of service in every area of HRM. Rather, service levels depend on the service standards set<br />
by Council as part of the annual budget process.<br />
15
HRM 2010/2011<br />
Proposed Budget<br />
Assessments and Taxation<br />
Assessments<br />
$ HRM receives an updated property assessment roll in late December of each year.<br />
$ Property assessments in Nova Scotia reflect market values. In 2005 the Province instituted a<br />
cap on increases in the value of residential assessment. In 2007-09 the Cap was set at 10%.<br />
The cap has since been set at the Consumer Price Index. For 2010-11 the cap rate is 0.0%.<br />
The cap rate is set by the Province of Nova Scotia in accordance with the provincial<br />
Assessment Act.<br />
$ In the 2010 assessment base, residential assessments within HRM have increased from $24.9<br />
billion to $25.9 billion. The total increase was $960 million or 3.8%. The average single family<br />
home in HRM increased in value from $180,100 to $182,400 or 1.3%. Most of the remaining<br />
increase was due to the addition of new properties for a total increase in residential assessment<br />
of 3.8%.<br />
$ Overall, property tax assessments are<br />
up from $31.1 billion to $32 billion.<br />
This is an increase of $.9 billion or<br />
2.9%.<br />
Key Revenue Figures in the Budget<br />
Residential Assessment: up $.96 B or 3.8%<br />
Commercial Assessment: up 260 M or 4.7%<br />
Residential General Tax Rates: .691 to .714<br />
Commercial General Tax Rates: 1.93 to 3.296<br />
Property Tax Revenues:<br />
up $10.3M<br />
Deed Transfer Taxes:<br />
up $.6 M<br />
Property Tax Assessments<br />
2009<br />
2010<br />
Taxable Value Taxable Value Growth % Growth<br />
Residential 24,975,101,700 25,935,361,100 960,259,400 3.8%<br />
Resource 199,212,500 206,158,200 6,945,700 3.5%<br />
Sub-Total 25,174,314,200 26,141,519,300 967,205,100 3.8%<br />
Commercial 5,481,151,200 5,739,143,000 257,991,800 4.7%<br />
Business Occupancy 476,228,330 153,751,500 -322,476,830 -67.7%<br />
Sub-Total 5,957,379,530 5,892,894,500 -64,485,030 -1.1%<br />
TOTAL 31,131,693,730 32,034,413,800 902,720,070 2.9%<br />
16
HRM 2010/2011<br />
Proposed Budget<br />
Taxation<br />
Rates for 2010-11 are as follows:<br />
Residential & Resource Property Tax Rates<br />
per $100 of Assessed Value<br />
2009-10 2010-11 $ Change % Change<br />
General Rates<br />
Urban $0.702 $0.714 $0.012 1.7%<br />
Suburban $0.685 $0.697 $0.012 1.8%<br />
Rural $0.679 $0.691 $0.012 1.8%<br />
Mandatory Provincial Rates<br />
Education $0.312 $0.306 ($0.006) -1.9%<br />
Property Valuation Services $0.022 $0.023 $0.001 4.5%<br />
Correction Services $0.029 $0.022 ($0.007) -24.1%<br />
Metro <strong>Regional</strong> Housing Authority $0.009 $0.005 ($0.004) -44.4%<br />
Transit Area Rates<br />
<strong>Regional</strong> Transportation $0.045 $0.053 $0.008 17.8%<br />
Local Transit $0.088 $0.108 $0.020 22.7%<br />
Supplementary Education (1)<br />
Former Cities of <strong>Halifax</strong> & Dartmouth $0.050 $0.045 ($0.005) -10.0%<br />
Former Town of Bedford & <strong>Halifax</strong> County $0.045 $0.045 $0.000 0.0%<br />
Fire Protection (2) $0.014 $0.026 $0.012 85.7%<br />
(1) Commencing in 2010-11, there is only one Residential Supplementary Education rate for all of HRM.<br />
(2) In 2009-10 Council approved using $4,833,500 in Fire Protection Surplus to reduce the rates. The<br />
Residential Fire Protection rate in 2008-09 was $0.032 .<br />
Commercial & Business Occupancy Property Tax Rates<br />
per $100 of Assessed Value<br />
2009-10 2010-11 $ Change % Change<br />
General Rates<br />
Urban $3.157 $3.296 $0.139 4.4%<br />
Suburban $3.157 $3.296 $0.139 4.4%<br />
Rural $2.744 $2.930 $0.186 6.8%<br />
Mandatory Provincial Rates<br />
Education $0.313 $0.333 $0.020 6.4%<br />
Property Valuation Services $0.014 $0.013 ($0.001) -7.1%<br />
Correction Services $0.013 $0.010 ($0.003) -23.1%<br />
Metro <strong>Regional</strong> Housing Authority $0.009 $0.006 ($0.003) -33.3%<br />
Supplementary Education (1)<br />
Former Cities of <strong>Halifax</strong> & Dartmouth $0.144 $0.133 ($0.011) -7.6%<br />
Former Town of Bedford & <strong>Halifax</strong> County $0.127 $0.133 $0.006 4.7%<br />
Fire Protection (2) $0.040 $0.075 $0.035 87.5%<br />
(1) Commencing in 2010-11, there is only one Commercial Supplementary Education rate for all of HRM.<br />
(2) In 2009-10 Council approved using $4,833,500 in Fire Protection Surplus to reduce the rates. The<br />
Commercial Fire Protection rate in 2008-09 was $0.092.<br />
17
HRM 2010/2011<br />
Proposed Budget<br />
Based on the new general tax rates, tax revenue for 2010-2011 is projected to be as shown below:<br />
Municipal Property Tax Revenues<br />
2009-2010 2010-2011 Change Percent<br />
Residential Property Tax $173,858,600 183,371,000 9,512,400 +5.5%<br />
Resource Property Tax 1,257,000 1,313,000 56,000 +4.5%<br />
Sub-Total 175,115,600 184,684,000 9,568,400 +5.5%<br />
Commercial Property Tax 167,207,000 177,677,000 10.470,000 6.3%<br />
Business Occupancy Tax 14,881,000 5,516,000 -9,725,000 -65.4%<br />
Sub-Total 182,088,000 183,193,000 745,000 +.04%<br />
Total $357,203,600 367,517,000 10,313,400 +2.9%<br />
Based on the proposed tax rates, total property tax revenues are expected to increase from $357.2<br />
million to $367.5 million. This is an increase of $10.3 million or 2.9%.<br />
These amounts do not include allowance for appeals.<br />
18
HRM 2010/2011<br />
Proposed Budget<br />
Commercial Assessments<br />
Commercial and Business Occupancy taxation is important to HRM from two perspectives. First,<br />
it provides a significant source of property tax revenues. Historically, commercial properties pay<br />
tax at a much higher tax rate than residential properties. Under Councils direction, the<br />
commercial tax rate was weighted at 3.78 (urban/suburban) and 3.85 (rural) for the 2007 tax year.<br />
This weighting is adjusted each fiscal year. While this provides a significant portion of HRM<br />
property tax revenues, it also means that HRM is vulnerable to an economic downturn in the<br />
commercial sector. Secondly, commercial taxation and the services received by the commercial<br />
sector can have an important impact on the competitiveness of HRM=s economy.<br />
Currently, Nova Scotia has two types of commercial assessments. Commercial assessment is<br />
levied on real property. Business Occupancy is levied on the occupants of that real property.<br />
There are three main classes of business occupancy assessment. Service stations, restaurants,<br />
hotels, motels, campgrounds and automotive dealers are no longer assessed Business Occupancy<br />
tax. Financial services firms are assessed business occupancy at 75% of their commercial<br />
assessment. All others are assessed at 20% of commercial assessment, down from 30% in 2007.<br />
While taxable commercial assessment has risen by 4.7% in 2010, the Business Occupancy<br />
assessment has dropped due to the continued phase-out of the business occupancy tax (BOT).<br />
Overall, BOT and commercial assessments are down by $6.5 million in 2010.<br />
The lost revenues due to the phase out of the Business Occupancy assessment are being<br />
recaptured through an increase in the commercial tax rate.<br />
Accounting for Staff within HRM<br />
The FTE (full-time equivalent) count is used for budget purposes to quantify the number of<br />
positions approved by the Executive Management Team and Council. The FTE count records<br />
only permanent positions (both full-time and part-time).<br />
One FTE is equal to one annual work year as defined by the applicable collective agreements.<br />
This includes:<br />
Corporate FTE Overview<br />
The FTE (full-time equivalent) count is used for budget purposes to quantify the number of positions<br />
approved by the Executive Management Team and Council. The FTE count includes permanent<br />
full-time & part-time positions. This is distinct from headcount, which represents the number of<br />
employees in those positions. For example, two half-time positions would equal one FTE.<br />
19
HRM 2010/2011<br />
Proposed Budget<br />
FTE Count: One FTE is equal to one annual work year as defined by the applicable collective<br />
agreements. This includes:<br />
ATU<br />
CUPE<br />
IAFF<br />
MAPP<br />
Non Union<br />
NSUPE<br />
2080 hrs per year<br />
2088 hrs per year<br />
2184 hrs per year<br />
2088 hrs per year<br />
1827 hrs per year<br />
1827 hrs per year<br />
Corporate Summary of FTEs:<br />
Business Units<br />
As of<br />
March 31, 2009<br />
As of<br />
March 31, 2010<br />
Proposed<br />
2010/2011*<br />
Business Planning & Information<br />
163 168 166<br />
Management<br />
Chief Administrative Office 69 62 62<br />
Community Development 238.5 242 242<br />
Financial Services 188 203.5 203<br />
Fire & Emergency Services 494 494 494<br />
Human Resources 44 48 48<br />
Inventory & Asset Management 106 109 109<br />
Legal Services 25 25 25<br />
<strong>Halifax</strong> <strong>Regional</strong> Library 277.9 277.9 277.9<br />
<strong>Halifax</strong> <strong>Regional</strong> Police 747.5 750.5 750.5<br />
RCMP 178 178 178<br />
Transportation & Public Works -<br />
639.5 537 537<br />
Operations<br />
Transportation & Public Works -<br />
570.5 747 747<br />
Metro Transit<br />
Total: 3740.9 3841.9 3839.4<br />
*<br />
Does not include new positions required by completion of Projects – see Project Budget OCC reports<br />
20
HRM 2010/2011<br />
Proposed Budget<br />
It should be noted that temporary and seasonal positions are not included in the above FTE count.<br />
Financial staff have captured an estimated count of temporary staff hired to support HRM’S<br />
2009/2010 seasonal programs:<br />
Temporary Hires By Business Unit<br />
BPIM 61<br />
CD 878<br />
FINANCE 31<br />
HR 6<br />
IAM 25<br />
LEGAL 3<br />
POLICE 232<br />
TPW 48<br />
Total Temporary & Seasonal Staff Count: 1,284<br />
21
HRM 2010/2011<br />
Proposed Budget<br />
<strong>Halifax</strong> <strong>Regional</strong> Summary<br />
Summary of Gross Revenues and Expenditures by Business Unit<br />
2008-2009 2009-2010 2009-2010 2010-2011 Change over<br />
Non-Departmental Revenues<br />
Actual Budget Projections Budget Budget Var as %<br />
Private Roads (3,200) (57,140) (57,140) (57,140) 0 0.0<br />
Debt Servicing (4,077,635) (5,418,999) (5,418,999) (5,025,897) 393,102 (7.3)<br />
Transfers To Outside Agenc (130,780,088) (133,280,900) (133,280,900) (131,196,202) 2,084,698 (1.6)<br />
Other Fiscal Services (327,129) (435,000) (537,500) (526,860) (91,860) 21.1<br />
Transfers to/fr Other Fund (119,805) 0 0 0 0 0.0<br />
Non-Departmental Revenue (461,804,520) (439,563,800) (437,222,606) (456,674,254) (17,110,454) 3.9<br />
Sub-Total (597,112,377) (578,755,839) (576,517,145) (593,480,353) (14,724,514) 2.5<br />
Business Unit Revenues<br />
CAO (854,060) (287,400) (349,225) (116,400) 171,000 (59.5)<br />
Environmental Management S (631,309) 0 0 0 0 0.0<br />
Fire & Emergency Services (1,185,103) (544,500) (383,996) (653,500) (109,000) 20.0<br />
Financial Services (8,472,915) (8,353,100) (8,486,650) (10,961,800) (2,608,700) 31.2<br />
Human Resources Services (7,501) 0 (32,750) (80,000) (80,000)<br />
Legal Services (108,799) (144,000) (193,500) (228,000) (84,000) 58.3<br />
Transportation & Public Wo (55,340,906) (85,991,849) (84,443,478) (93,432,658) (7,440,809) 8.7<br />
Infrastructure and Asset M (86,988) (70,000) (218,636) (90,800) (20,800) 29.7<br />
Community Development (17,148,683) (15,943,917) (15,340,485) (15,865,065) 78,852 (0.5)<br />
<strong>Regional</strong> Police (8,361,665) (8,567,400) (9,908,989) (9,018,900) (451,500) 5.3<br />
Outside Police BU (RCMP) (771) 0 0 0 0<br />
Business Planning & Inform (828,002) (435,700) (710,625) (577,600) (141,900) 32.6<br />
Outside Agency Support (5,834,332) 0 0 0 0<br />
Library (4,770,558) (4,525,900) (4,525,900) (5,310,801) (784,901) 17.3<br />
Sub-Total (103,631,592) (124,863,766) (124,594,234) (136,335,524) (11,471,758) 9.2<br />
Total Revenues (700,743,969) (703,619,605) (701,111,379) (729,815,877) (26,196,272) 3.7<br />
Non-Departmental Expenditures<br />
Private Roads 3,000 57,140 57,140 57,140 0 0.0<br />
Debt Servicing 39,744,486 41,444,761 40,699,320 38,632,313 (2,812,448) (6.8)<br />
Transfers To Outside Agenc 141,250,267 138,837,900 138,837,900 140,926,202 2,088,302 1.5<br />
Other Fiscal Services 12,168,835 19,671,150 18,976,550 14,198,328 (5,472,822) (27.8)<br />
Transfers to/fr Other Fund 55,182,629 54,000,400 49,940,778 71,937,360 17,936,960 33.2<br />
Non-Departmental Other 1,718,765 1,554,200 1,554,200 1,554,200 0 0.0<br />
Sub-Total 250,067,982 255,565,551 250,065,888 267,305,543 11,739,992 4.6<br />
Business Unit Expenditures<br />
Office of the Auditor Gene 0 330,000 232,450 659,494 329,494 99.8<br />
CAO 10,070,060 10,198,390 10,329,008 10,507,827 309,437 3.0<br />
Environmental Management S 628,899 0 0 0 0 0.0<br />
Fire & Emergency Services 52,633,420 54,792,300 54,569,448 56,283,716 1,491,416 2.7<br />
Financial Services 12,459,571 12,426,630 12,273,012 13,038,573 611,943 4.9<br />
Human Resources Services 4,268,325 4,772,160 4,664,873 4,975,029 202,869 4.3<br />
Legal Services 2,239,003 2,338,390 2,306,059 2,456,105 117,715 5.0<br />
Transportation & Public Wo 187,783,600 185,020,619 188,406,554 190,515,144 5,494,525 3.0<br />
Infrastructure and Asset M 7,453,651 8,186,000 7,791,774 8,373,927 187,927 2.3<br />
Community Development 34,683,892 35,563,907 34,957,095 36,183,684 619,777 1.7<br />
<strong>Regional</strong> Police 71,973,994 74,949,140 76,280,055 78,173,889 3,224,749 4.3<br />
Outside Police BU (RCMP) 19,282,520 20,353,100 20,300,900 20,625,700 272,600 1.3<br />
Business Planning & Inform 19,791,312 19,449,518 18,494,401 19,864,695 415,177 2.1<br />
Outside Agency Support 5,779,503 0 0 0 0 0.0<br />
Library 19,271,091 19,673,900 19,673,900 20,852,551 1,178,651 6.0<br />
Sub-Total 448,318,841 448,054,054 450,279,528 462,510,334 14,456,280 3.2<br />
Total Expenditures 698,386,823 703,619,605 700,345,416 729,815,877 26,196,272 3.7<br />
C22
HRM 2010/2011<br />
Proposed Budget<br />
<strong>Halifax</strong> <strong>Regional</strong> Summary<br />
Summary of Net Expenditures by Business Unit<br />
2008-2009 2009-2010 2009-2010 2010-2011 Change over<br />
Actual Budget Projections Budget Budget Var as %<br />
Office of the Auditor General 0 330,000 232,450 659,494 329,494 99.8<br />
CAO 9,216,001 9,910,990 9,979,783 10,391,427 480,437 4.8<br />
Environmental Mgmt Services (2,410) 0 0 0 0 0.0<br />
Fire & Emergency Services 51,448,316 54,247,800 54,185,452 55,630,216 1,382,416 2.5<br />
Financial Services 3,986,656 4,073,530 3,786,362 2,076,773 (1,996,757) (49.0)<br />
Human Resources 4,260,824 4,772,160 4,632,123 4,895,029 122,869 2.6<br />
Legal Services 2,130,205 2,194,390 2,112,559 2,228,105 33,715 1.5<br />
Transportation & Public Works 132,442,694 99,028,770 103,963,076 97,082,486 (1,946,284) (2.0)<br />
Infrastructure and Asset Mgmt 7,366,663 8,116,000 7,573,138 8,283,127 167,127 2.1<br />
Community Development 17,535,210 19,619,990 19,616,610 20,318,619 698,629 3.6<br />
<strong>Regional</strong> Police 63,612,329 66,381,740 66,371,066 69,154,989 2,773,249 4.2<br />
Outside Police BU (RCMP) 19,281,749 20,353,100 20,300,900 20,625,700 272,600 1.3<br />
Business Planning & Info Mgmt 18,963,310 19,013,818 17,783,776 19,287,095 273,277 1.4<br />
Outside Agency Support (54,829) 0 0 0 0 0<br />
Library 14,500,533 15,148,000 15,148,000 15,541,750 393,750 2.6<br />
Business Units Total 344,687,250 323,190,288 325,685,294 326,174,810 2,984,522 0.9<br />
Non-Departmental (347,044,395) (323,190,288) (326,451,257) (326,174,810) (2,984,522) 0.9<br />
Total Net (2,357,145) (0) (765,963) (0) (0) 0.0<br />
C23
HRM 2010/2011<br />
Proposed Budget<br />
<strong>Halifax</strong> <strong>Regional</strong> Summary<br />
Summary by Expense and Revenue Types<br />
2008-2009 2009-2010 2009-2010 2010-2011 Change over<br />
Expenditures<br />
Actual Budget Projections Budget Budget Var as %<br />
Compensation & Benefits 263,080,649 274,181,859 273,825,064 284,633,008 10,451,149 3.8<br />
Office 10,157,359 8,818,668 9,397,577 8,945,521 126,853 1.4<br />
Professional Fees 20,225,786 20,760,600 21,615,660 807,387 (19,953,213) (96.1)<br />
Legal & Consulting Fees 1,061,577 1,369,959 1,814,295 1,158,941 (211,018) (15.4)<br />
External Services 57,052,862 54,572,848 58,118,733 77,021,580 22,448,732 41.1<br />
Uniforms & Clothing 1,367,029 1,595,300 1,550,536 1,605,510 10,210 0.6<br />
Salt 3,121,767 1,600,600 2,868,000 1,602,200 1,600 0.1<br />
Supplies & Materials 4,458,744 3,984,330 4,151,174 3,798,527 (185,803) (4.7)<br />
Utilities 11,074,063 12,175,300 12,114,367 11,357,475 (817,825) (6.7)<br />
Building Costs 5,956,240 6,056,280 7,280,857 6,043,846 (12,434) (0.2)<br />
Equipment & Communications 16,962,964 11,566,591 12,170,736 10,328,054 (1,238,537) (10.7)<br />
Vehicle Expense 22,078,768 21,284,000 19,695,904 19,026,975 (2,257,025) (10.6)<br />
Travel 1,946,237 1,606,379 1,628,221 1,290,746 (315,633) (19.6)<br />
Training & Education 1,261,769 1,932,074 1,567,948 1,892,741 (39,333) (2.0)<br />
Facilities Rental 4,773,466 5,210,500 5,055,691 5,381,339 170,839 3.3<br />
Advertising & Promotion 1,268,290 1,162,450 1,098,982 957,535 (204,915) (17.6)<br />
Other Goods & Services 10,455,735 12,264,837 11,637,304 20,595,887 8,331,050 67.9<br />
Interdepartmental (442,832) (390,000) (698,732) (310,510) 79,490 (20.4)<br />
Debt-Interest 12,827,182 12,656,726 11,938,688 11,120,161 (1,536,565) (12.1)<br />
Debt Principal 37,130,536 36,764,062 36,746,759 37,409,274 645,212 1.8<br />
Transfer Outside Agencies 134,549,930 141,621,281 141,676,166 136,718,017 (4,903,264) (3.5)<br />
Insurance Costs 3,290,742 4,374,600 4,369,631 4,728,200 353,600 8.1<br />
Grants & Tax Concessions 6,224,064 9,088,100 9,088,600 7,976,100 (1,112,000) (12.2)<br />
Transfer to/from Reserves 23,070,410 15,586,415 10,917,410 29,206,285 13,619,870 87.4<br />
Fire Protection 9,504,591 9,802,500 9,802,500 9,142,000 (660,500) (6.7)<br />
Capital from <strong>Operating</strong> 30,983,000 33,849,700 33,849,700 33,098,624 (751,076) (2.2)<br />
Debenture Discount 381,590 372,073 372,073 280,288 (91,785) (24.7)<br />
Provision for Allowance 3,523,991 3,137,751 3,537,751 3,537,790 400,039 12.7<br />
Other Fiscal (684,842) 1,040,823 (1,594,177) 522,676 (518,147) (49.8)<br />
Prior year Surplus/Deficit 1,725,153 (4,427,001) (5,252,001) (60,300) 4,366,701 (98.6)<br />
Total 698,386,823 703,619,605 700,345,416 729,815,877 26,196,272 3.7<br />
<strong>Halifax</strong> <strong>Regional</strong> Summary<br />
Summary by Expense and Revenue Types<br />
2008-2009 2009-2010 2009-2010 2010-2011 Change over<br />
Actual Budget Projections Budget Budget Var as %<br />
Revenues<br />
Tax Revenues (374,165,744) (364,188,884) (357,130,386) (378,584,891) (14,396,007) 4.0<br />
Deed Transfer Tax (35,166,329) (29,430,000) (30,500,000) (30,000,000) (570,000) 1.9<br />
Area Rate Revenue (138,368,937) (167,428,414) (167,428,414) (171,453,280) (4,024,866) 2.4<br />
Tax Agreements (4,681,163) (3,830,000) (8,932,246) (8,734,940) (4,904,940) 128.1<br />
Payments in Lieu of taxes (27,828,442) (29,514,900) (28,545,958) (28,842,098) 672,802 (2.3)<br />
Transfers from other Gov'ts (11,723,073) (10,812,700) (10,794,700) (11,589,652) (776,952) 7.2<br />
Interest Revenue (11,154,165) (5,715,000) (4,754,000) (3,332,000) 2,383,000 (41.7)<br />
Parking Meters (2,638,668) (2,625,000) (2,625,000) (2,630,000) (5,000) 0.2<br />
Fines and Fees (5,704,245) (5,626,800) (5,798,208) (5,594,801) 31,999 (0.6)<br />
Licenses & Permits (4,765,386) (4,891,900) (3,843,605) (4,480,300) 411,600 (8.4)<br />
Rental & Leasing (6,224,537) (6,104,400) (6,442,331) (6,529,670) (425,270) 7.0<br />
Transit Revenue (28,244,890) (31,841,100) (30,025,700) (32,855,400) (1,014,300) 3.2<br />
Tax Certificates (366,991) (372,300) (320,000) (350,000) 22,300 (6.0)<br />
Recreational Revenue (3,963,415) (3,864,100) (3,948,871) (4,041,070) (176,970) 4.6<br />
Tipping Fees - Waste Resources (11,157,151) (11,301,500) (11,068,815) (11,823,815) (522,315) 4.6<br />
Sales Revenue (7,837,866) (7,269,700) (7,635,838) (10,365,194) (3,095,494) 42.6<br />
HRWC Dividend (3,622,229) (3,700,000) (3,700,000) (3,700,000)<br />
Environmental Protection Levies 80 (419)<br />
Other Revenue (23,130,825) (15,018,807) (17,532,788) (14,824,666) 194,141 (1.3)<br />
Interdepartmental Revenue 8 (84,100) (84,100) (84,100)<br />
Total (700,743,969) (703,619,605) (701,111,379) (729,815,877) (26,196,272) 3.7<br />
C24
<strong>Halifax</strong> <strong>Regional</strong> <strong>Municipality</strong><br />
2010/11 Business Plans and Budget (Proposed) Office of the Chief Administrative Officer<br />
Office of the Chief<br />
Administrative Officer<br />
Business Plan - 2010/11
<strong>Halifax</strong> <strong>Regional</strong> <strong>Municipality</strong><br />
2010/11 Business Plans and Budget (Proposed) Office of the Chief Administrative Officer<br />
Mission: To effectively achieve community outcomes and implement Council priorities by<br />
providing information, support, and guidance to <strong>Regional</strong> Council and leading<br />
the administration of the organization.<br />
Business Unit Overview:<br />
The Office of the Chief Administrative Officer is accountable for achieving the goals established<br />
by <strong>Regional</strong> Council. The Business Unit is comprised of an Executive Management Team<br />
(EMT) which includes the Chief Administrative Officer and two Deputy Chief Administrative<br />
Officers, as well as divisions within the Business Unit that report directly to a member of EMT.<br />
The CAO Office supports the Mayor and Council, provides vision and leadership to municipal<br />
staff, and ensures the implementation of HRM’s corporate direction and strategies (i.e. Council<br />
Focus Areas and EMT Priorities).<br />
Chief Administrative<br />
Officer<br />
Dan English<br />
DCAO – Corporate<br />
Services and<br />
Strategy<br />
Mike Labrecque<br />
DCAO – Operations<br />
Wayne Anstey<br />
The Chief Administrative Officer (CAO) is the head of the<br />
administrative branch of the government of HRM and is accountable<br />
to <strong>Regional</strong> Council. The CAO provides leadership in the<br />
development and implementation of policies and programs approved<br />
by Council and ensures the corporation has the resources and<br />
processes needed to address corporate strategies, such as Council<br />
Focus Areas and EMT Priorities. In addition, the CAO directly<br />
oversees <strong>Halifax</strong> <strong>Regional</strong> Fire and Emergency Services and <strong>Halifax</strong><br />
Police Services.<br />
The Deputy Chief Administrative Officer of Corporate Services and<br />
Strategy (DCAO-CSS) provides direction and oversight to HRM’s<br />
corporate business units - Finance, Human Resources, Legal<br />
Services, and Business Planning and Information Management. The<br />
DCAO-CSS is a member of the Executive Management Team<br />
(EMT); approves council reports, business plans and budgets for<br />
corporate business units; and co-Chairs the Senior Management<br />
Team (SMT), which consists of all business unit Directors. In<br />
addition, the DCAO-CSS oversees the Municipal Clerk’s Office.<br />
The Deputy Chief Administrative Officer of Operations (DCAO-<br />
Ops) provides direction and oversight to HRM’s operational business<br />
units – Transportation and Public Works, Infrastructure and Asset<br />
Management, and Community Development. The DCAO-Ops is a<br />
member of the Executive Management Team (EMT); approves<br />
council reports, business plans and budgets for operational business<br />
units; and co-Chairs the Senior Management Team (SMT), which<br />
consists of all business unit Directors.<br />
D2
<strong>Halifax</strong> <strong>Regional</strong> <strong>Municipality</strong><br />
2010/11 Business Plans and Budget (Proposed) Office of the Chief Administrative Officer<br />
Office of the<br />
Municipal Clerk<br />
Cathy Mellett (Acting)<br />
Council Support<br />
Office<br />
Cathie Barrington<br />
Office of the Mayor<br />
Deborah Chambers<br />
External and<br />
Corporate Affairs<br />
Jennifer Church<br />
Summary of<br />
Business Unit<br />
Structure Changes:<br />
The Municipal Clerk’s Office supports the legislative process of<br />
municipal government, including municipal elections, by providing<br />
procedural, electoral and record keeping services to <strong>Regional</strong><br />
Council, Community Councils, boards, committees and<br />
commissions, the public and staff. The Office facilitates public<br />
access to the legislative process, in order to ensure the balance of<br />
compliance with legislative requirements and openness of the<br />
decision-making process.<br />
The Council Support Office coordinates constituent relations,<br />
communications, and administrative support to members of <strong>Regional</strong><br />
Council. The office liaises with constituents and HRM staff to<br />
investigate issues or concerns, and shares information to support<br />
elected officials.<br />
The Office of the Mayor coordinates constituent relations,<br />
communications, and administrative support to the Mayor. The office<br />
liaises with constituents and HRM staff to investigate issues or<br />
concerns, and shares information to support the Mayor.<br />
External and Corporate Affairs provides strategic advice and support<br />
to the corporation on a wide range of initiatives by building<br />
relationships, strengthening the corporate image, managing<br />
partnerships, and creating opportunities for effective integration. The<br />
unit encompasses public affairs; marketing design and print services;<br />
corporate affairs; corporate policy; intergovernmental affairs;<br />
economic policy; and CAO office coordination.<br />
• The Business Systems and Control Group has been transferred<br />
from the CAO Business Unit to the Office of the Auditor<br />
General.<br />
Core Operations and Services provided:<br />
• Leadership and oversight of HRM’s administration, which includes nine core business units,<br />
with a total staff complement of approximately 3,700 full and part-time employees;<br />
• Legislative and administrative support to the Mayor and 23 Councilors, each Councillor<br />
representing an average of close to 17,000 residents;<br />
• Legislative and record keeping support to <strong>Regional</strong> Council, six Community Councils, and<br />
more than thirty Committees of Council, as well as the public and HRM staff;<br />
• Oversight and administration of more than 120 municipal by-laws;<br />
• A full service Marketing, Graphic Design, and Print section which completed more than<br />
1,800 marketing projects and 7,600,000 impressions for printing and copying;<br />
• Support to the HRM Economic Strategy, which outlines five comprehensive goals for future<br />
economic development in Greater <strong>Halifax</strong>;<br />
• Management of HRM’s Public Affairs and Corporate Communications functions;<br />
• Management of relationships with government and community partners, including seven<br />
formal Memorandums of Understanding (MOUs) which better define and coordinate HRM’s<br />
relationship with external stakeholders.<br />
D3
<strong>Halifax</strong> <strong>Regional</strong> <strong>Municipality</strong><br />
2010/11 Business Plans and Budget (Proposed) Office of the Chief Administrative Officer<br />
Funded Full Time Equivalents (FTEs):<br />
2008/09<br />
(Approved)<br />
2009/10<br />
(Approved)<br />
2010/11<br />
(Proposed)<br />
Funded FTEs (includes full- and<br />
part-time permanent positions) 69 62 62<br />
Analysis of <strong>Operating</strong> Budget Changes:<br />
<strong>Operating</strong> Budget Change Details<br />
($000's)<br />
2009/10 Budget $9,910.9<br />
1 Salaries and benefits – includes cost changes from merit increases,<br />
491.3<br />
classification reviews, employer benefit costs and revised pay scale for<br />
Councillors<br />
2 Impact of HRM corporate-wide administrative reductions (191.5)<br />
3 2010/11 portion of budget to host the June 2011 Federation of Canadian<br />
225.0<br />
Municipalities (FCM) Conference (to be funded over two year period)<br />
4 Transfer to Special Events Reserve to cover FCM conference costs noted (225.0)<br />
above<br />
5 Reduction in internal recoveries resulting from the centralization of postage 171.2<br />
and printing/reproduction costs (costs offset in other Business Unit budgets)<br />
6 Miscellaneous increases in various items 9.5<br />
2010/11 Budget $10,391.4<br />
Key Challenges and Opportunities<br />
The following challenges and opportunities will have an impact on the Business Unit during the<br />
2010-2015 time frame.<br />
Challenges with Community-Wide Impact:<br />
• Supporting Council and Corporate Strategy: <strong>Regional</strong> Council has adopted areas on<br />
which the municipality needs to place the most focus during their current mandate. The<br />
Council Focus Areas are Transportation; Infrastructure; Public Safety; Community Planning;<br />
and Governance and Communications. In addition to Council’s focus areas, the Executive<br />
Management Team (EMT) sets priorities for the municipality’s administration. The EMT<br />
D4
<strong>Halifax</strong> <strong>Regional</strong> <strong>Municipality</strong><br />
2010/11 Business Plans and Budget (Proposed) Office of the Chief Administrative Officer<br />
Priorities are Fiscal Responsibility, Employer of Choice, and Excellence in Service Delivery.<br />
These Council and corporate priorities are effective tools to identify where the organization<br />
can have the greatest impact and to help guide the future direction of HRM, so it is vital that<br />
the municipality’s resources are properly aligned to support them. The recently developed<br />
Corporate Plan and associated corporate performance framework will assist in this task.<br />
However, it is challenging, especially in a difficult fiscal time, to ensure that priority areas are<br />
adequately resourced. Often, this involves decreasing support in other areas to continue the<br />
required level of focus on priorities. However, this approach is necessary to have maximum<br />
impact on the areas of service most important to residents and communities.<br />
• Implementing Strategic Policy and Initiatives: Increasingly, the development of strategic<br />
policy has been a priority for HRM during the last several years. As a result, the requirement<br />
for several key strategies, plans and initiatives have emerged. In relation to the CAO<br />
Business Unit, these include the Economic Strategy, Immigration Action Plan, and Strategic<br />
Communications Plan. These and other corporate initiatives address challenging areas of<br />
public policy about which residents and elected officials are concerned and require action.<br />
Many of these are difficult to implement because they require the involvement of more than<br />
one Business Unit and/or level of government, while others can only be implemented if<br />
supported by individuals, local communities, and other external partners. The number and<br />
variety of stakeholders creates complexity and which can only be addressed through the<br />
effective management of a diverse array of perspectives and needs.<br />
Challenges with Service Delivery / Business Unit Impact<br />
• Demand for Internal Services: Resources for internal services, especially those to support<br />
the delivery of the Governance and Communications Council Focus Area, have been strained<br />
by an increasing demand for products and services across the organization. An increasing<br />
demand on existing resources will continue as Council Focus Areas are further implemented,<br />
creating challenges in effectively supporting the focus areas and conveying the organization’s<br />
priorities to the public. In the CAO Business Unit, this is most evident in marketing and<br />
communications, where a more formal approach to operational planning and priority-setting<br />
is required to manage this demand.<br />
• Employee and Council Engagement: Effectively engaging and recognizing employees is a<br />
major challenge in an organization as large and diverse as HRM. Providing leadership and<br />
support to staff and recognizing their valuable contributions are essential in the<br />
municipality’s quest to enhance its reputation as an Employer of Choice. Adequate resources<br />
must be aligned to not only support employee engagement, but to ensure that elected officials<br />
and senior managers are well engaged to help them understand and manage issues,<br />
opportunities, needs, and tools.<br />
• Managing External Relationships: HRM has multiple formal and informal relationships<br />
with external stakeholders including other levels of government, interest groups and<br />
community organizations, and the private sector. Often, the interests or mandates of more<br />
than one of these partners conflict or overlap and understanding how the respective<br />
D5
<strong>Halifax</strong> <strong>Regional</strong> <strong>Municipality</strong><br />
2010/11 Business Plans and Budget (Proposed) Office of the Chief Administrative Officer<br />
responsibilities of partners intersect is a key component of establishing sound relationships.<br />
Effectively managing these multiple relationships is a challenge, but necessary to ensure the<br />
proper alignment of HRM’s mandate and activities with those of other stakeholders.<br />
Business Unit Goals<br />
The goals for the Office of the Chief Administrative Officer (CAO) are:<br />
Goal 1:<br />
Goal 2:<br />
Goal 3:<br />
Goal 4:<br />
Goal 5:<br />
Goal 6:<br />
Goal 7:<br />
Goal 8:<br />
Goal 9:<br />
Goal 1:<br />
Implement HRM’s Strategic Communications Plan<br />
Manage the Process of Council and Committee Reform<br />
Improve Employee Engagement and Internal Communications<br />
Provide Professional Support to Elected Officials and the Legislative Process<br />
Promote Effective Senior Management Decision-Making<br />
Enable Active and Coordinated Liaison with Partners<br />
Implement the HRM Economic Strategy<br />
Meet Internal Service Expectations<br />
Meet Internal Partnership / Collaboration Requirements<br />
Implement HRM’s Strategic Communications Plan<br />
Corporate Strategy Linkage:<br />
Council Focus Area - Governance and Communications<br />
Council Focus Area - Support to the other remaining Council Focus Areas<br />
Description:<br />
The goal of the Communications portion of the Governance and Communication Council Focus<br />
Area is to ensure a coordinated and effective approach to all of the municipality’s internal and<br />
external communications and marketing activity. HRM’s Strategic Communications Plan<br />
defines actionable goals and an implementation plan to guide the design, preparation and<br />
execution of strategic communications. The plan facilitates communications leadership across<br />
the organization, with emphasis on proactive approaches to communications balanced with the<br />
need to react to urgent matters; and operational effectiveness in the areas of marketing,<br />
communications and public affairs.<br />
Goal 1:<br />
Implement HRM’s Strategic Communications Plan<br />
Objectives for 2010/2011:<br />
CAO 1.1<br />
CAO 1.2<br />
Implement communications and marketing strategies for Council Focus Areas<br />
Improve the annual planning process with Business Units to ensure priority<br />
marketing and communications needs and opportunities are identified and<br />
addressed<br />
D6
<strong>Halifax</strong> <strong>Regional</strong> <strong>Municipality</strong><br />
2010/11 Business Plans and Budget (Proposed) Office of the Chief Administrative Officer<br />
CAO 1.3<br />
CAO 1.4<br />
CAO 1.5<br />
CAO 1.6<br />
CAO 1.7<br />
Increase focus on media relations and issues management<br />
Finalize and implement guidelines for the effective use of social media<br />
Develop social marketing campaigns for tobacco restrictions on park properties<br />
and graffiti management<br />
Provide communications and marketing support to corporate initiatives, such as<br />
follow up to the Citizen Survey, Corporate Plan, Human Resources projects, and<br />
web site re-design<br />
Continue to improve direct-to-stakeholder outreach<br />
CAO 1.8 Begin to identify priorities and implement recommendations from the HRM<br />
publications review<br />
Objectives for the next 3-5 years:<br />
CAO 1.9<br />
CAO 1.10<br />
CAO 1.11<br />
Implement comprehensive communications and marketing plans for Council<br />
Focus Areas and corporate priorities<br />
Develop a comprehensive organization-wide approach to annual communications<br />
and marketing planning<br />
Continue to implement the key pillars of HRM’s Strategic Communications Plan<br />
Goal 2:<br />
Manage the Process of Council and Committee Reform<br />
Corporate Strategy Linkage:<br />
Council Focus Area - Governance and Communications<br />
Community Outcome Area - Well Planned and Engaged Communities<br />
Description:<br />
The anticipated outcome of the Governance portion of the Governance and Communications<br />
Council Focus Area is to meet Council’s objective of creating a council and committee<br />
governance structure that is efficient, effective, scaled appropriately, and where decisions are<br />
made at the appropriate level. There are two primary initiatives under this outcome. The first is<br />
to explore reforming and better aligning Committees of Council. The second is to conduct a<br />
legislated District Boundary Review that will include reviews of Council size and of the role and<br />
authority of Community Councils.<br />
Goal 2:<br />
Manage the Process of Council and Committee Reform<br />
Objectives for 2010/2011:<br />
CAO 2.1<br />
CAO 2.2<br />
Provide staff leadership and Council support in the delivery of HRM’s District<br />
Boundary Review, Phase 1 – governance<br />
Provide staff leadership and Council support in the delivery of HRM’s District<br />
Boundary Review, Phase 2 – boundaries<br />
D7
<strong>Halifax</strong> <strong>Regional</strong> <strong>Municipality</strong><br />
2010/11 Business Plans and Budget (Proposed) Office of the Chief Administrative Officer<br />
CAO 2.3 Conduct a comprehensive public consultation process to support the District<br />
Boundary Review<br />
CAO 2.4 Submit District Boundary Review recommendations to the Nova Scotia Utility<br />
and Review Board<br />
CAO 2.5 Develop a plan for <strong>Regional</strong> Council’s consideration of the roles and authority of<br />
Community Councils in conjunction with the District Boundary Review process<br />
CAO 2.6 Provide staff leadership and Council support for review and implementation (if<br />
required) of Committee of Council Reform<br />
Objectives for the next 3-5 years:<br />
CAO 2.7<br />
CAO 2.8<br />
Implement the recommendations of the District Boundary Review<br />
Develop a Council Committee structure that better meets the needs of Council,<br />
residents, and the organization.<br />
Goal 3:<br />
Improve Employee Engagement and Internal<br />
Communications<br />
Corporate Strategy Linkage:<br />
Council Focus Area - Governance and Communications<br />
EMT Priority - Employer of Choice<br />
Description:<br />
One of HRM’s stated objectives is to be recognized as an “Employer of Choice”. To meet this<br />
objective, it is important to measure the level of employee engagement and address areas of<br />
concern. Employee engagement is staff commitment to their employer, combined with<br />
alignment of employee behaviour and organizational objectives. There is a clear connection<br />
between engagement and employee performance. HRM has conducted two employee<br />
engagement surveys and initiated strategies to address this challenge. The surveys identified<br />
communication as one of the top three areas for improvement in HRM. Sharing of information<br />
among employees promotes a more cohesive, and thereby more satisfying, working environment.<br />
Improved internal communications also results in improved customer service and better<br />
integration of different work functions.<br />
Goal 3:<br />
Improve Employee Engagement and Internal<br />
Communications<br />
Objectives for 2010/2011:<br />
CAO 3.1<br />
CAO 3.2<br />
Develop and implement a plan to respond to the CAO Business Unit results of<br />
the latest Employee Engagement survey<br />
Develop a communications plan to respond to results of the employee<br />
engagement survey, specifically in the area of total compensation<br />
D8
<strong>Halifax</strong> <strong>Regional</strong> <strong>Municipality</strong><br />
2010/11 Business Plans and Budget (Proposed) Office of the Chief Administrative Officer<br />
CAO 3.3<br />
CAO 3.4<br />
CAO 3.5<br />
Develop and implement an internal communications strategy to enhance<br />
employee engagement and organizational awareness<br />
Implement and monitor a Senior Management Team (SMT) engagement plan<br />
Develop a comprehensive Succession Plan for the CAO Business Unit<br />
CAO 3.6 Support EMT’s Employer of Choice priority, including the Human Resources<br />
People Plan, Workforce Planning, leadership development, and recruitment<br />
Objectives for the next 3-5 years:<br />
CAO 3.7<br />
CAO 3.8<br />
Develop a strategic, long term approach to improve employee engagement<br />
throughout the organization<br />
Track and measure effectiveness and corporate change resulting from employee<br />
engagement survey recommendations<br />
Goal 4:<br />
Provide Professional Support to Elected Officials and the<br />
Legislative Process<br />
Corporate Strategy Linkage:<br />
Council Focus Area - Governance and Communications<br />
EMT Priority - Employer of Choice<br />
Description:<br />
One of the primary roles of the Chief Administrative Office is to support the municipality’s<br />
elected officials. The CAO and Deputy CAOs achieve this by providing information and advice<br />
to the Mayor and Council to assist with the development and evaluation of strategic directions,<br />
policies, and priorities. The Mayor’s Office, Council Support Office, and the Office of the<br />
Municipal Clerk provide a variety of direct services and support to elected officials. The end<br />
product of this combined support is the effective implementation of the policy and priorities of<br />
<strong>Regional</strong> Council to help carry out the governance and administration of the Region.<br />
Goal 4:<br />
Provide Professional Support to Elected Officials and the<br />
Legislative Process<br />
Objectives for 2010/2011:<br />
CAO 4.1<br />
CAO 4.2<br />
CAO 4.3<br />
CAO 4.4<br />
Determine appropriate models and approaches to improve legislative, electoral<br />
and record keeping services to <strong>Regional</strong> Council, Community Councils, boards,<br />
committees, and commissions<br />
Continue to adapt and improve support to the Mayor and members of <strong>Regional</strong><br />
Council<br />
Continue to increase the focus on community relations and liaison with citizens<br />
through the Office of the Mayor and the Council Support Office<br />
Facilitate ease of public access to the legislative process through the Office of the<br />
Municipal Clerk<br />
D9
<strong>Halifax</strong> <strong>Regional</strong> <strong>Municipality</strong><br />
2010/11 Business Plans and Budget (Proposed) Office of the Chief Administrative Officer<br />
CAO 4.5 Develop and implement approaches to improve and maintain working<br />
relationships between Council and staff<br />
CAO 4.6 Engage Council on determining their communications needs and implementing<br />
required tools and resources (i.e. training)<br />
Objectives for the next 3-5 years:<br />
CAO 4.7<br />
CAO 4.8<br />
Refine the structure and process of Council and Mayor support functions<br />
Continuously improve communications and working relations between Council<br />
and staff<br />
Goal 5:<br />
Promote Effective Senior Management Decision-Making<br />
Corporate Strategy Linkage:<br />
EMT Priorities – Employer of Choice, Fiscal Responsibility, and Excellence in Service Delivery<br />
Description:<br />
Members of the Executive Management Team (EMT) are the direct supervisors of all Business<br />
Unit Directors and, as such, lead the administrative function of the corporation. As well, some<br />
functional areas (e.g. communications and marketing) and individual staff within the CAO<br />
Business Unit provide services to other business units and/or lend direct support to the Executive<br />
and Senior Management Teams. Because of the multiplicity of responsibilities that exist within<br />
the Chief Administrative Office, an important function of the business unit is to ensure effective<br />
leadership and support is provided to senior management and, consequently, staff throughout the<br />
organization.<br />
Goal 5:<br />
Promote Effective Senior Management Decision-Making<br />
Objectives for 2010/2011:<br />
CAO 5.1<br />
CAO 5.2<br />
Develop a process for regular issue identification and tracking with the Executive<br />
Management Team (EMT) and the Senior Management Team (SMT)<br />
Improve the process of briefing EMT on emerging and ongoing issues<br />
CAO 5.3 Ensure appropriate direction is provided to Business Units to support the<br />
implementation of EMT priorities and achievement of results<br />
CAO 5.4 Regularly monitor progress of EMT priorities and, where necessary, adapt<br />
approaches<br />
CAO 5.5 Monitor Council Focus Area activity to identify areas of policy and research<br />
support required<br />
CAO 5.6 Provide support to staff, senior management and/or Council on corporate policy,<br />
strategy initiatives, and issues as required<br />
Objectives for the next 3-5 years:<br />
CAO 5.7<br />
Ensure EMT Priorities are a fundamental part of corporate and business planning<br />
D10
<strong>Halifax</strong> <strong>Regional</strong> <strong>Municipality</strong><br />
2010/11 Business Plans and Budget (Proposed) Office of the Chief Administrative Officer<br />
CAO 5.8<br />
Ensure full engagement of the Senior Management Team in implementation of<br />
the Corporate Plan and associated Community Outcome Areas<br />
Goal 6:<br />
Enable Active and Coordinated Liaison with Partners<br />
Corporate Strategy Linkage:<br />
Council Focus Area – Infrastructure<br />
Council Focus Area - Governance and Communications<br />
EMT Priority - Excellence in Service Delivery<br />
Description:<br />
Valuing relationships with partners is an essential component of good governance. Strong<br />
cooperation with external stakeholders – such as other levels of government, interest groups,<br />
community organizations, and the private sector – enables HRM and others to better achieve<br />
community outcomes. Now more than ever, strong linkages are required among a variety of<br />
stakeholders to ensure resources are utilized in the best possible manner. Building and<br />
maintaining sound intergovernmental and partner relations is a key to ensuring success at<br />
meeting the needs of citizens and providing effective and efficient public service.<br />
Goal 6:<br />
Enable Active and Coordinated Liaison with Partners<br />
Objectives for 2010/2011:<br />
CAO 6.1<br />
Continue to monitor and adapt HRM’s Government Relations Plan.<br />
CAO 6.2 Support the Infrastructure Council Focus Area by undertaking strong advocacy<br />
efforts to advance HRM priority projects<br />
CAO 6.3 Establish implementation priorities within Memorandums of Understanding<br />
signed between HRM and other organizations<br />
CAO 6.4 Increase the effectiveness and awareness of the Memorandums of Understanding<br />
signed between HRM and other organizations<br />
CAO 6.5 Coordinate the planning for the 2011 Federation of Canadian Municipalities<br />
(FCM) and Canadian Association of Municipal Administrators (CAMA)<br />
conferences<br />
CAO 6.6 As required and appropriate, provide support to the 2011 Canada Winter Games<br />
Host Society through value-in-kind contributions and staff secondments<br />
Objectives for the next 3-5 years:<br />
CAO 6.7<br />
CAO 6.8<br />
Improve use of Memorandums of Understanding as a tool to plan and implement<br />
joint priorities with partners<br />
Continue to enhance HRM’s government relations function<br />
D11
<strong>Halifax</strong> <strong>Regional</strong> <strong>Municipality</strong><br />
2010/11 Business Plans and Budget (Proposed) Office of the Chief Administrative Officer<br />
Goal 7:<br />
Implement the HRM Economic Strategy<br />
Corporate Strategy Linkage:<br />
Community Outcome Area - Economic Prosperity<br />
EMT Priority - Fiscal Responsibility<br />
Description:<br />
A goal of the Economic Prosperity Community Outcome in HRM’s corporate planning<br />
framework is to position HRM as the center of economic activity for Eastern Canada, and ensure<br />
citizens benefit from an attractive business climate, and good employment opportunities. A<br />
central piece of achieving this goal is continued implementation of HRM’s Economic Strategy.<br />
The Strategy outlines a comprehensive direction for future economic development in the Region<br />
and is implemented and tracked in partnership with organizations such as the Greater <strong>Halifax</strong><br />
Partnership and <strong>Halifax</strong> Chamber of Commerce. Continued implementation and renewal of the<br />
strategy will ensure a coordinated approach to meeting HRM’s economic goals.<br />
Goal 7:<br />
Implement the HRM Economic Strategy<br />
Objectives for 2010/2011:<br />
CAO 7.1<br />
CAO 7.2<br />
CAO 7.3<br />
CAO 7.4<br />
CAO 7.5<br />
Deliver the 2011-2016 Economic Strategy renewal for Council’s consideration<br />
Represent HRM and/or provide support to internal and external economic<br />
development partners on key initiatives<br />
Lead a process to renew HRM’s service agreement with the Greater <strong>Halifax</strong><br />
Partnership, and ensure it is aligned with the Economic Strategy<br />
Provide support to strategic initiatives related to HRM’s economic agenda such<br />
as the proposed new Convention Centre, business parks planning, public<br />
investment strategy for Capital District, HRM by Design, and Atlantic Gateway<br />
Coordinate HRM’s response to the <strong>Halifax</strong> Chamber of Commerce Scorecard<br />
CAO 7.6 As required, contribute policy and research support to the establishment of a new<br />
service agreement with Destination <strong>Halifax</strong><br />
CAO 7.7 Clarify roles and responsibilities and coordinate alignment of business processes<br />
to advance the internal implementation of HRM’s Economic Strategy<br />
Objectives for the next 3-5 years:<br />
CAO 7.8<br />
CAO 7.9<br />
Embed the Economic Strategy as part of HRM decision-making framework<br />
Continue to work with partners to ensure a coordinated approach to economic<br />
development in the region.<br />
D12
<strong>Halifax</strong> <strong>Regional</strong> <strong>Municipality</strong><br />
2010/11 Business Plans and Budget (Proposed) Office of the Chief Administrative Officer<br />
Goal 8:<br />
Meet Internal Service Expectations<br />
Corporate Strategy Linkage:<br />
EMT Priority – Excellence in Service Delivery<br />
Description:<br />
Often, HRM business units depend on the expertise of staff in other business units to support<br />
their operations and/or contribute to specific initiatives, committees and projects. The primary<br />
areas of expertise sought from the Office of the CAO by other business units include executive<br />
and corporate support, policy advice, and assistance with marketing and communications. These<br />
internal service requests and requirements for the upcoming year that have not been captured<br />
under the previous goals listed in the plan include the following.<br />
Goal 8:<br />
Meet Internal Service Expectations<br />
Objectives for 2010/2011:<br />
CAO 8.1<br />
CAO 8.2<br />
CAO 8.3<br />
CAO 8.4<br />
Provide support to implementing and communicating corporate policies such as<br />
Duty to Accommodate, Substance Abuse, Values and Ethics, Privacy, Signing<br />
Authority, and Cash Management<br />
As required, provide staff input and support to collective bargaining, planned<br />
staff realignments, service review, and corporate accommodations initiatives<br />
As appropriate, participate on corporate committees such as Employee<br />
Recognition; Corporate Awards; Labour Management; Information,<br />
Communication and Technology; United Way; Emergency Management<br />
Operations; and Corporate Accommodations<br />
Provide communications, marketing, and issues management support to ongoing<br />
initiatives such as the budget and business planning process, municipal<br />
operations, solid waste diversion and education, etc.<br />
Goal 9:<br />
Meet Internal Partnership / Collaboration Requirements<br />
Corporate Strategy Linkage:<br />
EMT Priority – Excellence in Service Delivery<br />
Description:<br />
The provision of quality programs and services depends on business units working together.<br />
This is especially true in developing and implementing initiatives that have an effect throughout<br />
the organization. The internal partnership and collaboration requirements for the upcoming<br />
year that have not been captured under the previous goals listed in the plan include the following.<br />
D13
<strong>Halifax</strong> <strong>Regional</strong> <strong>Municipality</strong><br />
2010/11 Business Plans and Budget (Proposed) Office of the Chief Administrative Officer<br />
Goal 9:<br />
Meet Internal Partnership / Collaboration Requirements<br />
Objectives for 2010/2011:<br />
CAO 9.1<br />
CAO 9.2<br />
Provide communications support to corporate initiatives such as the <strong>Regional</strong><br />
Plan Review, Community Visioning, Youth Advocate Program, and Security<br />
Clearance initiative<br />
Participate and provide input on corporate-wide initiatives such as the roll out of<br />
new desktop applications and operating system, review of the Multi-Year<br />
Financial Strategy, Security Clearance Project, and Workforce Planning initiative<br />
Increases In Services / New Initiatives:<br />
Service Level Changes<br />
• Development of Communications and Marketing strategies for Council Focus Areas;<br />
• Development of an Internal Communications Strategy;<br />
• New social media guidelines / strategy;<br />
• Development of District Boundary Review recommendations;<br />
• Delivery of the 2011-2016 Economic Strategy renewal.<br />
Decreases In Services / Operational Pressures (OP):<br />
• As a result of the hiring of the municipal Auditor General, the Business Systems and Control<br />
Group has been transferred from the CAO Business Unit to his office.<br />
Expected Services Not Being Delivered:<br />
None<br />
D14
Office of the Chief Administrator<br />
Summary of Gross Expenditures by Division<br />
2008-2009 2009-2010 2009-2010 2010-2011 Change over<br />
Actual Budget Projections Budget Budget Var as %<br />
CAO Office<br />
E110 CAO Office 454,806 446,290 474,650 437,635 (8,655) (1.9)<br />
E130 FCM Conference 2011 0 0 0 (17,250) (17,250) -<br />
454,806 446,290 474,650 420,385 (25,905) (5.8)<br />
CAO Administration<br />
E121 Greater Hlfx Partner 1,400,000 1,400,000 1,400,000 1,400,000 0 -<br />
E200 Councillor's Support 2,594,267 2,674,800 2,910,300 2,837,550 162,750 6.1<br />
E300 Mayor's Support 700,369 770,500 770,500 788,746 18,246 2.4<br />
4,694,637 4,845,300 5,080,800 5,026,296 180,996 3.7<br />
External & Corp. Affairs<br />
E112 Corp.Comm.Admin. 114,404 96,600 92,200 0 (96,600) (100.0)<br />
E400 Intergovrn. Relation 536,968 806,200 614,633 974,807 168,607 20.9<br />
E600 Economic Development (4,850) 0 0 0 0<br />
646,521 902,800 706,833 974,807 72,007 8.0<br />
Marketing, Design, Print Servic<br />
A124 Office Services 1,205,382 1,093,070 1,153,825 1,101,217 8,147 0.7<br />
A620 Mrkt & Promotions 923,334 1,007,530 1,009,873 1,021,460 13,930 1.4<br />
A621 Mrkt & Prom.-Hbr Sol 1,965<br />
2,130,680 2,100,600 2,163,698 2,122,677 22,077 1.1<br />
DCAO Corporate Services & Strat<br />
E124 DCAO-Corp Serv & Str 259,618 264,160 264,160 276,348 12,188 4.6<br />
A121 Municipal Clerk 845,951 953,160 952,787 986,430 33,270 3.5<br />
A125 Elections 569,270 202,000 202,000 203,100 1,100 0.5<br />
1,674,838 1,419,320 1,418,947 1,465,878 46,558 3.3<br />
DCAO Operations<br />
C001 DCAO - Operations 468,578 484,080 484,080 497,784 13,704 2.8<br />
468,578 484,080 484,080 497,784 13,704 2.8<br />
Total $10,070,060 $10,198,390 $10,329,008 $10,507,827 $309,437 3.0<br />
D15
Office of the Chief Administrator<br />
Summary of Gross Revenue by Division<br />
2008-2009 2009-2010 2009-2010 2010-2011 Change over<br />
Actual Budget Projections Budget Budget Var as %<br />
CAO Administration<br />
E200 Councillor's Support (25,423) (30,400) (30,400) (30,600) (200) 0.7<br />
E300 Mayor's Support (5,304) 0 0 (35,800) (35,800) -<br />
(30,727) (30,400) (30,400) (66,400) (36,000) 118.4<br />
External & Corp. Affairs<br />
E400 Intergovrn. Relation (71,052) 0 0 0 0 -<br />
(71,052) 0 0 0 0 -<br />
Marketing, Design, Print Service<br />
A124 Office Services (363,744) (257,000) (318,000) (50,000) 207,000 (80.5)<br />
A620 Mrkt & Promotions 0 0 (825) 0 0 -<br />
A621 Mrkt & Prom.-Hbr Sol (1,965) 0 0 0 0 -<br />
(365,709) (257,000) (318,825) (50,000) 207,000 (80.5)<br />
DCAO Corporate Services & Strate<br />
E124 DCAO-Corp Serv & Str (18,067) 0 0 0 0 -<br />
A121 Municipal Clerk (1,231) 0 0 0 0 -<br />
A125 Elections (367,274) 0 0 0 0 -<br />
(386,572) 0 0 0 0 -<br />
Total (854,060) (287,400) (349,225) (116,400) 171,000 (59.5)<br />
D16
Office of the Chief Administrator<br />
Summary of Net Expenditures by Division<br />
2008-2009 2009-2010 2009-2010 2010-2011 Change over<br />
Actual Budget Projections Budget Budget Var as %<br />
CAO Office<br />
E110 CAO Office 454,806 446,290 474,650 437,635 (8,655) (1.9)<br />
E130 FCM Conference 2011 0 0 0 (17,250) (17,250) -<br />
454,806 446,290 474,650 420,385 (25,905) (5.8)<br />
CAO Administration<br />
E121 Greater Hlfx Partner 1,400,000 1,400,000 1,400,000 1,400,000 0 -<br />
E200 Councillor's Support 2,568,845 2,644,400 2,879,900 2,806,950 162,550 6.1<br />
E300 Mayor's Support 695,066 770,500 770,500 752,946 (17,554) (2.3)<br />
4,663,910 4,814,900 5,050,400 4,959,896 144,996 3.0<br />
External & Corp. Affairs<br />
E112 Corp.Comm.Admin. 114,404 96,600 92,200 0 (96,600) (100.0)<br />
E400 Intergovrn. Relation 465,916 806,200 614,633 974,807 168,607 20.9<br />
E600 Economic Development (4,850) 0 0 0 0 -<br />
575,469 902,800 706,833 974,807 72,007 8.0<br />
Marketing, Design, Print Servic<br />
A124 Office Services 841,638 836,070 835,825 1,051,217 215,147 25.7<br />
A620 Mrkt & Promotions 923,334 1,007,530 1,009,048 1,021,460 13,930 1.4<br />
1,764,972 1,843,600 1,844,873 2,072,677 229,077 12.4<br />
DCAO Corporate Services & Strat<br />
E124 DCAO-Corp Serv & Str 241,550 264,160 264,160 276,348 12,188 4.6<br />
A121 Municipal Clerk 844,720 953,160 952,787 986,430 33,270 3.5<br />
A125 Elections 201,996 202,000 202,000 203,100 1,100 0.5<br />
1,288,266 1,419,320 1,418,947 1,465,878 46,558 3.3<br />
DCAO Operations<br />
C001 DCAO - Operations 468,578 484,080 484,080 497,784 13,704 2.8<br />
468,578 484,080 484,080 497,784 13,704 2.8<br />
Total $9,216,001 $9,910,990 $9,979,783 $10,391,427 $480,437 4.8<br />
D17
Office of the Chief Administrator<br />
Summary by Expenditure & Revenue Types<br />
2008-2009 2009-2010 2009-2010 2010-2011 Change over<br />
Actual Budget Projections Budget Budget Var as %<br />
Expenditures<br />
Compensation & Benefits 6,185,260 6,278,600 6,536,651 6,769,900 491,300 7.8<br />
Office 1,285,880 919,800 963,440 915,977 (3,823) (0.4)<br />
Professional Fees 2,000<br />
Legal & Consulting Fees 13,030 45,200 101,095 34,960 (10,240) (22.7)<br />
External Services 1,049,173 190,200 186,858 301,700 111,500 58.6<br />
Uniforms & Clothing 300 400 300<br />
Supplies & Materials 143,322 118,400 126,600 106,560 (11,840) (10.0)<br />
Building Costs 128<br />
Equipment & Communications 29,833 38,700 36,700 37,900 (800) (2.1)<br />
Vehicle Expense 70<br />
Travel 131,185 128,500 118,263 118,115 (10,385) (8.1)<br />
Training & Education 4,598 24,900 18,593 33,200 8,300 33.3<br />
Facilities Rental 64,328 1,000 1,600 1,010 10 1.0<br />
Advertising & Promotion 288,499 211,600 225,280 161,460 (50,140) (23.7)<br />
Other Goods & Services 508,746 783,090 553,300 648,645 (134,445) (17.2)<br />
Interdepartmental (42,358) (143,900) (143,900) 143,900 (100.0)<br />
Grants & Tax Concessions 1,400,000 1,400,000 1,400,000 1,400,000<br />
Transfer to/from Reserves (991,506) 202,000 202,000 (21,900) (223,900) (110.8)<br />
Expenditures 10,070,060 10,198,390 10,329,008 10,507,827 309,437 3.0<br />
Total $10,070,060 $10,198,390 $10,329,008 $10,507,827 $309,437 3.0<br />
Revenues<br />
Sales Revenue (22,024) (30,400) (30,400) (30,600) (200) 0.7<br />
Other Revenue (832,044) (257,000) (318,825) (85,800) 171,200 (66.6)<br />
Interdepartmental Revenue 8<br />
Revenues (854,060) (287,400) (349,225) (116,400) 171,000 (59.5)<br />
Total (854,060) (287,400) (349,225) (116,400) 171,000 (59.5)<br />
Net Cost $9,216,001 $9,910,990 $9,979,783 $10,391,427 $480,437 4.8<br />
D18
Office of the Auditor General<br />
Summary of Gross Expenditures by Division<br />
2008-2009 2009-2010 2009-2010 2010-2011 Change over<br />
Actual Budget Projections Budget Budget Var as %<br />
G100 Off of the Aud Gen - 330,000 232,450 659,494 329,494 99.8<br />
Total - $330,000 $232,450 $659,494 $329,494 99.8<br />
Summary of Gross Revenue by Division<br />
2008-2009 2009-2010 2009-2010 2010-2011 Change over<br />
Actual Budget Projections Budget Budget Var as %<br />
G100 Off of the Aud Gen - - - - - -<br />
Total - - - - - -<br />
Summary of Net Expenditures by Division<br />
2008-2009 2009-2010 2009-2010 2010-2011 Change over<br />
Actual Budget Projections Budget Budget Var as %<br />
G100 Off of the Aud Gen - 330,000 232,450 659,494 329,494 99.8<br />
Total - $330,000 $232,450 $659,494 $329,494 99.8<br />
Summary by Expenditure & Revenue Types<br />
2008-2009 2009-2010 2009-2010 2010-2011 Change over<br />
Actual Budget Projections Budget Budget Var as %<br />
Expenditures<br />
Compensation & Benefits - 220,000 104,100 585,129 365,129 166.0<br />
Office - 15,000 24,600 24,010 9,010 60.1<br />
Professional Fees - - 250 4,500 4,500 -<br />
External Services - 45,000 44,100 11,900 (33,100) (73.6)<br />
Supplies & Materials - 10,000 1,000 - (10,000) (100.0)<br />
Equipment & Communicatio - 2,500 4,500 1,200 (1,300) (52.0)<br />
Travel - 2,500 - 3,955 1,455 58.2<br />
Training & Education - - - 20,200 20,200 -<br />
Facilities Rental - 35,000 35,000 - (35,000) (100.0)<br />
Advertising & Promotion - - 18,200 450 450 -<br />
Other Goods & Services - - 600 68,150 68,150 -<br />
Interdepartmental - - 100 - - -<br />
Transfer to/from Reserves - - - (60,000) (60,000) -<br />
Expenditures - 330,000 232,450 659,494 329,494 99.8<br />
Total - $330,000 $232,450 $659,494 $329,494 99.8<br />
Revenues - - - - - -<br />
Total - - - - - -<br />
Net Cost - $330,000 $232,450 $659,494 $329,494 99.8<br />
Da1
<strong>Halifax</strong> <strong>Regional</strong> <strong>Municipality</strong><br />
2010/11 Business Plans and Budget (Proposed) Business Planning & Information Management<br />
Business Planning &<br />
Information<br />
Management<br />
Business Plan - 2010/11
<strong>Halifax</strong> <strong>Regional</strong> <strong>Municipality</strong><br />
2010/11 Business Plans and Budget (Proposed) Business Planning & Information Management<br />
Mission: In support of Excellence in Service Delivery, Business Planning & Information<br />
Management provides integrated, client-focused solutions in the areas of<br />
technology, knowledge/data management, and public access through the<br />
provision of leadership, expertise, advice, products, and standards.<br />
Business Unit Overview:<br />
Business Planning and Information Management (BPIM) is organized into several divisions which<br />
emphasize service delivery to citizens and business units in support of <strong>Halifax</strong> <strong>Regional</strong><br />
<strong>Municipality</strong>’s strategic outcomes.<br />
Director:<br />
Client Services<br />
Data/Business<br />
Information<br />
Management<br />
Donna Davis<br />
Information<br />
Technology<br />
David Muise<br />
Brad Anguish<br />
The Client Services Division of Business Planning and Information<br />
Management manages the processes, systems and services delivered<br />
through HRM's citizen-facing information and service channels:<br />
• Corporate Call Centre & Dispatch Services<br />
• Visitor Information Centres<br />
• Customer Service Centres<br />
• Web Services<br />
The Data/ Business Information Management Division is responsible<br />
for overall information management within the HRM organization.<br />
The division provides corporate direction regarding the collection,<br />
management, use, and protection of geographic and business data/<br />
information under the following sections and programs:<br />
• Access & Privacy<br />
• Corporate Data Strategies & Projects<br />
• Municipal Archives<br />
• Corporate Document & Records Management<br />
• Civic Addressing Program<br />
• Geographic Information Systems Services (GISS)<br />
Information Technology provides management and stewardship of<br />
HRM's Communication and Technology investments, and develops<br />
plans for maintaining and enhancing systems throughout their life<br />
cycle. These services are delivered through the following sections:<br />
• Information Technology Professional Services<br />
• Application Development and Support<br />
• Technology and Infrastructure<br />
• Customer Care & PC Support Services<br />
E2
<strong>Halifax</strong> <strong>Regional</strong> <strong>Municipality</strong><br />
2010/11 Business Plans and Budget (Proposed) Business Planning & Information Management<br />
Corporate Planning<br />
<strong>Halifax</strong> Harbour<br />
Solutions Project<br />
Ted Tam,<br />
Project Manager<br />
Summary of<br />
Business Unit<br />
Structure Changes:<br />
Corporate Planning facilitates and coordinates the implementation of<br />
HRM`s Corporate Planning Framework. Ensures Business Unit<br />
goals, objectives, and performance measures are documented,<br />
accessible, and aligned with Council’s direction on community<br />
outcomes as articulated in the Corporate Plan. Develops tools and<br />
processes to assist Council and Senior Management in strategic and<br />
operational decision making.<br />
This project will construct wastewater treatment plants and collection<br />
systems in <strong>Halifax</strong>, Dartmouth and Herring Cove, along with a<br />
biosolids processing facility to improve the water quality of the<br />
<strong>Halifax</strong> Harbour.<br />
None<br />
Core Operations and Services provided:<br />
• Visitor Information Services provided to 74,000 visitors through 11 Visitor Information<br />
Centres, a decrease of 8,000 from 2008.<br />
• Customer Service Centres handled 151,272 transactions (2008-2009) a decrease of 25,000 from<br />
2007-2008.<br />
• Corporate Call Centre received just under 600,000 calls in 2009, a slight decrease of 34,000<br />
from 2008. (2008: 634,000, 2007: 584,000, 2006: 534,709)<br />
• <strong>Halifax</strong>.ca website received more than 3.8 million visits via 1.4 million people.<br />
• Municipal Archives responded to 460 reference requests and supported 207 visits to the<br />
Archives' research room, an increase of 50 visits from 2008. (2008: 440 requests, 159 visits);<br />
facilitated 70 requests for copies of archival material generating over $1600 in cost-recovery<br />
funds<br />
• Over 200 boxes of Dartmouth Town Clerk/Treasurers records and 150 boxes of Dartmouth<br />
records transferred from the Dartmouth Heritage Museum processed and described on-line with<br />
financial assistance from NS Tourism, Culture and Heritage<br />
• Over 2000 rolls of master microfilm were re-housed and quality checked for potential<br />
digitization, with financial assistance from Library and Archives Canada & Department of<br />
Canadian Heritage<br />
• Tours of the Archives given to over 40 HRM staff and information colleagues<br />
• Information Resource Management supported HRM in complying with its legislated<br />
responsibility under Part XX of the MGA with respect to Freedom of Information and<br />
Protection of Privacy (FOIPOP) as well as the requirements of the Personal Information<br />
International Disclosure Protection Act (PIIDPA). 76 FOIPOP applications were received in<br />
2009, an increase of 25 from 2009. (2008: 51 applications, 2007: 43 applications, 2006: 34<br />
applications).<br />
• Twenty-seven new archival acquisitions, including School Board minutes from Dartmouth, the<br />
County and Bedford, dating from 1864; <strong>Halifax</strong> Police Commission records, 1894-1940; an<br />
architectural print of Edward Elliot's 1887 City Hall Design; records from the <strong>Halifax</strong> Home for<br />
E3
<strong>Halifax</strong> <strong>Regional</strong> <strong>Municipality</strong><br />
2010/11 Business Plans and Budget (Proposed) Business Planning & Information Management<br />
Aged Men, 1900-1950; and the records of the Dartmouth citizen group opposed to the Little<br />
Nashville Cabaret relocation in 1989.<br />
• Geographic Information Management Services (GISS) produced 4509 linear feet of map<br />
product (up from 3000 linear feet in 2008);<br />
• Data Management completed base data inventories of HRM owned recreation facilities, trails<br />
and pathways, pedestrian bridges, and grass mowing areas in support of the corporate asset<br />
management project/ program.<br />
• Information Technology prevented 83,295,450 unauthorized attempts to access HRM firewall<br />
ports<br />
• Managed 71,784,936 incoming e-mail of which 65,721,492 messages were blocked as spam<br />
• Blocked 8,964 viruses attached to e-mail<br />
• Detected and removed 8,000 viruses from desktops<br />
• Responded to 17,136 service calls taken through IT service desk and generated 19,195 work<br />
orders<br />
• Managed 2,000 desktops and 500 laptops<br />
• Managed 2,500 desk phones, 1,000 cell phones, 500 BlackBerry’s, and 70 air cards<br />
• Supported 2,616 users on the HRM Network<br />
Funded Full Time Equivalents (FTEs):<br />
Funded FTEs (includes full and<br />
part-time permanent positions)<br />
2008/09 2009/10 2010/11<br />
(Approved) (Approved) (Proposed)<br />
163 168 173<br />
E4
<strong>Halifax</strong> <strong>Regional</strong> <strong>Municipality</strong><br />
2010/11 Business Plans and Budget (Proposed) Business Planning & Information Management<br />
Analysis of <strong>Operating</strong> Budget Changes:<br />
<strong>Operating</strong> Budget Change Details<br />
($000's)<br />
2009/10 Budget 19,014<br />
1 Increased revenue budget for <strong>Halifax</strong> Water SLA and Civic Addressing<br />
142<br />
funding<br />
2 Increase in compensation 645<br />
3 Increase for <strong>Operating</strong> cost of capital projects 79.2<br />
4 Increase for cost of living increase 30.4<br />
5 Decrease for extension of computer equipment life-cycling (300)<br />
6 Decrease Visitor Information Centres (266)<br />
7 Decrease for discontinued holiday service at call centre (50)<br />
8 Decrease for closure of Cole Harbour Place customer service centre (7.6)<br />
2010/11 Budget 19,287<br />
Key Challenges and Opportunities<br />
The following challenges and opportunities will have an impact on the Business Unit between the<br />
2010-2015 timeframe.<br />
Challenges with Community-wide Impact:<br />
These are challenges or opportunities which affect the entire HRM Region, and which the Business<br />
Unit plays a role in influencing or addressing the outcome. Multiple business units may be<br />
involved in addressing the issue.<br />
• Challenge: Identifying Community and Council Priority direction and aligning<br />
Departmental Business Plans with that direction - The current global economic crisis will<br />
place significant strain on municipal revenues over the next few years. Council and staff must<br />
develop the governance processes required to control revenues and expenditures in accordance<br />
with the priorities set by Council. The current Council Focus Area process provides a broad<br />
view of what Council and the Community need from the organization. Narrowing the focus to<br />
more specific Community Outcomes will offer clearer direction on where to focus resources,<br />
ensuring that maximum effort is applied to Council’s community priorities. Engaging an<br />
aggressive and continuous service review program, harmonized with the efforts of the<br />
Municipal Auditor General, will help Council and staff to control/eliminate unnecessary<br />
program/service expenditures.<br />
E5
<strong>Halifax</strong> <strong>Regional</strong> <strong>Municipality</strong><br />
2010/11 Business Plans and Budget (Proposed) Business Planning & Information Management<br />
Challenges with Service Delivery / Business Unit Impact<br />
These are issues which affect the business unit’s ability to deliver services (both internally and<br />
externally).<br />
• Challenge: Appropriate Investment in Data & Technology to support desired outcomes -<br />
Our data, tools and IT infrastructure are fundamental assets required to support municipal<br />
service delivery. In this technological age, the delivery of most municipal services is dependent<br />
upon and supported by information and technology. It is critical therefore that we manage these<br />
assets no differently than our streets, sewers or parks. The lifecycle of technology and data<br />
assets must be planned for and managed to ensure that we are getting the greatest return on our<br />
investments and that public investment in these assets is protected over their life. As well, we<br />
must ensure that citizen-serving technologies and information services demanded by the public<br />
are properly funded and resourced to guarantee success.<br />
With the establishment of the Information, Communication, Technology Committee (ICT),<br />
visibility into corporate investment in technology solutions has been enhanced. BPIM's<br />
challenge is now to ensure the value of investment in the underlying infrastructure and data sets<br />
is well understood, and the financial and staff capacity to ensure these are maintained is<br />
available.<br />
• Challenge: Vulnerability from Staffing Issues - Information Management / Information<br />
Technology - Within BPIM there are many positions that are highly technical, require a<br />
specialized skill set, and are one of a kind in the organization. The development of the ICT Plan<br />
of Record has clearly demonstrated the internal demand for certain skills far outstrips BPIM's<br />
current resource mix and availability, which may impede our ability to deliver in accordance<br />
with the expectations of our clients. This issue will be especially acute in 2010/11 in the area of<br />
customer care as staff tackles a number of key corporate accommodation changes (such as<br />
West End Mall relocation, Duke Tower/Alderney Gate relocations, Ragged Lake Transit<br />
Center, Canada Games facilities, Prospect Recreation Centre) while rolling out new desktop<br />
software tools across the organization. These factors combined with rapidly changing<br />
technology, reinforce the importance of ensuring appropriate workloads to enable training of<br />
technical staff as well as continuing our investment in training, both for retention as well as<br />
ensuring optimum productivity and cost avoidance for consulting services. The services<br />
provided by BPIM are at risk if a staffing plan to cross-train staff, compensate appropriately,<br />
address workplace/ life balance issues, and deal with succession issues is not developed and<br />
implemented. The realignment of organizational functions in BPIM has identified skill gaps<br />
that need to be filled to bring the unit in line with best practices. These skill gaps, combined<br />
with several single points of failure, have been identified as a vulnerability that needs to be<br />
addressed. It is expected that it will take several years to addresses these challenges.<br />
Corporate Planning – The Corporate Planning Office is responsible for:<br />
• coordinating the Business Planning process in concert with the Budget Process;<br />
• developing and coordinating the Corporate Plan;<br />
• leading and coordinating Service Review activities and deliverables;<br />
E6
<strong>Halifax</strong> <strong>Regional</strong> <strong>Municipality</strong><br />
2010/11 Business Plans and Budget (Proposed) Business Planning & Information Management<br />
• managing and communicating the Corporate Planning Framework including strategic<br />
planning efforts with executive and council;<br />
• developing and managing a corporate-wide performance measurement and management<br />
system;<br />
• managing and expanding the Service Catalogue;<br />
• coordinating and reporting Citizen Surveys.<br />
The Corporate Planning Office has a compliment of 3 FTE’s. Given the scope and nature of the<br />
work, the Corporate Planning team relies heavily on other business unit resources to meet<br />
collective objectives. It is challenging to get everything done with only three resources<br />
dedicated full time. The lack of administrative support adds an additional burden, distracting<br />
staff from key, value added tasks. In order to deliver quality work in key areas such as Service<br />
Review and Performance Measurement, additional resources will have to be leveraged.<br />
The past several years have been spent developing the performance reporting framework,<br />
therefore manual collection wasn’t so burdensome on staff resources. Now that the<br />
Performance Framework has matured, manual data collection and compilation is becoming<br />
more and more cumbersome and a technical solution should be sought so that limited human<br />
resources can be assigned to more value added work. In addition to a technical solution, cross<br />
training must be undertaken to reduce the “single points of failure” within the team.<br />
• Challenge: Lack of ICT Policies, Procedures & Standards - The absence of written and<br />
approved policies, procedures, and standards regarding information, communication and<br />
technology activities means there is no clear guidance for the organization and BPIM staff<br />
regarding the use and management of our information and technology assets and resources<br />
which, in some cases, is resulting in uncontrolled expenditures across HRM. Equally<br />
challenging is when adopted policies and procedures are not followed or enforced.<br />
In the case of information resources, the lack of proper management policies and approaches<br />
means information and data is often duplicated, not easily found, and its accuracy and currency<br />
is questionable. Business decisions therefore may not be supported with the best available<br />
information. Equally important, the poor management of information means our obligations<br />
under access and privacy legislation (FOIPOP, PIIDPA) can not be guaranteed. The lack of<br />
policies, standards and practises around our communication and technology assets means assets<br />
may not be tracked and managed, deployed according to business need, or managed effectively<br />
through their lifecycle, all of which may lead to unnecessary expenditures, under or over<br />
servicing of certain activities, and ineffective decision making. A key priority going forward is<br />
to identify, develop, implement, and enforce policies and standards regarding all information,<br />
communication, and technology (ICT) activities and responsibilities. The desired end state is<br />
one where the organization as a whole will know, support, and follow adopted ICT policies,<br />
procedures and standards.<br />
• Challenge - Lack of Stability in Key Vendors – Due to the continued uncertainty in the US<br />
economy where most of HRM's Software vendors are located, there may be rapid and<br />
unpredictable changes in ownership of various companies or applications through mergers and<br />
E7
<strong>Halifax</strong> <strong>Regional</strong> <strong>Municipality</strong><br />
2010/11 Business Plans and Budget (Proposed) Business Planning & Information Management<br />
acquisitions, or in fact companies that simply fail. HRM may need to adjust plans for specific<br />
products on relatively short notice to ensure a supportable technical environment remains in<br />
place throughout these changes. Should a major system be impacted, resources may need to be<br />
reallocated to mitigate these risks. HRM's investment in Microsoft desktop software is viewed<br />
as a strategy to mitigate some of this risk through adoption of software solutions with a critical<br />
mass of worldwide usage, provided by a large and stable provider.<br />
• Challenge – Corporate Understanding and Buy-in to the Corporate Planning Framework<br />
and Priority Setting Processes – Delivery of the Corporate Plan is the first step in ensuring<br />
that all HRM Business Unit efforts are aligned with the overall corporate direction.<br />
Introduction of a 3 Year Operations Plan presents as much challenge as opportunity; Business<br />
Units must now look further into the future in planning the deliverables outlined in the<br />
Corporate Plan while ensuring the plans are consistent with projected financial capacity. In<br />
addition, creating awareness and ultimate ownership by SMT of the Community Outcomes is<br />
critical to ensuring sufficient priority and resources are assigned in the areas necessary to<br />
advancing the goals of the community.<br />
• Challenge: Developing a new ICT Culture - The realignment of the BPIM organizational<br />
structure over this next year is one of two significant components necessary to substantially<br />
improve the delivery of ICT services to the organization, <strong>Regional</strong> Council, and the public. The<br />
goal of the new organization is to be the “Service Provider of Choice” for HRM. To achieve<br />
this goal, the development of a new, unified culture among ICT staff and management is<br />
required to support the proposed realigned structure. This “cultural realignment” will involve<br />
the articulation and adoption of a clear “civil service” culture, full, meaningful and on-going<br />
engagement of staff in all aspects of the ICT business, the development and adoption of<br />
industry best practises, the development and communication of policies, standards and<br />
procedures, the development of a true appreciation and understanding of business unit needs,<br />
and the ability to quantify value for the client. The cultural transformation required will lead to<br />
a new, unified identity. It means a breaking down of silo-like thinking and actions among<br />
BPIM ICT staff and management, a focus on problem solving and solution seeking, a focus on<br />
creativity and agility, real accountability and a commitment to continuous improvement. This<br />
cultural transformation will not happen instantaneously. It will take the commitment of all and<br />
will be an on-going process for the new organization.<br />
• Opportunity: Promotion of new ICT Organization and Processes - The Information,<br />
Communication, and Technology (ICT) governance structure was developed in 2008/09 to<br />
improve the decision making ability of the organization with respect to ICT projects. In two<br />
years, the committee has fundamentally changed the way in which information, communication<br />
and technology investments are made in the organization. Building on the success of the<br />
committee and its process, the BPIM organization is undertaking a major realignment of its<br />
delivery structure to better support and align with the overall ICT process. With the newly<br />
realigned structure and focus on the development of ICT processes, procedures, and standards,<br />
the next phase for success is set in motion for efficient and effective planning, delivery, and<br />
operation of those technologies approved by ICT. Over the next year, BPIM has an opportunity<br />
to promote and educate the organization to the new way it will operate and how that translates<br />
E8
<strong>Halifax</strong> <strong>Regional</strong> <strong>Municipality</strong><br />
2010/11 Business Plans and Budget (Proposed) Business Planning & Information Management<br />
into improved service for business units, <strong>Regional</strong> Council and the public. An opportunity<br />
exists for the HRM organization as a whole to examine, and perhaps replicate, some of the<br />
transformational changes being made in the BPIM ICT organization.<br />
Business Unit Goals<br />
The goals for Business Planning & Information Management are:<br />
Goal 1: Increase Level of Employee Engagement in BPIM<br />
Goal 2: Continue to Implement Information, Communication, and Technology (ICT) Processes<br />
and Changes to the BPIM Organization<br />
Goal 3: Develop ICT Policies and Standards<br />
Goal 4: Enhance the Corporate Planning and Reporting Framework<br />
Goal 5: Conduct Continuous Service Reviews<br />
Goal 6: Deliver New Capability to HRM Business Units<br />
Goal 7: Support Corporate Asset Management<br />
Goal 8: Improve Electronic Document Management<br />
Goal 9 Complete the Harbour Solutions Project<br />
Goal 10: Increase Privacy Awareness in HRM<br />
Goal 11: Enhance the Capacity and Service Quality of Citizen-Facing Services<br />
Goal 12: Meet Internal Service Expectations<br />
Goal 1:<br />
Increase Level of Employee Engagement in BPIM<br />
Corporate Strategy Linkage:<br />
EMT Priority: Employer of Choice<br />
Description:<br />
HRM is committed to increasing the level of employee engagement in the organization. An<br />
engaged employee can be defined as an employee that is committed to personal growth and the<br />
growth of the organization, and acts accordingly. As well, an engaged employee commits time and<br />
effort to help the organization succeed. The results of an employee survey have suggested that there<br />
is room for improvement within the Business Planning and Information Management business unit.<br />
Goal 1:<br />
Increase Level of Employee Engagement in BPIM<br />
Objectives for 2010/2011:<br />
BPIM 1.1<br />
BPIM 1.2<br />
BPIM 1.3<br />
Prepare an Action Plan based on Quality of Work Life interview results and<br />
Division discussions<br />
Implement the plan to improve employee engagement<br />
Continue to harmonize realignment activities with employee engagement<br />
activities<br />
E9
<strong>Halifax</strong> <strong>Regional</strong> <strong>Municipality</strong><br />
2010/11 Business Plans and Budget (Proposed) Business Planning & Information Management<br />
BPIM 1.4<br />
BPIM 1.5<br />
Conduct audit of workplace assessment recommendations for Customer Care<br />
team<br />
Continue developing Succession Plans for key BPIM positions<br />
Objectives for the next 3-5 years:<br />
BPIM 1.6<br />
Continue to implement employee engagement action plans<br />
Goal 2:<br />
Continue to Implement Information, Communication, and<br />
Technology (ICT) Processes and Changes to the BPIM<br />
Organization<br />
Corporate Strategy Linkage:<br />
Council Focus Area: Governance & Communication<br />
Description:<br />
Successful public sector organizations understand the benefits of information and technology and<br />
use this knowledge to derive value for their organizations. They recognize the critical dependence<br />
of many business processes on information management / information technology (IM/IT) as well<br />
as the need to comply with increasing regulatory demands. To aid organizations in successfully<br />
meeting business challenges, best practices have been established for the governance and delivery<br />
of IM/IT services. HRM is developing and refining a best practice-based end-to-end business<br />
approach for ICT through a new Information, Communication, and Technology (ICT) governance<br />
structure. Practices developed through ICT, such as the discipline of project portfolio management,<br />
will reduce the risk that misaligned or low priority initiatives consume critical HRM resources.<br />
Goal 2:<br />
Continue to Implement Information, Communication,<br />
and Technology (ICT) Processes and Changes to the<br />
BPIM Organization<br />
Objectives for 2010/2011:<br />
BPIM 2.1 Develop and implement ICT processes regarding project prioritization, project<br />
management and benefits realization.<br />
BPIM 2.2 Implement approved organizational realignment activities<br />
BPIM 2.3<br />
BPIM 2.4<br />
BPIM 2.5<br />
BPIM 2.6<br />
Actively engage staff in the development of new processes in support of the new<br />
organization.<br />
Rationalize project funding for the Business Tools asset class.<br />
Establish prioritization process for the work of the new ICT organization.<br />
Commence development of ICT Strategic Plan which will include overall ICT<br />
architecture.<br />
E10
<strong>Halifax</strong> <strong>Regional</strong> <strong>Municipality</strong><br />
2010/11 Business Plans and Budget (Proposed) Business Planning & Information Management<br />
BPIM 2.7 Establish new physical space(s) to support the operation of the new BPIM<br />
organization<br />
Objectives for the next 3-5 years:<br />
BPIM 2.8<br />
BPIM 2.9<br />
BPIM 2.10<br />
Engage expertise to aid the BU extended management team in developing<br />
capacity planning skills<br />
Establish and implement methods/ procedures/ processes for resource capacity<br />
planning<br />
Conduct Alternate Service Delivery evaluations of key service areas<br />
Goal 3:<br />
Develop ICT Policies and Standards<br />
Corporate Strategy Linkage:<br />
EMT Priority: Employer of Choice<br />
Description:<br />
Policies and standards are critical to guiding our actions, decisions and behaviours. A priority for<br />
the new BPIM organization is to identify, develop, implement, and enforce policies and standards<br />
regarding all information, communication, and technology (ICT) activities and responsibilities. This<br />
will provide the organization with clear direction regarding all aspects of ICT operations and<br />
directions and help manage expectations and behaviours. These policies and standards will be<br />
documented, approved through the appropriate channels and communicated in a concise and<br />
effective manner. The desired end state is one where the organization as a whole will know, support<br />
and follow adopted ICT policies, procedures and standards.<br />
.<br />
Goal 3:<br />
Develop ICT Policies and Standards<br />
Objectives for 2010/2011:<br />
BPIM 3.1<br />
BPIM 3.2<br />
BPIM 3.3<br />
BPIM 3.4<br />
BPIM 3.5<br />
Develop a best practice policy for managing all telephony / mobile<br />
communication devices<br />
Develop a best practice policy for managing and supporting all computer<br />
hardware<br />
Complete the Asset Naming policy as directed by Council<br />
Research and develop an Open Data policy for Council consideration<br />
Develop a best practice policy for e-mail management<br />
BPIM 3.6 Identify and prioritize the development of policies and service standards required<br />
to support the new ICT organization<br />
Objectives for the next 3-5 years:<br />
BPIM 3.4<br />
Develop an Enterprise Architecture<br />
E11
<strong>Halifax</strong> <strong>Regional</strong> <strong>Municipality</strong><br />
2010/11 Business Plans and Budget (Proposed) Business Planning & Information Management<br />
Goal 4:<br />
Enhance the Corporate Planning and Reporting Framework<br />
Corporate Strategy Linkage:<br />
Council Focus Area: Governance & Communication<br />
EMT Priority: Excellence in Service Delivery; Fiscal Responsibility<br />
Description:<br />
To ensure that HRM Councillors and employees have the best available information upon which to<br />
base decisions, HRM has undertaken a multi-phase effort to develop community, corporate and<br />
operational performance reporting. For 2010/11, the objective is to refine the corporate and<br />
community performance indicators to reflect the requirements of the Executive Management Team<br />
(EMT), and to work with business units to assist them in developing performance measures to<br />
support operational efforts and establishing service standards where none currently exist.<br />
Goal 4:<br />
Enhance the Corporate Planning and Reporting<br />
Framework<br />
Objectives for 2010/2011:<br />
BPIM 4.1 Operationalize corporate performance reporting within the Senior Management<br />
Team<br />
BPIM 4.2 Finish development of, and consult with Council on, the Community/Quality of<br />
Life Performance Reporting Framework<br />
BPIM 4.3 Accurately reflect Council priorities in the corporate and annual business plan<br />
and ensure budget alignment<br />
BPIM 4.4 Coordinate a mid-year review with Council to kick off business planning season<br />
that includes Council Focus Area updates, Community Outcome plans,<br />
Performance Measurement reporting, and Service Review recommendations<br />
BPIM 4.5 Engage Senior Management Team in the development and refinement of<br />
Community Outcome plans<br />
BPIM 4.6 Produce a Corporate Plan including a more detailed multi-year operating, capital<br />
and reserve budget model with Council<br />
Objectives for the next 3-5 years:<br />
BPIM 4.7 Continue to refine the Performance Reporting Framework to enable effective<br />
measures at all levels.<br />
BPIM 4.8 Undertake next citizen survey in 2012, incorporating lessons learned from 2010<br />
BPIM 4.9<br />
Review the potential merits of moving toward a multi-year budget approval<br />
process<br />
E12
<strong>Halifax</strong> <strong>Regional</strong> <strong>Municipality</strong><br />
2010/11 Business Plans and Budget (Proposed) Business Planning & Information Management<br />
Goal 5:<br />
Conduct Continuous Service Reviews<br />
Corporate Strategy Linkage:<br />
EMT Priority: Excellence in Service Delivery<br />
Description:<br />
To further support corporate planning and decision making, a formal process to review HRM<br />
Services has been developed and adopted by council. This process ensures that staff and Council are<br />
engaged at the appropriate level to maximize effective decision making with a focus on financial<br />
efficiency and service innovation.<br />
Goal 5:<br />
Conduct Continuous Service Reviews<br />
Objectives for 2010/2011:<br />
BPIM 5.1<br />
BPIM 5.2<br />
BPIM 5.3<br />
BPIM 5.4<br />
BPIM 5.5<br />
BPIM 5.6<br />
BPIM 5.7<br />
Conduct ongoing service reviews to identify resource capacity and opportunities<br />
for operational efficiencies.<br />
Provide Service Review reports to Council regarding Water Quality Monitoring,<br />
Cemeteries, Publications, and Visitor Information Centers<br />
Facilitate Service Review of Recreation Programs<br />
Facilitate Council’s next Service Review priorities.<br />
Inventory existing external service standards and identify gaps<br />
Where service standards exist, continue to report on performance such that all<br />
HRM services are encouraged achieve a minimum performance level of 88%.<br />
Identify ‘mandated’ services within the service catalogue<br />
Objectives for the next 3-5 years:<br />
BPIM 5.8<br />
BPIM 5.9<br />
Refine the service review process to maximize on long term benefits<br />
Expand on the service catalogue, consistent with Municipal Reference Model<br />
best practices, to better enable decision making around service delivery and<br />
budget allocation.<br />
Goal 6:<br />
Deliver New Capability to HRM Business Units<br />
Corporate Strategy Linkage:<br />
EMT Priority: Excellence in Service Delivery; Fiscal Responsibility<br />
Description:<br />
New capability information and technology projects are identified, approved, and prioritized<br />
through the ICT process. In 2010/11, new capability projects will be implemented which address<br />
goals and objectives around asset management, security, staff productivity and efficiency, improved<br />
customer service, improved information management, transparency, and accountability. The<br />
E13
<strong>Halifax</strong> <strong>Regional</strong> <strong>Municipality</strong><br />
2010/11 Business Plans and Budget (Proposed) Business Planning & Information Management<br />
following represents the work plan for delivery of new capability projects in 2010/11 based on the<br />
ICT Plan of Record.<br />
Goal 6:<br />
Deliver New Capability to HRM Business Units<br />
Objectives for 2010/2011:<br />
BPIM 6.1<br />
BPIM 6.2<br />
Initiate ICT projects based on approval and prioritization by the ICT Committee,<br />
reflective of staff resources and including but not limited to:<br />
• Transit Scheduling Upgrades (ICT0841)<br />
• Electronic Summary Offence Tickets (ICT0795)<br />
• Corporate Customer Database<br />
• Council Chamber Upgrades Phase 2 – Video and Audio Streaming<br />
• HR Training and Events (ICT0740)<br />
• Streets and Services Permits (ICT0842)<br />
• Security Management – Badges (ICT0818)<br />
Provide all HRM computer users with a modern set of office productivity tools<br />
Goal 7:<br />
Support Corporate Asset Management<br />
Corporate Strategy Linkage:<br />
Council Focus Area: Infrastructure<br />
Description:<br />
Asset management is a priority identified under <strong>Regional</strong> Council’s Infrastructure Focus Area. The<br />
foundation for any level of asset management is proper information and data management. BPIM<br />
will support Corporate Asset Management by collecting and managing core asset data sets (asset<br />
inventory) and guiding the organization in the collection and maintenance of operational asset data<br />
(operation, maintenance, performance, cost and value). Operational and strategic asset management<br />
is hindered at present by the absence of complete and accurate data to support this activity. BPIM<br />
also will support business units in the identification, review, and selection of technology tools to<br />
support both operational and strategic levels of asset management.<br />
Goal 7:<br />
Support Corporate Asset Management<br />
Objectives for 2010/2011:<br />
BPIM 7.1 Deliver ICT-approved asset management projects:<br />
• Non-Inventoried Asset Management Pilot<br />
• Fleet Maintenance Management<br />
• Asset Data project<br />
• Pavement, Sidewalk, Curb Asset Management (replacing Road Analytics)<br />
E14
<strong>Halifax</strong> <strong>Regional</strong> <strong>Municipality</strong><br />
2010/11 Business Plans and Budget (Proposed) Business Planning & Information Management<br />
BPIM 7.2 Define and initiate delivery of data and tools required to support operational asset<br />
management<br />
Objectives for the next 3-5 years:<br />
BPIM 7.3<br />
Define and deliver data, application, and infrastructure architecture required to<br />
support operational and strategic asset management<br />
Goal 8:<br />
Implement Electronic Document Management<br />
Corporate Strategy Linkage:<br />
EMT Priority: Excellence in Service Delivery<br />
Description:<br />
BPIM is focusing on improved management of corporate documents and records. In support of this<br />
objective, a corporate electronic document management system (Opentext) has been purchased and<br />
is being implemented in a phased manner across the organization. The goal is to create a single,<br />
central repository for HRM electronic documents which is searchable and easy for all users.<br />
Priority will be given to proper management of active records at the time of their creation. This will<br />
improve overall records management in the organization and ensure records of enduring value are<br />
preserved for permanent storage and preservation in the Municipal Archives<br />
Goal 8:<br />
Implement Electronic Document Management<br />
Objectives for 2010/2011:<br />
BPIM 8.1 Completion of following Opentext projects:<br />
a) Paperless Council Chamber project – complete May 2010<br />
b) Infrastructure Project - implementation of a sustainable infrastructure<br />
foundation and version upgrade from v9.6 to 9.7.1.<br />
c) Legal Services - Document Management (DM) and possibly Case File<br />
Management as part of legislative requirement regarding electronic<br />
disclosure<br />
d) IRM Records Center - deployment of Physical Objects Module to<br />
computerize the management of semi-active records housed in the centre<br />
BPIM 8.2 Complete Opentext document management assessment and deployment strategy<br />
for HRP By-law Enforcement and Major Crimes divisions<br />
BPIM 8.3 Complete Opentext document management assessment to identify document<br />
management needs associated with Asset Management (i.e. opportunity to<br />
replace EDL [Electronic Drawings Library] with Opentext, asset photo<br />
management, etc)<br />
E15
<strong>Halifax</strong> <strong>Regional</strong> <strong>Municipality</strong><br />
2010/11 Business Plans and Budget (Proposed) Business Planning & Information Management<br />
BPIM 8.4 Commence establishment of Enterprise Information Management (EIM)<br />
Program and initiate the following activities in support of it:<br />
a) Governance Framework- planning & project prioritization, project<br />
registration process, and services and support model<br />
b) Security Framework<br />
c) Project Deployment Roadmap<br />
d) Records Management (RM) Framework - RM classification model, RM<br />
standards, policies and guidelines, RM training and communication,<br />
e) Change Management Strategy<br />
Objectives for the next 3-5 years:<br />
BPIM 8.9 Complete establishment of EIM program<br />
BPIM 8.10<br />
Deploy Opentext system in accordance with Project Deployment Road Map<br />
Goal 9:<br />
Complete the Harbour Solutions Project<br />
Corporate Strategy Linkage:<br />
Council Focus Area: Infrastructure<br />
Description:<br />
Construction of the Harbour Solutions Project is complete. Activities in 2010/11 will focus on<br />
completing the commissioning processes for the Herring Cove and Dartmouth Wastewater<br />
Treatment Facilities (WWTF), returning the <strong>Halifax</strong> WWTF to full operation, contract management<br />
to remedy all deficiencies and/or make HRM whole, and transfer the Project to <strong>Halifax</strong> Water if<br />
approved by <strong>Regional</strong> Council.<br />
Goal 9:<br />
Complete the Harbour Solutions Project<br />
Objectives for 2010/2011:<br />
BPIM 9.1 Transfer project to <strong>Halifax</strong> Water<br />
BPIM 9.2<br />
BPIM 9.3<br />
BPIM 9.4<br />
BPIM 9.5<br />
Recover <strong>Halifax</strong> Plant and substantially complete remaining components of the<br />
collection system<br />
Substantially complete Dartmouth treatment facility and collection system<br />
Substantially complete Herring Cove treatment facility and collection system<br />
Continue to remedy all project deficiencies and/or make HRM whole<br />
E16
<strong>Halifax</strong> <strong>Regional</strong> <strong>Municipality</strong><br />
2010/11 Business Plans and Budget (Proposed) Business Planning & Information Management<br />
Goal 10:<br />
Increase Privacy Awareness in HRM<br />
Corporate Strategy Linkage:<br />
EMT Priority: Excellence in Service Delivery, Governance & Communication<br />
Description:<br />
To support HRM’s compliance efforts with the Municipal Government Act, Freedom of<br />
Information & Protection of Privacy Act (FOIPOP), and the Personal Information International<br />
Disclosure Protection Act (PIIDPA), an access and privacy awareness and educational program will<br />
be implemented in 20010/11. The goal of the program will be to provide staff and elected officials<br />
with an understanding of the requirement for protecting personal information and HRM’s<br />
obligations under existing privacy legislation. Staff will be provided with information on the<br />
collection, use and disclosure of personal information as well as practical guidance and tools for<br />
successfully addressing privacy requirements. Existing policies and procedures impacting privacy<br />
will be updated and new policies developed, as appropriate, to ensure ongoing compliance.<br />
Goal 10:<br />
Increase Privacy Awareness in HRM<br />
Objectives for 2010/2011:<br />
BPIM 10.1 Develop HRM Privacy Policy, including revamping the Internet Privacy Policy<br />
BPIM 10.2<br />
BPIM 10.3<br />
BPIM 10.4<br />
Develop and deliver appropriate access and privacy education, training, and<br />
promotional programs and services<br />
Develop and deliver the Privacy Impact Assessment (PIA) process<br />
Process access applications in compliance with legislative requirements<br />
BPIM 10.5 Assist Corporate Security in the Development of a closed circuit television<br />
(CCTV) policy<br />
Objectives for the next 3-5 years:<br />
BPIM.10.6<br />
BPIM 10.7<br />
BPIM 10.8<br />
Audit of HRM forms for privacy compliance<br />
Develop a Routine Access Policy<br />
Produce a Directory of Personal Information Banks for HRM<br />
BPIM 10.9 Review of all current HRM policies and procedures to ensure legislative<br />
compliance<br />
BPIM 10.10 Develop Privacy and Access components of the Information Security<br />
Architecture for HRM<br />
E17
<strong>Halifax</strong> <strong>Regional</strong> <strong>Municipality</strong><br />
2010/11 Business Plans and Budget (Proposed) Business Planning & Information Management<br />
Goal 11:<br />
Enhance the Capacity and Service Quality of Citizen-Facing<br />
Services<br />
Corporate Strategy Linkage:<br />
EMT Priority: Excellence in Service Delivery<br />
Description:<br />
HRM's Corporate Call Centre is the main point of contact for citizens to reach the <strong>Municipality</strong>. To<br />
improve service delivery and value added access for citizens, staff will be examining the quality of<br />
service, reviewing call types and their associated business processes, and recommending ways to<br />
increase call centre capacity. A go forward strategy to accommodate future years' anticipated call<br />
growth will be created that recommends improvements to the service and makes the best use of<br />
technology so that new business opportunities can be considered.<br />
The HRM Customer Service Centres are the primary walk in point for citizens to conduct<br />
Municipal transactions. A review will be undertaken, to ensure service delivery is meeting the<br />
requirements of citizens. The review will examine quality of service and current service delivery<br />
methodologies. The review will also entail a strategy to accommodate the future growth expected in<br />
web based financial transactions. Recommended improvements to service delivery encompassing<br />
best practice benchmarks in customer service delivery models will be considered.<br />
Goal 11:<br />
Enhance the Capacity and Service Quality of Citizen-<br />
Facing Services<br />
Objectives for 2010/2011:<br />
BPIM 11.1 Identify and recommend potential service delivery enhancements (i.e.<br />
Knowledge tool) or ways to deflect non value added work from Call Centre call<br />
volume (i.e., IVR, call routing, queue shifting, etc) in order to maintain 80/25<br />
response standard without additional resources<br />
BPIM 11.2 Evaluate the merits of moving toward a 311 (and potentially 211) call centre with<br />
<strong>Regional</strong> Council.<br />
BPIM 11.3 Complete strategic review of Customer Service Centres and Licensing<br />
administration.<br />
BPIM 11.4 Implement Council’s service review direction for Visitor Information Centres<br />
(VICs) and Customer Service Centres (CSCs).<br />
Objectives for the next 3-5 years:<br />
BPIM 11.5<br />
Continue to leverage business transformation opportunities through enhanced use<br />
of the web.<br />
E18
<strong>Halifax</strong> <strong>Regional</strong> <strong>Municipality</strong><br />
2010/11 Business Plans and Budget (Proposed) Business Planning & Information Management<br />
Goal 12:<br />
Meet Internal Service Expectations<br />
Corporate Strategy Linkage:<br />
EMT Priority: Excellence in Service Delivery<br />
Description:<br />
BPIM is committed to meeting the Internal Service Expectations agreed upon with other HRM<br />
business units. Responses to specific requests have been provided to individual business units.<br />
Goal 12:<br />
Meet Internal Service Expectations<br />
Objectives for 2010/2011:<br />
BPIM 12.1 Support IAM with identifying and implementing ICT requirements for corporate<br />
office moves:<br />
• West End Mall (anticipated August 2010)<br />
• Alderney Gate (anticipated December 2010)<br />
• Duke Tower 3 rd Floor (anticipated December 2010)<br />
• Duke Tower 4 th Floor (anticipated March 2011)<br />
• Dartmouth Ferry Terminal (anticipated November 2010)<br />
• Fire Prevention to Mellor Avenue (anticipated May 2010)<br />
• Emergency Operations Centre Renovations – Eric Spicer (anticipated<br />
May 2010)<br />
BPIM 12.2 Support CAO (Marketing & Design Division) in transition to new version of<br />
Desktop Printshop<br />
BPIM 12.3 Provide GIS and Civic Addressing support to CAO (Clerk’s Office) to analyze,<br />
draft and map boundary revisions.<br />
BPIM 12.4 Provide IT Consultants to support business units with initial assessments and<br />
prioritization of their ICT needs. When appropriate, the IT Consultant will guide<br />
and support business units through the ICT governance process. For work that<br />
falls below the ICT governance threshold, the IT Consultant will liaise with other<br />
BPIM resources to get work scheduled.<br />
BPIM 12.5 Supply Value-in-Kind (VIK) pre-games Blackberry and cellular hardware and<br />
airtime for Canada Games staff as agreed-upon through internal service<br />
documentation.<br />
BPIM 12.6 Supply approximately 150 games-time cellular phones and airtime for Canada<br />
Games volunteers as agreed-upon through internal service documentation.<br />
BPIM 12.7 Provide loan of approximately 310 computers for Canada Games as agreed-upon<br />
through internal service documentation.<br />
BPIM 12.8 Assist HR with identifying access rights to various systems for specified<br />
positions in support of the Security Clearance Project.<br />
Objectives for the next 3-5 years:<br />
BPIM 12.9<br />
Work with HR to implement the Workforce Planning initiative<br />
E19
<strong>Halifax</strong> <strong>Regional</strong> <strong>Municipality</strong><br />
2010/11 Business Plans and Budget (Proposed) Business Planning & Information Management<br />
Increases In Services / New Initiatives:<br />
Service Level Changes<br />
• Expansion of fibre optic network to Ragged Lake Transit Facility<br />
• Provision of electronic Council packages to <strong>Regional</strong> Council and staff<br />
• Community / Quality of Life (QOL) Performance Framework<br />
• Mobility, Hardware, and E-mail management policies<br />
• Commemorative Naming Policy<br />
• Open Data approach<br />
• Privacy and Access education program<br />
• Publicly available video streaming of regional council meetings<br />
• Live internal audio streaming of Council meetings<br />
• New office productivity software<br />
• New Transit Scheduling System<br />
• Electronic Summary Offense Tickets<br />
• Employee Security Management system<br />
• PSAB Compliant Asset Accounting system<br />
• Full Operation of <strong>Halifax</strong> Wastewater Treatment Facility<br />
Decreases In Services / Operational Pressures (OP):<br />
• OP - Performance against FOIPOP Application standards is expected to continue to decline<br />
due to increases in the volume and complexity of applications<br />
• OP - Call Centre Grade of Service expected to decline due to growth in calls without<br />
additional resources or change in service approach<br />
• OP - Information, Communication, Technology resources insufficient to meet demands of<br />
Business Units. Customer Care service will suffer performance drop due to roll out of<br />
desktop software combined with numerous corporate accommodation changes.<br />
Expected Services Not Being Delivered:<br />
• Close Visitor Information Centres at Scotia Square, Argyle Street, Cruise Terminal,<br />
Dartmouth, and Bedford<br />
• Close Cole Harbour Place Customer Service Centre effective July 31, 2010<br />
• Close HRM Call Centre on all holidays (Christmas Day, Boxing Day, New Years Day, Good<br />
Friday, Easter Monday, Victoria Day, Canada Day, Natal Day, Labour Day, Remembrance<br />
Day, Thanksgiving Day)<br />
E20
Business Planning & Information Management<br />
Summary of Gross Expenditures by Division<br />
2008-2009 2009-2010 2009-2010 2010-2011 Change over<br />
Actual Budget Projections Budget Budget Var as %<br />
Commonwealth Games<br />
M636 VIK - Special Events 19,700 0 145,000 0 0 -<br />
19,700 0 145,000 0 0 -<br />
Director of Business Plan. & In<br />
A610 Dir.of Business Plan 773,665 745,391 923,305 811,057 65,666 8.8<br />
E125 ICT Transformation 14,240 104,620 138,000 104,762 142 0.1<br />
807,605 850,011 1,206,305 915,819 65,808 7.7<br />
Data Knowledge Management<br />
A642 Administration - DKM 246,970 315,175 335,228 497,141 181,966 57.7<br />
246,970 315,175 335,228 497,141 181,966 57.7<br />
Information Resource Management<br />
A122 Info Resource Mgmt 528,909 580,608 606,692 608,118 27,510 4.7<br />
528,909 580,608 606,692 608,118 27,510 4.7<br />
Geographic Information Services<br />
A635 GIS 478,701 499,062 472,376 612,482 113,420 22.7<br />
478,701 499,062 472,376 612,482 113,420 22.7<br />
Data Management<br />
A645 Data Management Group 565,564 617,400 635,364 817,285 199,885 32.4<br />
C330 Civic Addressing 370,091 430,436 411,553 303,582 (126,854) (29.5)<br />
935,655 1,047,836 1,046,917 1,120,867 73,031 7.0<br />
Data/Knowledge Management 2,190,236 2,442,681 2,461,213 2,838,608 395,927 16.2<br />
Information Technology<br />
A410 Administration - IT 3,584,984 2,215,663 1,258,113 2,010,283 (205,380) (9.3)<br />
3,584,984 2,215,663 1,258,113 2,010,283 (205,380) (9.3)<br />
Technology Intrastructure<br />
A440 Technology Infrastructure 4,292,343 4,474,100 4,478,000 4,577,768 103,668 2.3<br />
4,292,343 4,474,100 4,478,000 4,577,768 103,668 2.3<br />
Customer Care<br />
A420 Customer Care 1,353,560 1,263,490 1,326,088 1,401,255 137,765 10.9<br />
A421 Telecommunications 1,167,537 1,012,035 1,012,035 1,010,490 (1,545) (0.2)<br />
2,521,097 2,275,525 2,338,123 2,411,745 136,220 6.0<br />
Business Solutions<br />
A430 Business Solutions 1,557,672 1,860,372 1,825,377 1,906,196 45,824 2.5<br />
1,557,672 1,860,372 1,825,377 1,906,196 45,824 2.5<br />
Project Management<br />
A435 IT Professional Services 914,084 1,197,121 1,052,121 1,192,048 (5,073) (0.4)<br />
A438 IT CAPITAL 1,315 0 0 0 0<br />
915,400 1,197,121 1,052,121 1,192,048 (5,073) (0.4)<br />
Information Technology 12,871,496 12,022,781 10,951,734 12,098,040 75,259 0.6<br />
Client Services<br />
A461 Client Services 169,336 164,330 148,650 188,163 23,833 14.5<br />
169,336 164,330 148,650 188,163 23,833 14.5<br />
Customer Service Centres<br />
A661 Admin. & Storefont 366,958 367,735 302,085 380,854 13,119 3.6<br />
A663 Alderney Gate 94,628 102,880 101,955 108,630 5,750 5.6<br />
A664 West End Mall 100,616 103,276 102,651 108,698 5,422 5.3<br />
A665 Scotia Square 150,900 153,598 152,687 162,820 9,222 6.0<br />
A666 Cole Harbour Place 106,439 103,880 102,405 101,936 (1,944) (1.9)<br />
A667 Acadia Centre 96,325 103,576 103,576 110,811 7,235 7.0<br />
A668 Musquodoboit Harbour 19,100 20,000 19,100 20,000 0<br />
934,966 954,945 884,459 993,749 38,804 4.1<br />
Dispatch Services/Call Centre<br />
A625 Corporate Call Centre 1,800,614 1,875,738 1,860,838 1,917,299 41,561 2.2<br />
1,800,614 1,875,738 1,860,838 1,917,299 41,561 2.2<br />
E-Access & Services<br />
A681 E-Access & Services 510,528 593,956 491,396 616,056 22,100 3.7<br />
510,528 593,956 491,396 616,056 22,100 3.7<br />
Visitor Services<br />
C740 Visitor S. Staff Sup 481,955 545,176 489,906 310,361 (234,815) (43.1)<br />
C799 Visitor Serv-Clearin 26,870<br />
508,825 545,176 489,906 310,361 (234,815) (43.1)<br />
E21
Business Planning & Information Management<br />
Summary of Gross Expenditures by Division (continued)<br />
2008-2009 2009-2010 2009-2010 2010-2011 Change over<br />
Actual Budget Projections Budget Budget Var as %<br />
Client Services 3,924,268 4,134,145 3,875,249 4,025,628 (108,517) (2.6)<br />
Harbour Solutions Project<br />
R381 Harbour Solutions Project 819 (100) (100) (13,400) (13,300) 13,300.0<br />
819 (100) (100) (13,400) (13,300) 13,300.0<br />
Hurricane Juan<br />
A437 Block Land Info Syst (3,180) 0 0 0 0 -<br />
C745 Locked InternVC-Ops 68 0 0 0 0 -<br />
(3,112) 0 0 0 0 -<br />
Total $19,791,312 $19,449,518 $18,494,401 $19,864,695 $415,177 2.1<br />
E22
Business Planning & Information Management<br />
Summary of Gross Revenue by Division<br />
2008-2009 2009-2010 2009-2010 2010-2011 Change over<br />
Actual Budget Projections Budget Budget Var as %<br />
Director of Business Plan. & In<br />
A610 Dir.of Business Plan (39,839) 0 (90,000) 0 0 -<br />
(39,839) 0 (90,000) 0 0 -<br />
Data Knowledge Management<br />
A642 Administration - DKM 0 0 (118) 0 0 -<br />
0 0 (118) 0 0 -<br />
Information Resource Management<br />
A122 Info Resource Mgmt (35,808) (700) (27,614) (700) 0 -<br />
(35,808) (700) (27,614) (700) 0 -<br />
Geographic Information Services<br />
A635 GIS (32,066) (3,000) (1,250) (3,000) 0 -<br />
(32,066) (3,000) (1,250) (3,000) 0 -<br />
Data Management<br />
A645 Data Management Group (5,811) 0 0 0 0 -<br />
C330 Civic Addressing (119,438) (92,000) (119,532) (106,700) (14,700) 16.0<br />
(125,249) (92,000) (119,532) (106,700) (14,700) 16.0<br />
Data/Knowledge Management (193,122) (95,700) (148,514) (110,400) (14,700) 15.4<br />
Technology Intrastructure<br />
A440 Technology Infrastructure (133,317) 0 (133,269) (133,600) (133,600) -<br />
(133,317) 0 (133,269) (133,600) (133,600) -<br />
Customer Care<br />
A420 Customer Care (2,646) 0 0 0 -<br />
A421 Telecommunications 0 0 (6,000) 0 0 -<br />
(2,646) 0 (6,000) 0 0 -<br />
Information Technology (135,963) 0 (139,269) (133,600) (133,600) -<br />
Customer Service Centres<br />
A661 Admin. & Storefont (347,947) (280,000) (275,500) (280,000) 0 -<br />
(347,947) (280,000) (275,500) (280,000) 0 -<br />
Dispatch Services/Call Centre<br />
A625 Corporate Call Centre (409) 0 0 0 0 -<br />
(409) 0 0 0 0 -<br />
E-Access & Services<br />
A681 E-Access & Services (186) 0 0 0 0 -<br />
(186) 0 0 0 0 -<br />
Visitor Services<br />
C740 Visitor S. Staff Sup (110,536) (60,000) (57,342) (60,000) 0 -<br />
(110,536) (60,000) (57,342) (60,000) 0 -<br />
Client Services (459,078) (340,000) (332,842) (340,000) 0 -<br />
Harbour Solutions Project<br />
R381 Harbour Solutions Project 0 0 0 6,400 6,400 -<br />
0 0 0 6,400 6,400 -<br />
Total (828,002) (435,700) (710,625) (577,600) (141,900) 32.6<br />
E23
Business Planning & Information Management<br />
Summary of Net Expenditures by Division<br />
2008-2009 2009-2010 2009-2010 2010-2011 Change over<br />
Actual Budget Projections Budget Budget Var as %<br />
Commonwealth Games<br />
M636 VIK - Special Events 19,700 0 145,000 0 0 -<br />
19,700 0 145,000 0 0 -<br />
Director of Business Plan. & In<br />
A610 Dir.of Business Plan 733,826 745,391 833,305 811,057 65,666 8.8<br />
E125 ICT Transformation 14,240 104,620 138,000 104,762 142 0.1<br />
767,766 850,011 1,116,305 915,819 65,808 7.7<br />
Data Knowledge Management<br />
A642 Administration - DKM 246,970 315,175 335,110 497,141 181,966 57.7<br />
246,970 315,175 335,110 497,141 181,966 57.7<br />
Information Resource Management<br />
A122 Info Resource Mgmt 493,102 579,908 579,078 607,418 27,510 4.7<br />
493,102 579,908 579,078 607,418 27,510 4.7<br />
Geographic Information Services<br />
A635 GIS 446,636 496,062 471,126 609,482 113,420 22.9<br />
446,636 496,062 471,126 609,482 113,420 22.9<br />
Data Management<br />
A645 Data Management Group 559,754 617,400 635,364 817,285 199,885 32.4<br />
C330 Civic Addressing 250,653 338,436 292,021 196,882 (141,554) (41.8)<br />
810,407 955,836 927,385 1,014,167 58,331 6.1<br />
Data/Knowledge Management 1,997,114 2,346,981 2,312,699 2,728,208 381,227 16.2<br />
Information Technology<br />
A410 Administration - IT 3,584,984 2,215,663 1,258,113 2,010,283 (205,380) (9.3)<br />
3,584,984 2,215,663 1,258,113 2,010,283 (205,380) (9.3)<br />
Technology Intrastructure<br />
A440 Technology Infrastructure 4,159,026 4,474,100 4,344,731 4,444,168 (29,932) (0.7)<br />
4,159,026 4,474,100 4,344,731 4,444,168 (29,932) (0.7)<br />
Customer Care<br />
A420 Customer Care 1,350,914 1,263,490 1,326,088 1,401,255 137,765 10.9<br />
A421 Telecommunications 1,167,537 1,012,035 1,006,035 1,010,490 (1,545) (0.2)<br />
2,518,451 2,275,525 2,332,123 2,411,745 136,220 6.0<br />
Business Solutions<br />
A430 Business Solutions 1,557,672 1,860,372 1,825,377 1,906,196 45,824 2.5<br />
1,557,672 1,860,372 1,825,377 1,906,196 45,824 2.5<br />
Project Management<br />
A435 IT Professional Services 914,084 1,197,121 1,052,121 1,192,048 (5,073) (0.4)<br />
A438 IT CAPITAL 1,315 0 0 0 0 -<br />
915,400 1,197,121 1,052,121 1,192,048 (5,073) (0.4)<br />
Information Technology 12,735,532 12,022,781 10,812,465 11,964,440 (58,341) (0.5)<br />
Client Services<br />
A461 Client Services 169,336 164,330 148,650 188,163 23,833 14.5<br />
169,336 164,330 148,650 188,163 23,833 14.5<br />
Customer Service Centres<br />
A661 Admin. & Storefont 19,011 87,735 26,585 100,854 13,119 15.0<br />
A663 Alderney Gate 94,628 102,880 101,955 108,630 5,750 5.6<br />
A664 West End Mall 100,616 103,276 102,651 108,698 5,422 5.3<br />
A665 Scotia Square 150,900 153,598 152,687 162,820 9,222 6.0<br />
A666 Cole Harbour Place 106,439 103,880 102,405 101,936 (1,944) (1.9)<br />
A667 Acadia Centre 96,325 103,576 103,576 110,811 7,235 7.0<br />
A668 Musquodoboit Harbour 19,100 20,000 19,100 20,000 0 -<br />
587,018 674,945 608,959 713,749 38,804 5.7<br />
Dispatch Services/Call Centre<br />
A625 Corporate Call Centre 1,800,205 1,875,738 1,860,838 1,917,299 41,561 2.2<br />
1,800,205 1,875,738 1,860,838 1,917,299 41,561 2.2<br />
E-Access & Services<br />
A681 E-Access & Services 510,342 593,956 491,396 616,056 22,100 3.7<br />
510,342 593,956 491,396 616,056 22,100 3.7<br />
E24
Business Planning & Information Management<br />
Summary of Net Expenditures by Division (continued)<br />
2008-2009 2009-2010 2009-2010 2010-2011 Change over<br />
Actual Budget Projections Budget Budget Var as %<br />
Visitor Services<br />
C740 Visitor S. Staff Sup 371,420 485,176 432,564 250,361 (234,815) (48.4)<br />
C799 Visitor Serv-Clearin 26,870 0 0 0 0 -<br />
398,290 485,176 432,564 250,361 (234,815) (48.4)<br />
Client Services 3,465,191 3,794,145 3,542,407 3,685,628 (108,517) (2.9)<br />
Harbour Solutions Project<br />
R381 Harbour Solutions Project 819 (100) (100) (7,000) (6,900) 6,900.0<br />
819 (100) (100) (7,000) (6,900) 6,900.0<br />
Hurricane Juan<br />
A437 Block Land Info Syst (3,180) 0 0 0 0 -<br />
C745 Locked InternVC-Ops 68 0 0 0 0 -<br />
(3,112) 0 0 0 0 -<br />
Total $18,963,310 $19,013,818 $17,783,776 $19,287,095 $273,277 1.4<br />
E25
Business Planning & Information Management<br />
Summary by Expenditure & Revenue Types<br />
2008-2009 2009-2010 2009-2010 2010-2011 Change over<br />
Actual Budget Projections Budget Budget Var as %<br />
Expenditures<br />
Compensation & Benefits 10,813,380 12,029,779 11,436,833 12,674,443 644,664 5.4<br />
Office 3,663,896 3,543,081 3,777,866 4,024,600 481,519 13.6<br />
Professional Fees 150 15,300 0 15,300 0 -<br />
Legal & Consulting Fees 135,514 288,159 372,664 223,001 (65,158) (22.6)<br />
External Services 297,982 301,068 508,311 299,390 (1,678) (0.6)<br />
Uniforms & Clothing 2,815 4,600 3,700 1,100 (3,500) (76.1)<br />
Supplies & Materials 690 10,000 10,782 9,000 (1,000) (10.0)<br />
Utilities 1,457 2,300 1,600 2,300 0 -<br />
Building Costs 4,850 15,000 12,500 13,500 (1,500) (10.0)<br />
Equipment & Comm 4,043,964 3,097,391 2,455,612 2,504,583 (592,808) (19.1)<br />
Travel 125,189 116,559 115,916 101,391 (15,168) (13.0)<br />
Training & Education 136,127 213,159 203,426 209,159 (4,000) (1.9)<br />
Facilities Rental 76,586 73,900 73,900 76,200 2,300 3.1<br />
Advertising & Promotion 30,507 49,300 13,100 44,370 (4,930) (10.0)<br />
Other Goods & Services 133,476 135,119 151,625 213,232 78,113 57.8<br />
Interdepartmental (87,506) 900 (205,788) 800 (100) (11.1)<br />
Transfer Outside Agencies 55,000 30,000 5,000 0 (30,000) (100.0)<br />
Transfer to/from Reserves 357,236 (67,785) (135,649) (73,504) (5,719) 8.4<br />
Other Fiscal (408,312) (306,997) (474,170) (65,858) 16.1<br />
Expenditures 19,791,312 19,449,518 18,494,401 19,864,695 415,177 2.1<br />
Total $19,791,312 $19,449,518 $18,494,401 $19,864,695 $415,177 2.1<br />
Revenues<br />
Licenses & Permits (71,323) (51,500) (36,000) (51,500) 0 -<br />
Rental & Leasing (14,890) (10,000) (15,500) (10,000) 0 -<br />
Sales Revenue (297,653) (220,200) (227,523) (220,200) 0 -<br />
Envirnmntl Protection Levies 80 0 0 0 0 -<br />
Other Revenue (444,216) (154,000) (431,602) (295,900) (141,900) 92.1<br />
Revenues (828,002) (435,700) (710,625) (577,600) (141,900) 32.6<br />
Total (828,002) (435,700) (710,625) (577,600) (141,900) 32.6<br />
Net Cost $18,963,310 $19,013,818 $17,783,776 $19,287,095 $273,277 1.4<br />
E26
<strong>Halifax</strong> <strong>Regional</strong> <strong>Municipality</strong><br />
2010/11 Business Plans and Budget (Proposed) Community Development<br />
Community<br />
Development<br />
Business Plan - 2010/11
<strong>Halifax</strong> <strong>Regional</strong> <strong>Municipality</strong><br />
2010/11 Business Plans and Budget (Proposed) Community Development<br />
Mission:<br />
Community Development creates and implements policies, regulations and<br />
programs which are fundamental to building strong and vibrant communities<br />
through planning the region’s settlement patterns; maintaining and<br />
establishing community character; constructing safe, accessible buildings and<br />
infrastructure; and, providing diverse recreation programming, cultural<br />
choices and civic events. This is done by engaging citizens through community<br />
consultations, and partnering and networking with key stakeholders in a<br />
manner that is consistent with federal, provincial and municipal mandates.<br />
Business Unit Overview:<br />
Community Development delivers a variety of programs and support services designed to<br />
enhance the quality of life for HRM residents. Through its direct programming and service<br />
delivery, Community Development is often the “face” of the municipality within communities.<br />
With responsibility for areas such as recreation programming, community development, culture<br />
and heritage, youth advocacy, facility development, regional planning, and civic events,<br />
Community Development plays a key role in building healthy, vibrant, and sustainable<br />
communities throughout the municipality.<br />
Director<br />
Planning Services<br />
Austin French<br />
Subdivision and<br />
Land Use<br />
Sharon Bond<br />
Development<br />
Engineering<br />
Denise Schofield<br />
Permits and<br />
Inspections<br />
Jim Donovan<br />
Paul Dunphy<br />
Leads implementation of HRM’s <strong>Regional</strong> Plan by developing<br />
policies and regulations at regional and community levels to<br />
provide for orderly settlement, the establishment and maintenance<br />
of community character, and the development of safe and accessible<br />
communities, buildings and infrastructure. Processes and facilitates<br />
applications for changes to land use policy and regulations in<br />
support of development activity throughout the region, including<br />
heritage and design initiatives, development agreements, and<br />
amendments to planning strategies and by-laws.<br />
Reviews existing activity and all new development proposals for<br />
compliance with land use based regulations. This function includes<br />
acceptance of new HRM parkland and land use compliance.<br />
Reviews all development proposals for compliance with<br />
engineering and infrastructure-based regulations. This function<br />
includes acceptance of new HRM infrastructure and blasting by-law<br />
enforcement.<br />
Reviews all development proposals for compliance with Provincial<br />
Building Code Regulations including inspections to ensure<br />
compliance with approved plans (i.e. construction standards, life<br />
safety, etc). Responds to citizen requests for service under By-law<br />
M100 - Respecting Residential Occupancies, as well as the<br />
Licensing of Rooming Houses under By-law M100.<br />
F2
<strong>Halifax</strong> <strong>Regional</strong> <strong>Municipality</strong><br />
2010/11 Business Plans and Budget (Proposed) Community Development<br />
Community<br />
Recreation Services<br />
Karen MacTavish<br />
Community Relations<br />
& Cultural Affairs<br />
Andrew Whittemore<br />
Service Delivery<br />
Doug Rafuse<br />
Summary of Business<br />
Unit Structure<br />
Changes:<br />
Offers a diverse selection of direct and facilitated recreation and<br />
leisure programs and services including: community youth<br />
development; aquatics; youth leadership; physical activity<br />
initiatives; local community events; environmental education<br />
outdoor recreation; facilitation of facility lease agreements; and,<br />
community development initiatives. Coordinates bookings,<br />
scheduling and requests for outdoor parks, sports fields, arenas, and<br />
<strong>Halifax</strong> <strong>Regional</strong> School Board facilities.<br />
Focuses on empowering and organizing communities, fostering<br />
civic engagement and building community pride. Responsible for<br />
training new community and sectoral leaders and initiatives that<br />
improve community conditions. CRCA includes the newly<br />
established African Nova Scotia Office as well as dedicated<br />
resources to promoting equity, improved services, and multicultural<br />
relations with a specific focus on newcomers, Aboriginal<br />
Peoples, and disenfranchised youth (i.e. Youth Advocate Program).<br />
CRCA is responsible for fostering civic pride and cultural<br />
development through community and public art, social heritage,<br />
cultural planning, civic events, and the provision of cultural spaces<br />
and places. CRCA also administers community grants, civic event<br />
grants, cultural grants, as well as service agreements with the<br />
Business Improvement Districts, heritage and cultural<br />
organizations, and major event hosting service organizations.<br />
Provides short and long range indoor facility management strategies<br />
to allow delivery of community, recreational, sport, event and<br />
cultural programming. Provides Facility Partnership which<br />
develops, negotiates and administers management and operating<br />
agreements with facilities that support the business unit program<br />
delivery goals.<br />
• Business Unit Realignment – Business Improvement District<br />
coordination program and FTE transferred from Planning<br />
Services to Community Relations & Cultural Affairs<br />
• FTE realignment: 1 Building Official FTE transferred to TPW<br />
along with responsibility for inspection of work in the right-ofway<br />
• Discussion of realignment of roles, responsibilities and resources<br />
relative to less-than-market value leases and community group<br />
leases from TPW to Service Delivery division, as well as<br />
Facility Scheduling from Recreation to Service Delivery division<br />
• New FTE proposed - Civic Events Coordinator to administer<br />
Special Events Advisory Committee Grants Policy Framework<br />
• New FTE proposed – Community Developer to develop and lead<br />
the function of the new African Nova Scotia Office<br />
F3
<strong>Halifax</strong> <strong>Regional</strong> <strong>Municipality</strong><br />
2010/11 Business Plans and Budget (Proposed) Community Development<br />
• Community Recreation Services will reduce 2.5 FTEs as part of<br />
a staff and service delivery efficiency exercise.<br />
Core Operations and Services provided:<br />
• Direct provision to 22 community recreation centres and 5 sport facilities, which include 4<br />
ice surfaces, 2 indoor pools and several outdoor pools<br />
• Support to an additional 25 community operated, HRM-owned community recreation<br />
centres, 6 sport facilities, 4 regional multi-sport complexes and 5 event type facilities,<br />
which include 14 ice surfaces, 3 indoor pools and 2 outdoor pools<br />
• Directly operates over 8300 recreation programs in 180 locations<br />
• Permit issuance - 3897 permits were issued in 2009 for a total construction value of over<br />
$681 million<br />
• 22,407 construction compliance inspections completed in 2009<br />
• Regulatory Enforcement - 559 land use compliance complaints processed in 2009<br />
• Planning Applications - processed 135 applications in 2009, an increase of 36 from 2008<br />
• Support of more than 95 festivals and events<br />
• Provides over $3 million annually in grants and contributions<br />
• Cultural programs to retain local artistic community and newcomers in an effort to position<br />
HRM as a creative and innovative city and contribute to long-term economic development<br />
• Community art programming aimed at disengaged and at-risk youth to improve their life<br />
skills and prospects of becoming productive members of society<br />
• Leadership training, organizational capacity building, and volunteer recruitment aimed at<br />
fostering empowered and engaged citizens and overall safer communities<br />
• Expert consultation and civic engagement strategies and programs to foster positive<br />
community relations and active citizen involvement<br />
• Manages and interprets HRM owned heritage buildings and assets<br />
• In 2009, provided support to 60 film projects contributing to HRM’s long-term economic<br />
development and international reputation as a film destination<br />
• Leverages funding and partnerships with Business Improvement Districts to foster<br />
economic growth in HRM’s downtown core and suburban business districts<br />
• Policies: Municipal Planning Strategies, Land Use By-laws, Public Art Policy, Community<br />
Engagement Strategy, Major Event Hosting Strategy, Volunteer Strategy, Community<br />
Grants & Contribution, Social Heritage Strategy, Creative Spaces Strategy, Community<br />
Art Strategy and Youth Advocate Program<br />
• <strong>Regional</strong> Plan: Implementation of 21 functional plans, <strong>Regional</strong> Centre Urban Design<br />
Study (HRMbyDesign), watershed/servicing studies, and community visioning program<br />
and service boundary extensions<br />
• Coordinates bookings and manages customer service for over 30,000 park and sport field<br />
users, approximately 140 <strong>Halifax</strong> <strong>Regional</strong> School Board facilities and four arenas<br />
• Provides more than 400 youth programs, events and projects through youth action plans<br />
• Employs approximately 800 youth and trains over 1000 youth volunteers annually<br />
• Supports 27 community operated boards through the facility lease agreement program<br />
F4
<strong>Halifax</strong> <strong>Regional</strong> <strong>Municipality</strong><br />
2010/11 Business Plans and Budget (Proposed) Community Development<br />
Funded Full Time Equivalents (FTEs):<br />
Funded FTEs (includes full and<br />
part-time permanent positions)<br />
2008/09<br />
(Approved)<br />
2009/10<br />
(Approved)<br />
2010/11<br />
(Proposed)<br />
238.5 241 239.5<br />
*The FTE total for 2010/11 includes two proposed FTE’s: Civic Events Coordinator and Community Developer<br />
pending approval.<br />
Analysis of <strong>Operating</strong> Budget Changes:<br />
<strong>Operating</strong> Budget Change Details<br />
($000's)<br />
2009/10 Budget $19,620.0<br />
1 Salaries & benefits - includes cost changes resulting from merit increases, 1,386.3<br />
classification reviews, employer benefit costs and revised pay scale for<br />
Community Recreation Programmers<br />
2 Net increases in program revenues, fees and facilities rentals 78.9<br />
3 Impact of HRM corporate-wide administrative reductions (528.3)<br />
4 Impact of Community Recreation service change reduction including<br />
(195.0)<br />
salaries and benefits<br />
5 Reduction resulting from the centralization of postage and<br />
(90.0)<br />
printing/reproduction costs to CAO Office<br />
6 Decrease in interdepartmental fleet charges (56.9)<br />
7 <strong>Operating</strong> Cost of Capital implementation costs for Gordon R. Snow<br />
64.9<br />
Community Centre, East Dartmouth Recreation Facility and Community<br />
Events Infrastructure<br />
8 Increase funding for Main Street Dartmouth Business Association for<br />
25<br />
beautification programs and increase in community grants<br />
9 Miscellaneous increases in various items 13.7<br />
2010/11 Budget $20,318.6<br />
F5
<strong>Halifax</strong> <strong>Regional</strong> <strong>Municipality</strong><br />
2010/11 Business Plans and Budget (Proposed) Community Development<br />
Key Challenges and Opportunities<br />
The following challenges and opportunities will have an impact on the Business Unit between<br />
2010-2015.<br />
Challenges with Community-wide Impact:<br />
• 2011 Canada Winter Games: The 21st edition of the Canada Games will be hosted in the<br />
<strong>Halifax</strong> <strong>Regional</strong> <strong>Municipality</strong> and province of Nova Scotia from February 11 to 27, 2011.<br />
Featuring 20 sports and numerous cultural events and festivals, the Games will be the<br />
largest event in <strong>Halifax</strong>’s history and its first Canada Winter Games. The Games offer an<br />
important opportunity to the city; it’s a chance to showcase this region as a great place to<br />
live, work, and play. Successful hosting of this event will contribute to HRM’s reputation<br />
as a globally competitive, creative community and a premiere event destination. HRM, as<br />
one of the funding partners for the games, has committed to providing $6.85 million in<br />
capital to be spent on construction and upgrades to facilities required to make them games<br />
ready and $2.1 million towards operating value-in-kind (VIK) services such as<br />
transportation, policing, signage, fabrication, payroll, information technology, etc. This<br />
will be a challenge for all Business Units to align efforts and priorities as they integrate the<br />
costs of these additional services within their existing budgets.<br />
• Community Facility Funding: A growing challenge for HRM over the past few years has<br />
been an increasing demand for new community recreation facilities in suburban<br />
communities. Often when new neighbourhoods are built, or existing ones are expanded,<br />
there is insufficient funding for community facilities that will be expected and required by<br />
new residents once they move into the area. New recreation facilities in East Dartmouth,<br />
Fall River, Prospect and Clayton Park West (as part of the Canada Games Legacy), as well<br />
as a 4-Pad Arena facility in Bedford have put a strain on capital and operating budgets over<br />
the past few years. While Infrastructure is a Council Focus Area, recreation facilities are in<br />
competition with other central and regional projects (such as the Central Library,<br />
transportation, and streets and roads) for funding from increasingly smaller capital budgets.<br />
It is important that the design and size of new facilities is determined by community need<br />
rather than the amount of resources that are available in existing capital budgets.<br />
Adding to this challenge is the aging condition of urban facilities combined with the desire<br />
to increase densities within the core to better utilize existing infrastructure like streets,<br />
sewer and water services. Many of these facilities are in need of mid-life refits,<br />
reinvestment or an eventual replacement strategy. The Community Facility Master Plan<br />
adopted by Council in 2008 recommended that HRM examine existing funding methods<br />
for community facilities to consider implementing a Capital Cost Contribution (CCC)<br />
charge among other development charges for recreation facility funding. While existing<br />
legislation does not currently allow CCC’s for “soft services” such as recreation, HRM<br />
could work with the Province to permit such a charge. This and other alternative options<br />
will be examined to formulate a long term funding strategy for new community facilities.<br />
F6
<strong>Halifax</strong> <strong>Regional</strong> <strong>Municipality</strong><br />
2010/11 Business Plans and Budget (Proposed) Community Development<br />
These types of facilities also all operate on different cost recovery models, many linking<br />
back to pre-amalgamation relationships. The Community Facility Master Plan also made<br />
recommendations to review these funding models and develop a standardized approach to<br />
how operating budget models are developed for various types of facilities. This will require<br />
a significant time commitment to review all program delivery costs and understand<br />
influencing factors to achieve a new strategy.<br />
• <strong>Regional</strong> Plan Five-Year Review: The <strong>Regional</strong> Plan, adopted by Council in 2006, is<br />
scheduled for its first five-year review in 2011. During the 2010/11 budget year staff will<br />
complete a detailed scoping exercise and project plan for this initiative, which will be<br />
presented to Council for its review and approval. The review will feature two major<br />
themes: a focus on the core of HRM, and sustainable development. Currently the plan for<br />
the review is to incorporate a theme-based or issue-based approach rather than initiate a<br />
complete re-write of the <strong>Regional</strong> Plan. Nevertheless, preparation of the project plan and<br />
design of the review process will require a significant amount of staff time and resources,<br />
both within Community Development and from numerous other business units. As a result,<br />
Council may need to consider reducing or deferring other planning related initiatives for<br />
2011/12 to enable staff to successfully complete the review.<br />
• Cultural Plan: HRM continues to make significant progress in operationalizing the<br />
Cultural Plan. The primary challenge facing HRM will be maintaining the positive<br />
momentum that has developed within the cultural and artistic communities. In 2008, a new<br />
cultural operating strategy was developed to focus resources over the next five years on<br />
"public and community art, cultural spaces and places, capacity building and cultural<br />
planning". Each of these focus areas will serve HRM well in terms of retaining<br />
professionals and leading to HRM’s long term economic success as a cultural innovator<br />
and creative city. HRM continues to lag in the provision of accessible, affordable cultural<br />
spaces for professionals and residents alike to practice and participate. Most notably, the<br />
1585 Barrington Street building (Khyber), Bloomfield School, and the recently endorsed<br />
conversion of the former Dartmouth City Hall into cultural spaces have not been realized.<br />
Moreover, civic cultural spaces such as the Grand Parade, Granville Mall and Alderney<br />
Landing demand reinvestment to make them more attractive, vibrant spaces.<br />
• Community Engagement: HRM’s ability to foster strong, empowered and self-realized<br />
communities is greatly influenced by the degree of citizen engagement in aspects of civic<br />
life. The sheer size of HRM and its broad range of diverse communities mean HRM must<br />
engage its citizens collaboratively in the development of strategies and the identification of<br />
priorities within the local context. Conducting effective outreach and involving<br />
communities in formulating comprehensive strategies and actions for change is essential.<br />
HRM has had several positive examples of engaging communities through community<br />
development models, including Community Visioning. However, HRM has yet to develop<br />
programs specifically geared toward improving and building positive relationships with<br />
communities that may feel disconnected from municipal government. HRM will strive to<br />
improve such relationships through the establishment of a new African Nova Scotia Office<br />
within Community Relations & Cultural Affairs, as well as an increased focus on<br />
improving relationships with newcomers and Aboriginal Peoples.<br />
F7
<strong>Halifax</strong> <strong>Regional</strong> <strong>Municipality</strong><br />
2010/11 Business Plans and Budget (Proposed) Community Development<br />
Challenges with Service Delivery / Business Unit Impact<br />
• Community Recreation Service Review: Community Recreation Services is the focus of<br />
one of three service review processes to assess their fiscal health and service efficiency<br />
currently underway at the direction of <strong>Regional</strong> Council. The review will focus primarily<br />
on three areas: fees, charges and cost recovery formulas; service level standards, with an<br />
emphasis on appropriate levels of service based on various geographical and demographic<br />
groups; and accessibility of recreation services, in terms of subsidization programs and<br />
geographic location. The intent of this service review is to help properly align and<br />
prioritize recreation services with Council’s intended outcomes, and where possible reduce<br />
the cost of delivery while maintaining or improving service levels.<br />
• Community Facilities: There is a significant requirement to develop a policy framework<br />
around community facilities and leasing arrangements, which requires both staff and<br />
financial resources. Examples of policy areas include: community facility funding; cost<br />
recovery and funding assistance formulas; and access. This competes with the need to<br />
manage ongoing support and new requests from community facilities. In addition,<br />
Community Development has inherited a large portfolio of facility and tenant leases that<br />
require administering from TPW, including leases with both community and non-profit<br />
groups. Many of the daily requests could be better managed under the direction of a new<br />
policy framework. As such, for 2010/11, the priority in Service Delivery will be on the<br />
development of policy rather than on individual community or facility needs. Only the<br />
needs assessments previously committed to under the short term recommendations of the<br />
Community Facility Master Plan will be carried out in 2010/11.<br />
• Planning Applications: The <strong>Regional</strong> Plan contains a number of policies and regulations<br />
that continue to have a direct impact on the operation of Planning Services. Planning<br />
Services processes over 120 planning applications each year in order to facilitate new<br />
development appropriate to the community setting. It should be noted that the development<br />
industry has expressed concerns in the past with the time it takes to process applications.<br />
Over the past two years, processing times have steadily improved as the number of<br />
planners has increased, but recruitment of skilled staff presents an ongoing challenge.<br />
Implementation of Community Visioning projects, HRM by Design, 21 Functional Plans,<br />
<strong>Regional</strong> Plan Five-year Review, and the new Strategic Urban Partnership involves a<br />
significant workload for Planning Services, as well as in the rest of the department and<br />
other business units. The completion of these projects will require substantial Municipal<br />
Planning Strategy and by-law reviews, each of which consumes a significant amount of<br />
staff time and resources.<br />
• Succession Planning: HRM, along with many other companies and levels of government<br />
in Nova Scotia, is facing a critical challenge with respect to its aging workforce. The<br />
average age within our Business Unit is 45. Seventy-five percent of our senior<br />
management team is eligible for retirement within the next five years. In addition, one third<br />
of supervisory staff is also eligible for retirement within the next five years; particularly<br />
within Permits & Inspections. Without sufficient succession planning, training and<br />
F8
<strong>Halifax</strong> <strong>Regional</strong> <strong>Municipality</strong><br />
2010/11 Business Plans and Budget (Proposed) Community Development<br />
knowledge transfer, the next generation of managers and supervisors will face a large gap<br />
in corporate knowledge and experience. Succession planning activities are underway<br />
within the business unit but there is still a lot of work to be done and this remains a<br />
significant challenge in terms of future service delivery both internally and externally.<br />
• Volunteer Recruitment: HRM continues to experience difficulties in the recruitment and<br />
retention of new volunteers. Recruitment and retention are particularly difficult in the<br />
younger demographic, and HRM is particularly challenged due to its aging volunteer base<br />
who no longer can commit to such efforts. Since volunteering is essential to Community<br />
Development, prolonged and ongoing decline of volunteers will place stress on the<br />
operations and capacity of community organizations. Moreover, this will have a direct<br />
impact on HRM, which has built a system of community organizations to manage and<br />
deliver services on our behalf (i.e. facilities, recreation, heritage etc.) While HRM has a<br />
volunteer services program involving training, recognition and awards, and recently has<br />
launched a social marketing campaign to encourage more active volunteering and<br />
participation (Good Neighbours Great Neighbourhoods), HRM's ability to retain and<br />
attract new skilled volunteers requires new and innovative approaches. A volunteer<br />
retention and recruitment strategy is under development which should provide HRM sound<br />
direction for future recruitment. Volunteers are also at the heart of the Canada Games<br />
experience. The Host Society aims to attract, recruit, and retain 5,000 engaged volunteers<br />
to plan, lead, and execute the Games in 2011.<br />
• Cultural Space Development: The development of successful cultural spaces is essential<br />
for the long term development of the local creative sector and implementation of HRM’s<br />
Cultural Plan. HRM has few cultural spaces, especially those purposely designed for<br />
creative production, exhibition, and performance. Further, as HRM continues to grow, and<br />
the demand for new cultural facilities increases, a clearly articulated cultural facility<br />
development framework needs to be in place to address needs and opportunities. HRM is<br />
fortunate to have many cultural experts, however, the local capacity and experience<br />
required to manage and operate successful cultural facilities is limited. While HRM staff<br />
have experience with facility management, leasing and development, the specialized<br />
knowledge and experience required to create and manage dynamic art spaces does not<br />
exist. In fact, with the exception of organizations like Artscape Inc., such expertise does<br />
not readily exist in Canada. As HRM delves further into cultural facility development and<br />
management, the need for such expertise will become paramount. A mentorship program<br />
with experts like Artscape Inc. would be very advantageous for HRM.<br />
• Clarity of Roles and Responsibilities with <strong>Halifax</strong> Water Commission: On August 1,<br />
2007, HRM transferred responsibility for storm water & wastewater infrastructure and<br />
services to the <strong>Halifax</strong> <strong>Regional</strong> Water Commission. While the merger resulted in a clear<br />
division of infrastructure ownership between HRM and the Commission, clarity in<br />
processes and responsibilities has been difficult to achieve. In particular, due to the<br />
complex and multifaceted nature of many drainage issues, it has proven difficult to define<br />
clear roles and responsibilities. As well, with the extreme deficit related to storm water<br />
infrastructure, decisions related to funding and subsequent implementation of storm water<br />
capital work have not been defined. Both of these outstanding issues impact, and are<br />
F9
<strong>Halifax</strong> <strong>Regional</strong> <strong>Municipality</strong><br />
2010/11 Business Plans and Budget (Proposed) Community Development<br />
impacted by, the grading of private property. The difficulty in defining roles and<br />
responsibilities has created unexpected challenges in completing the Lot Grading By-law<br />
harmonization.<br />
Another area of concern relates to the provision of sufficient sanitary capacity for new<br />
developments. With the transfer of the wastewater function to <strong>Halifax</strong> Water and the<br />
subsequent implementation of new Federal regulations surrounding overflows, <strong>Halifax</strong><br />
Water is required to carry out significant analysis to determine the available sanitary<br />
capacity in its system. This work and the resulting outcomes may have a detrimental effect<br />
on future development in HRM.<br />
• Implementation of the Strategic Urban Partnership: The <strong>Regional</strong> Plan, Economic<br />
Development Strategy, HRMbyDesign, the Cultural Plan and other HRM policy initiatives<br />
highlight the importance of the <strong>Regional</strong> Centre as the economic and cultural engine of<br />
HRM. Global financial, environmental and energy challenges demand urban densification<br />
and investment. However, the <strong>Regional</strong> Centre is not currently positioned or managed as a<br />
strategic asset by HRM, the Province of Nova Scotia or the Government of Canada. As a<br />
result, there is a lack of adequate coordination, communication and funding between the<br />
various levels of government and major stakeholders with regard to strategic urban<br />
investments that will support the <strong>Regional</strong> Centre and stimulate private sector investment.<br />
Additionally there is slow movement on bringing publicly-owned lands to market for<br />
development.<br />
Within the <strong>Regional</strong> Centre there are approximately 800 "opportunity sites" on which new<br />
densification, redevelopment and public investment can occur. Within the 250 acre<br />
Downtown <strong>Halifax</strong> Plan area there are similarly 51 acres of vacant developable land; 54%<br />
of which is in government ownership. This places a significant share of the responsibility<br />
for economic growth and urban development with government. The Downtown <strong>Halifax</strong><br />
Secondary Municipal Planning Strategy contains policy direction for HRM to work with<br />
the other levels of government to encourage the strategic redevelopment of public lands<br />
and to make investment in amenities on these lands; however this policy must expand to<br />
include the entire <strong>Regional</strong> Centre.<br />
F10
<strong>Halifax</strong> <strong>Regional</strong> <strong>Municipality</strong><br />
2010/11 Business Plans and Budget (Proposed) Community Development<br />
The goals for Community Development are:<br />
Business Unit Goals<br />
Goal 1:<br />
Goal 2:<br />
Goal 3:<br />
Goal 4:<br />
Goal 5:<br />
Goal 6:<br />
Goal 7:<br />
Goal 8:<br />
Goal 9:<br />
Goal 10:<br />
Goal 11:<br />
Goal 12:<br />
Goal 13:<br />
Implementation of the <strong>Regional</strong> Plan<br />
Continue to support youth by partnering and facilitating youth engagement and<br />
leadership initiatives<br />
Implement Service Review within Community Recreation<br />
Support facilities and infrastructure that enhance opportunities for citizens to engage<br />
in healthy lifestyles and cultural development<br />
Implementation of the Cultural Plan<br />
Implementation of the Event Strategy<br />
Increase the capacity and civic involvement of HRM’s citizens<br />
Enhance service delivery in Planning Applications<br />
Human Resources Planning & Management<br />
Support <strong>Halifax</strong> 2011 Canada Winter Games<br />
Improve clarity of roles and responsibilities with <strong>Halifax</strong> Water Commission<br />
Implementation of the Strategic Urban Partnership<br />
Meet Internal Service Expectations<br />
Goal 1:<br />
Implementation of the <strong>Regional</strong> Plan<br />
Corporate Strategy Linkage:<br />
Council Focus Area – Community Planning<br />
Community Outcome Area – Well Planned and Engaged Communities<br />
EMT Priority – Fiscal Responsibility<br />
Description:<br />
The completion of the <strong>Regional</strong> Plan affords a renewed emphasis on Community Visioning,<br />
Community Plan Review and detailed community development initiatives in areas such as<br />
Heritage, Community Energy and Open Space Development through Functional Plans.<br />
Goal 1:<br />
Implementation of the <strong>Regional</strong> Plan<br />
Objectives for 2010/2011:<br />
CD 1.1<br />
CD 1.2<br />
CD 1.3<br />
CD 1.4<br />
Provide planning advice and technical support to the <strong>Regional</strong> Plan Advisory<br />
Committee<br />
Monitor and report on progress towards <strong>Regional</strong> Plan implementation<br />
Foster the sustainability and success of the <strong>Regional</strong> Centre through ongoing<br />
implementation of HRMbyDesign Phase II (Neighbourhood Greenprint)<br />
Support the Cogswell Master Planning program and extension of heritage district<br />
programs to other areas of the <strong>Regional</strong> Centre<br />
F11
<strong>Halifax</strong> <strong>Regional</strong> <strong>Municipality</strong><br />
2010/11 Business Plans and Budget (Proposed) Community Development<br />
CD 1.5<br />
CD 1.6<br />
CD 1.7<br />
Coordinate/Implement 21 Functional Plans. Also initiate a collaborative review<br />
of existing plans and strategies to identify current service standards and gaps to<br />
help predict future capital demand<br />
Lead ongoing implementation of HRM’s Community Visioning program and<br />
Community Planning projects<br />
Prepare project plan for Five-Year Review of <strong>Regional</strong> Plan<br />
Objectives for the next 3-5 years:<br />
CD 1.8<br />
CD 1.9<br />
CD 1.10<br />
CD 1.11<br />
CD 1.12<br />
CD 1.13<br />
Undertake <strong>Regional</strong> Plan 5-Year Review<br />
Complete/Implement Functional Plans<br />
Continue Community Visioning and Implementation programs<br />
Complete urban design planning process (HRMbyDesign) in the <strong>Regional</strong><br />
Centre<br />
Continue Barrington Street Heritage Incentives Program<br />
Continue to improve processing times for planning applications<br />
Goal 2:<br />
Continue to support youth by partnering and facilitating<br />
youth engagement and leadership initiatives<br />
Corporate Strategy Linkage:<br />
Council Focus Area - Public Safety<br />
Community Outcome Area – Safe & Welcoming Communities; Diverse Recreation, Leisure and<br />
Cultural Choices; Well Planned and Engaged Communities<br />
Description:<br />
A municipal leadership role is required to coordinate efforts among the numerous community<br />
and government agencies to address an increased focus on all youth, including those who are<br />
disengaged and marginalized; especially pre-teens. Engaging youth at the community level is a<br />
valuable tool to influence positive behaviour patterns and reduce risk for young people. Through<br />
community recreation activities and leadership development, youth learn important life skills that<br />
improve their ability to participate in their communities and become successful. In 2009, 1160<br />
youth were involved in training and leadership development courses.<br />
Goal 2:<br />
Continue to support youth by partnering and facilitating<br />
youth engagement and leadership initiatives<br />
Objectives for 2010/2011:<br />
CD 2.1<br />
Implement Youth Advocate Program (YAP) funded federally from the<br />
National Crime Prevention Centre to create a sustainable anti-gang initiative in<br />
pilot communities within HRM<br />
F12
<strong>Halifax</strong> <strong>Regional</strong> <strong>Municipality</strong><br />
2010/11 Business Plans and Budget (Proposed) Community Development<br />
CD 2.2 Continue to implement the goals and recommendations from the Youth<br />
Engagement Strategy focusing on pre-teens and outreach initiatives<br />
CD 2.3 Continue to support the goals of the Schools Plus program through the Child and<br />
Youth Strategy<br />
Objectives for the next 3-5 years:<br />
CD 2.4<br />
CD 2.5<br />
CD 2.6<br />
CD 2.7<br />
Make recommendations to <strong>Regional</strong> Council through the Service Review Study<br />
on youth service delivery<br />
Conduct a review of the Youth Engagement Strategy implementation<br />
Promote the Community Youth Development Program to adult organizations<br />
Evaluate the new youth leadership “3 step program”<br />
CD 2.8 Implement the youth goals from the HRM-wide Physical Activity Plan –<br />
Stepping Up<br />
CD 2.9 Continue to support the Youth Action Teams, H.E.A.T., Mindshift and the 400<br />
community based recreation youth initiatives<br />
CD 2.10 Evaluate and make recommendations on the HRM Kids program<br />
Goal 3:<br />
Implement Service Review within Community Recreation<br />
Corporate Strategy Linkage:<br />
Council Focus Area – Infrastructure, Public Safety, Community Planning<br />
Community Outcome Area – Safe & Welcoming Communities, Diverse Recreation, Leisure and<br />
Cultural choices<br />
EMT Priority – Fiscal Responsibility, Excellence in Service Delivery<br />
Description:<br />
The main purpose of the review is to determine the overall mandate for Community Recreation<br />
Services (CRS), and to assess the impact and value of the services provided based on the HRM<br />
Service Review criteria. CRS provides valuable, affordable and responsive services through<br />
community development, youth services, program delivery, and sport and facility scheduling.<br />
The Service Review could include all of the above mentioned four categories. An assessment of<br />
program delivery would also include costs, revenues, pricing and subsidization formulas.<br />
Goal 3:<br />
Implement Service Review within Community<br />
Recreation<br />
Objectives for 2010/2011:<br />
CD 3.1<br />
Review the current CRS recreation service delivery mandate and models, and<br />
their scope and impact by: conducting an environmental scan including a<br />
demographic analysis, assessment of community socioeconomic, historical and<br />
cultural circumstances<br />
F13
<strong>Halifax</strong> <strong>Regional</strong> <strong>Municipality</strong><br />
2010/11 Business Plans and Budget (Proposed) Community Development<br />
CD 3.2<br />
CD 3.3<br />
CD 3.4<br />
CD 3.5<br />
CD 3.6<br />
CD 3.7<br />
Conduct an internal scan of current policies, documents, strategies and business<br />
unit practices, and accompanying costs, revenues and funding formulas<br />
Assess community and stakeholder recreation needs and assets<br />
Research municipal recreation mandates and service delivery models across<br />
Canada and the U.S. for best practices<br />
Analyze and interpret data from the scans in order to validate or transform the<br />
CRS mandate and service delivery model and to determine gaps and<br />
opportunities in service<br />
At Council’s direction, develop policies directing service approach and service<br />
levels, followed by an implementation strategy to include recommendations on<br />
program effectiveness, costs, benefits and outcomes<br />
Review CRS hourly formula and a pricing and subsidization strategy to help<br />
define how municipal recreation services fit into the market and support a<br />
mechanism for HRM to facilitate or provide increased access<br />
Goal 4:<br />
Support facilities and infrastructure that enhance<br />
opportunities for citizens to engage in healthy lifestyles and<br />
cultural development<br />
Corporate Strategy Linkage:<br />
Council Focus Area – Infrastructure & Public Safety<br />
Community Outcome Area – Diverse Recreation, Leisure and Cultural Choices<br />
EMT Priority – Fiscal Responsibility<br />
Description:<br />
Community spaces and facilities are essential for developing community character and<br />
establishing a sense of place. They are focal points for community gathering, recreation and<br />
celebration. They also contribute to community image and pride. Council and citizens have<br />
identified community, recreation, cultural and event facilities as priorities. This includes a wide<br />
spectrum from small neighbourhood facilities to larger multi-district facilities.<br />
Numerous competing initiatives make it difficult to establish short and long term priorities.<br />
Strategic categories for prioritization include:<br />
I. maintenance, recapitalization and decommissioning;<br />
II. development of new facilities and spaces;<br />
III. access to a variety of existing facilities within the community (universities, schools); and<br />
IV. strengthened support to community operated facilities and spaces<br />
F14
<strong>Halifax</strong> <strong>Regional</strong> <strong>Municipality</strong><br />
2010/11 Business Plans and Budget (Proposed) Community Development<br />
Goal 4:<br />
Support facilities and infrastructure that enhance<br />
opportunities for citizens to engage in healthy lifestyles<br />
and cultural development<br />
Objectives for 2010/2011:<br />
CD 4.1<br />
Implementation of short term priorities of 2008 Community Facility Master Plan<br />
CD 4.2 Completion and opening of new 4-pad arena complex in fall 2010<br />
CD 4.3<br />
CD 4.4<br />
CD 4.5<br />
CD 4.6<br />
CD 4.7<br />
CD 4.8<br />
CD 4.9<br />
CD 4.10<br />
Development of a Long Term Arena Strategy with recommendations on<br />
recapitalization, conversions, decommissions and/or new ice surfaces for multiyear<br />
capital planning. Facility expansion proposals at Cole Harbour Place,<br />
Eastern Shore Arena and Centennial Arena will be evaluated as part of this<br />
Strategy.<br />
Expand the facility lease and management agreement review process to other<br />
facility categories and recommend appropriate required support policies and<br />
procedures<br />
Implement a management and administrative program to track and monitor<br />
tenant leases to ensure consistent approach, applicability, risk, liability, and<br />
proper taxation to ensure that revenues owed to HRM are being collected<br />
Complete needs assessments required to review facility needs and reposition the<br />
Dartmouth Sportsplex and <strong>Halifax</strong> Forum. The review at the <strong>Halifax</strong> Forum site<br />
is included into an overall assessment of the aging facilities and growing needs<br />
on the <strong>Halifax</strong> Peninsula<br />
Evaluate how and whether the proposed transfer of the Bell School Annex from<br />
the <strong>Halifax</strong> <strong>Regional</strong> School Board could fit into facility requests in the Cole<br />
Harbour and Cherrybrook areas.<br />
Develop policy framework for a new funding strategy for cost recovery and<br />
funding assistance for community facilities<br />
Develop an action plan and funding strategy in response to a partnership<br />
opportunity for a new school in Bedford that could include community and<br />
recreational space<br />
Support community board operated and HRM operated recreation facilities in<br />
establishing proper source separation of waste materials as per HRM By-law S-<br />
600. Partner with HRM Solid Waste Resources to provide education to facility<br />
staff during program implementation<br />
F15
<strong>Halifax</strong> <strong>Regional</strong> <strong>Municipality</strong><br />
2010/11 Business Plans and Budget (Proposed) Community Development<br />
CD 4.11 Collaborate with IAM by advising them when Community Development<br />
facilities:<br />
a) are no longer capable of supporting an acceptable service level; or<br />
b) are being abandoned due to a discontinuation of service or if service is being<br />
relocated to another facility; or<br />
c) are in a condition that no longer supports further investment based on the<br />
existing use; or<br />
d) in the case of community run facilities, the facility is not being utilized or<br />
managed by the community and the community does not support an alternative<br />
service delivery model<br />
Objectives for the next 3-5 years:<br />
CD 4.12<br />
CD 4.13<br />
CD 4.14<br />
CD 4.15<br />
CD 4.16<br />
Implement a business development and opportunities program to help support<br />
larger facilities where such opportunities may exist and are used to help offset<br />
user fee costs for recreational and community programming activities<br />
Complete a review of facility needs and issues in the Upper Hammonds Plains<br />
and Spryfield areas<br />
Develop an action plan for any facility needs arising from assessments listed in<br />
4.3, 4.6, 4.7 and 4.9<br />
Review, evaluate and renegotiate as necessary land leases with community and<br />
non-profit groups to ensure consistent approach, applicability, risk, liability, and<br />
proper taxation to ensure that revenues owed to HRM are being collected<br />
Implement the Physical Activity Plan objectives focused on maximizing access<br />
to community facilities to support increased levels of physical activity<br />
Goal 5:<br />
Implementation of the Cultural Plan<br />
Corporate Strategy Linkage:<br />
Community Outcome Area – Diverse Recreation, Leisure and Cultural Choices<br />
Description:<br />
The municipality requires a strategic framework to support HRM’s professional and community<br />
cultural development. The Cultural Plan, adopted in 2006, outlines the strategic and investment<br />
framework for the next ten years. As a progressive local government, HRM is poised to become<br />
a leader in cultural planning and development. This is very important given the social and<br />
economic development benefits that can be derived, and its contribution to fostering safe<br />
communities, youth development, creativity and innovation. To ensure HRM advances as a<br />
cultural capital, well researched, innovative and diverse programs and services are needed.<br />
Additionally, the employment of multi-sector partnerships and strategies will be necessary.<br />
F16
<strong>Halifax</strong> <strong>Regional</strong> <strong>Municipality</strong><br />
2010/11 Business Plans and Budget (Proposed) Community Development<br />
Goal 5:<br />
Implementation of the Cultural Plan<br />
Objectives for 2010/2011:<br />
CD 5.1<br />
CD 5.2<br />
CD 5.3<br />
CD 5.4<br />
CD 5.5<br />
CD 5.6<br />
CD 5.7<br />
Develop new cultural policies, plans and strategies including: a cultural spaces<br />
strategy, a social heritage strategy, public art operating plan, community art<br />
operating plan and a civic collection policy<br />
Deliver and implement new operating and redevelopment plans for cultural<br />
facilities<br />
Deliver new cultural studios program at underutilized and transitional HRM<br />
owned facilities<br />
Deliver and implement a redevelopment plan for cultural spaces including the<br />
Granville Mall and the Grand Parade<br />
Continue to deliver HRM’s Public Art Program<br />
Continue to deliver a variety of community art programming<br />
Develop new social heritage programs<br />
CD 5.8 Partner with the <strong>Halifax</strong> 2011 Host Society to develop a youth artist exchange<br />
program<br />
CD 5.9 Renegotiate Service Contracts with heritage institutions operating from HRM<br />
owned facilities<br />
CD 5.10 Establish an ad-hoc cultural panel to facilitate new partnerships and to provide<br />
an avenue for positive exchange between HRM and the creative sector<br />
Objectives for the next 3-5 years:<br />
CD 5.11<br />
CD 5.12<br />
CD 5.13<br />
CD 5.14<br />
CD 5.15<br />
Explore mentorship opportunities to become better equipped locally to develop<br />
and manage successful new cultural spaces<br />
Design and deliver a new cultural planning and mapping project in concert with<br />
community visioning initiatives<br />
Design and deliver a new Cultural Institution Contributions Programs, a new<br />
Cultural Presentation Grant Program, and amend community grants program to<br />
establish 2 funding streams - community and amateur versus professional<br />
Facilitate new partnerships between the NSCAD, Visual Arts Nova Scotia,<br />
Music Nova Scotia, Business Improvement Districts, Chamber of Commerce,<br />
and the cultural sector on opportunities for new investments and projects that<br />
satisfy common outcomes<br />
Review and facilitate changes to internal policies and processes such as Streets<br />
and Right of Way approval processes, civic addressing, procurement policies,<br />
insurance guidelines, property disposal, land use by-laws, to begin to reduce<br />
internal barriers to cultural programming and activities<br />
F17
<strong>Halifax</strong> <strong>Regional</strong> <strong>Municipality</strong><br />
2010/11 Business Plans and Budget (Proposed) Community Development<br />
Goal 6:<br />
Implementation of the Event Strategy<br />
Corporate Strategy Linkage:<br />
Council Focus Area - Infrastructure<br />
Community Outcome Area – Diverse Recreation, Leisure and Cultural Choices<br />
Description:<br />
HRM offers many exciting, entertaining events each year. The role of HRM in event delivery<br />
varies - host, partner, funder or organizer. But whatever the role, HRM has built a reputation as<br />
a real competitor delivering annually a wide range of offerings: from local, national and<br />
international sporting, cultural, community and major events. The benefits of a dynamic event<br />
portfolio are clear: events contribute to HRM's overall attractiveness, foster a sense of<br />
community, lend a cosmopolitan feel to the region, and play a powerful developmental role in<br />
both community building and contemporary cultural development. Events also bring substantial<br />
economic activity including ticket sales, direct and indirect employment, increased hospitality<br />
and retail revenue, as well as sponsorship investment. In its inaugural year of adoption, HRM<br />
will begin to roll out several key actions from the strategy including revised funding and granting<br />
schemes, new and expanded events, improved governance, and streamlined decision making<br />
processes.<br />
Goal 6:<br />
Implementation of the Event Strategy<br />
Objectives for 2010/2011:<br />
CD 6.1 Explore the establishment of a new Major Tourism and Sport Event Hosting<br />
program/agency to serve HRM<br />
CD 6.2 Explore the establishment of a new Canadian City Public Art Spectacle<br />
consortium opportunity with the City of Toronto in an effort to deliver spectacle<br />
events<br />
CD 6.3 Revise civic event granting framework to include new funding and grant<br />
programs, including a district event grant program, amateur sport grant program,<br />
and sponsorship program<br />
CD 6.4 Redesign and develop new events including: a new multi-disciplinary arts event<br />
based on themes of food, urban art, and hip hop dance and music; revamp the<br />
HRM Christmas Tree Lighting event; and deliver an expanded New Year's Eve<br />
event program, with an accompanying family-themed event at the Oval on the<br />
<strong>Halifax</strong> Common<br />
CD 6.5 Establish a new Civic Event Coordinator position to support new event grant<br />
program and administration, new accountability procedures, and partnership<br />
engagement, as well as event delivery<br />
Objectives for the next 3-5 years:<br />
CD 6.6<br />
CD 6.7<br />
Explore new event funding opportunities such as a realignment of existing<br />
funding programs, reallocation of the share of hotel tax levy, or new tax sources<br />
(i.e. lottery tax, parking lot surcharges, ticket surcharges)<br />
Explore possible reductions to the internal municipal services cost recovery<br />
practice for HRM delivered events<br />
F18
<strong>Halifax</strong> <strong>Regional</strong> <strong>Municipality</strong><br />
2010/11 Business Plans and Budget (Proposed) Community Development<br />
CD 6.8<br />
CD 6.9<br />
CD 6.10<br />
CD 6.11<br />
Develop 2 new major community events over the next 5 years that are relevant<br />
and reflective of HRM’s immigrant, African Nova Scotian, Aboriginal, and<br />
youth communities<br />
Develop 2 new major cultural and tourism events over the next 5 years that<br />
showcase HRM’s cultural industry and positions HRM as a creative region.<br />
Refocus civic event program to better align with community building. cultural<br />
development and economic outcomes<br />
Allocate more staff resources towards building the capacity of local community<br />
and cultural event organizers to establish quality events<br />
Goal 7:<br />
Increase the capacity and civic involvement of HRM’s<br />
citizens<br />
Corporate Strategy Linkage:<br />
Council Focus Area - Community Planning, Public Safety<br />
Community Outcome Area – Well Planned and Engaged Communities<br />
Description:<br />
HRM values volunteers and recognizes the importance of engaging citizens in civic life and<br />
democratic debate. With the adoption of the Community Engagement Strategy, HRM is<br />
positioned to improve its approach to civic engagement and facilitate more active citizen<br />
participation in daily life and civic process. HRM views civic engagement as a critical first step<br />
towards building and developing volunteers. Residents that know how to voice their opinions,<br />
influence what is going on in their community, understand local priorities, and how they can<br />
influence services and initiatives are more likely to volunteer. HRM will continue to foster a<br />
culture of civic activism as a key strategy for recruiting new volunteers. HRM will also continue<br />
to invest in these volunteers through opportunities for training and professional development.<br />
Goal 7:<br />
Increase the capacity and civic involvement of HRM’s<br />
citizens<br />
Objectives for 2010/2011:<br />
CD 7.1<br />
CD 7.2<br />
CD 7.3<br />
CD 7.4<br />
CD 7.5<br />
Establish new African Nova Scotian office and an operation strategy<br />
Continue to increase capacity of all HRM staff to conduct effective community<br />
engagement and design major strategic community engagement exercises<br />
Design and deliver a broad community visioning and relationship building<br />
program for the Preston area<br />
Design and deliver new integrated staff service teams to support community<br />
visioning and implementation processes, as well as to support the youth advocate<br />
communities<br />
Translate versions of the Newcomers Guide into different languages, and<br />
develop and design a new youth focused Newcomers Guide<br />
F19
<strong>Halifax</strong> <strong>Regional</strong> <strong>Municipality</strong><br />
2010/11 Business Plans and Budget (Proposed) Community Development<br />
CD 7.6<br />
CD 7.7<br />
Contribute to the completion of the National Urban Aboriginal Study and design<br />
local implementation plan for HRM<br />
Implement a new Volunteer Strategy<br />
CD 7.8 Continue to provide support to volunteers with specific focus on public housing<br />
communities, visioning communities, newcomers, Aboriginal Peoples, and<br />
African Nova Scotians<br />
CD 7.9 Complete board of directors design and recruitment process for the Canada<br />
Games Centre<br />
CD 7.10 Contract an outside agent to review the grants and contribution programs<br />
administered under Community Development<br />
Objectives for the next 3-5 years:<br />
CD 7.11<br />
CD 7.12<br />
CD 7.13<br />
CD 7.14<br />
Update the Immigration Action Plan<br />
Design and deliver new programs and services to enhance relationships between<br />
HRM and newcomers, Aboriginal Peoples, African Nova Scotians, and youth<br />
and to increase opportunities for active civic engagement<br />
Operationalize a new community development model and the community liaison<br />
concept, as identified in Mayors Round Table on Violence, by defining the<br />
respective roles and responsibilities of Community Recreation Coordinators,<br />
Community Police Officers, and Community Developers<br />
Develop a protocol to determine how Community Development initiatives are<br />
administered between Community Recreation Services, Community Relations &<br />
Cultural Affairs, and Service Delivery staff<br />
Goal 8:<br />
Enhance service delivery in Planning Applications<br />
Corporate Strategy Linkage:<br />
Council Focus Area – Community Planning<br />
Community Outcome Area – Well Planned and Engaged Communities<br />
EMT Priority – Excellence in Service Delivery<br />
Description:<br />
In response to issues raised in the business community, Planning Applications will focus on<br />
continued service delivery enhancements through education and consultation with the<br />
development industry, refined community consultation techniques and reductions in time frames<br />
for processing planning applications.<br />
Goal 8:<br />
Enhance service delivery in Planning Applications<br />
Objectives for 2010/2011:<br />
CD 8.1 Refine the pre-application process and application requirements<br />
CD 8.2 Complete standard development agreement template<br />
F20
<strong>Halifax</strong> <strong>Regional</strong> <strong>Municipality</strong><br />
2010/11 Business Plans and Budget (Proposed) Community Development<br />
CD 8.3<br />
CD 8.4<br />
Training for staff on effective community engagement<br />
Standardize approaches for effective public meetings<br />
CD 8.5 Continue to support district boundary review project led by the Municipal<br />
Clerk’s Office, including facilitation support for up to 23 district public meetings<br />
in 2010. Implementation of changes to planning processes as a result of<br />
<strong>Regional</strong> Council’s decision on this issue.<br />
Objectives for the next 3-5 years:<br />
CD 8.6<br />
CD 8.7<br />
Refine case management tracking through the implementation of Hansen<br />
software<br />
Implement improvements to existing public consultation and engagement<br />
practices<br />
Goal 9:<br />
Human Resource Planning & Management<br />
Corporate Strategy Linkage:<br />
EMT Priority – Employer of Choice, Excellence in Service Delivery<br />
Description:<br />
Within the next 5 years, a significant percentage of experienced Community Development staff<br />
will be eligible for retirement. The ability to recruit and retain experienced staff to replace<br />
imminent retirements, secondments and other departures has proven difficult. The majority of<br />
new hires have been recent graduates with little or no professional experience. Any reduction in<br />
staff levels, even for short periods of time will create significant capacity and skill gaps.<br />
Goal 9:<br />
Human Resources Planning & Management<br />
Objectives for 2010/2011:<br />
CD 9.1<br />
CD 9.2<br />
CD 9.3<br />
CD 9.4<br />
CD 9.5<br />
CD 9.6<br />
Ensure business unit work alignment meets organizational needs and goals<br />
(effective service delivery)<br />
Initiate new Workforce Planning process led by HR<br />
Continue to develop and implement a strategic succession planning model as<br />
part of the new Workforce Planning process to incorporate training and<br />
development opportunities for supervisory and management positions. Focus of<br />
initial implementation to be in areas of critical need<br />
Continue to implement and monitor results of employee engagement action plan<br />
and make amendments to reflect staff feedback and new survey results as<br />
necessary<br />
Support ongoing staff development through the provision of training and<br />
development opportunities<br />
Support and implement EMT’s Employer of Choice programs including: HR<br />
People Plan, leadership development, employee recognition and appreciation,<br />
diversity programs and corporate safety initiatives<br />
F21
<strong>Halifax</strong> <strong>Regional</strong> <strong>Municipality</strong><br />
2010/11 Business Plans and Budget (Proposed) Community Development<br />
Objectives for the next 3-5 years:<br />
CD 9.7<br />
Complete Workforce Planning, including succession plan for all divisions and<br />
update as necessary<br />
Goal 10:<br />
Support <strong>Halifax</strong> 2011 Canada Winter Games<br />
Corporate Strategy Linkage:<br />
Council Focus Area - Infrastructure<br />
Community Outcome Area – Diverse Recreation, Leisure and Cultural Choices<br />
Description:<br />
<strong>Halifax</strong> 2011 Canada Winter Games will be the largest sporting event in <strong>Halifax</strong>’s history and<br />
the <strong>Municipality</strong>’s first Canada Winter Games. Our country’s best and brightest will come to<br />
compete in over 20 sports, attracting thousands of visitors, VIPs, officials and media.<br />
Community Development will be a major supporter of the Canada Games and has established a<br />
Project Office and assigned resources to ensure HRM’s varied interests in the <strong>Halifax</strong> 2011<br />
Canada Winter Games are supported and optimally managed.<br />
Goal 10:<br />
Support <strong>Halifax</strong> 2011 Canada Winter Games<br />
Objectives for 2010/2011:<br />
CD 10.1 Provide staff support and input into planning the 2011 games<br />
CD 10.2 Support the planning and management of capital upgrades valued at $4,850,000<br />
to HRM venues to make them games ready<br />
CD 10.3 Coordinate value-in-kind (VIK) services with business units valued at<br />
$2,054,000 in operating costs<br />
CD 10.4 Support the National Artists Program through the Youth Advocate Program<br />
CD 10.5 Develop programming and events plan for the Oval on <strong>Halifax</strong> Commons<br />
Goal 11:<br />
Improve clarity of roles and responsibilities with <strong>Halifax</strong><br />
Water Commission<br />
Corporate Strategy Linkage:<br />
Council Focus Area – Infrastructure<br />
EMT Priority – Excellence in Service Delivery<br />
Description:<br />
In 2007 HRM transferred responsibility for storm water & wastewater infrastructure and services<br />
to the <strong>Halifax</strong> <strong>Regional</strong> Water Commission. While the merger resulted in a clear division of<br />
infrastructure ownership, clarity in processes and responsibilities has been difficult to achieve. In<br />
F22
<strong>Halifax</strong> <strong>Regional</strong> <strong>Municipality</strong><br />
2010/11 Business Plans and Budget (Proposed) Community Development<br />
particular, processes and responsibility associated with the installation of storm sewers and<br />
drainage issue responses need to be established. Other processes associated with development<br />
reviews which have been implemented require monitoring to ensure the appropriate service<br />
delivery model has been achieved.<br />
Goal 11:<br />
Improve clarity of roles and responsibilities with <strong>Halifax</strong><br />
Water Commission<br />
Objectives for 2010/2011:<br />
CD 11.1<br />
Support creation of clarified processes for drainage complaints<br />
CD 11.2 Support creation of process for installation of new storm sewers which addresses<br />
both funding and jurisdiction<br />
CD 11.3 Continue ongoing review of development processes to ensure appropriate service<br />
delivery between HW and Development Engineering<br />
Objectives for the next 3-5 years:<br />
CD 11.4<br />
Amend planning legislation where necessary to incorporate Canadian Council of<br />
Ministers of the Environment Guidelines with respect to sanitary capacity<br />
Goal 12:<br />
Implementation of the Strategic Urban Partnership<br />
Corporate Strategy Linkage:<br />
Council Focus Area – Community Planning, Infrastructure<br />
Community Outcome Area – Well Planned and Engaged Communities, Economic Prosperity<br />
EMT Priority – Excellence in Service Delivery<br />
Description:<br />
The Strategic Urban Partnership (SUP) is a forum through which the three levels of government<br />
and major stakeholders in the <strong>Regional</strong> Centre can identify and fund strategic urban investments<br />
that capitalize on the synergies of their respective priorities, and thereby foster private<br />
investment. The SUP will include representatives from the three levels of government, not-forprofit<br />
organizations, crown corporations, universities, economic development agencies, business<br />
improvement districts, and other major urban stakeholders within the <strong>Regional</strong> Centre.<br />
Additionally, an "Urban Infill Development Task Force" will be created to: inventory vacant<br />
publicly-owned land; determine appropriate mix of uses and other guidelines for maximum<br />
public benefit; rezone land as necessary; facilitate cooperation with adjacent landowners; and<br />
package the lands for regulatory approval and subsequent development.<br />
F23
<strong>Halifax</strong> <strong>Regional</strong> <strong>Municipality</strong><br />
2010/11 Business Plans and Budget (Proposed) Community Development<br />
Goal 12:<br />
Implementation of the Strategic Urban Partnership<br />
Objectives for 2010/2011:<br />
CD 12.1<br />
Launch the Strategic Urban Partnership in collaboration with other levels of<br />
government and key stakeholders to ensure the sustainability and viability of the<br />
<strong>Regional</strong> Centre<br />
CD 12.2<br />
Formation of the Urban Infill Development Task Force<br />
Objectives for the next 3-5 years:<br />
CD 12.3<br />
CD 12.4<br />
Continue to identify, fund and implement strategic investment in urban capital<br />
improvement projects<br />
Continue the work of the Urban Infill Development Task Force to bring<br />
<strong>Regional</strong> Centre publicly-owned lands to market for development<br />
Goal 13:<br />
Meet Internal Service Expectations<br />
Corporate Strategy Linkage:<br />
EMT Priority – Excellence in Service Delivery<br />
Description:<br />
Internal Service Expectations (ISEs) are requests between business units to help all units achieve<br />
their business plan goals and objectives. The following list of ISEs includes any commitments<br />
accepted by Community Development from other business units which are not represented<br />
elsewhere in this business plan.<br />
Goal 13:<br />
Meet Internal Service Expectations<br />
Objectives for 2010/2011:<br />
CD 13.1<br />
Participate and support the objectives of various interdepartmental committees<br />
including, but not limited to: Corporate Recognition Committee, Labour<br />
Management Committee, collective bargaining teams, CCC program team,<br />
Capital Project Pre-construction and construction teams, Road Construction &<br />
Improvement review team, Climate Change Adaptation/Risk Management team,<br />
Corporate Green Teams, and Sustainability Transition Team<br />
F24
<strong>Halifax</strong> <strong>Regional</strong> <strong>Municipality</strong><br />
2010/11 Business Plans and Budget (Proposed) Community Development<br />
CD 13.2 Support the rollout and internal communication of various corporate and<br />
business unit led policies, programs, and initiatives including, but not limited to:<br />
Multi-year Financial Strategy, Tangible Capital Asset accountabilities, Privacy<br />
Policy, Desktop Software rollout, <strong>Operating</strong> System Upgrade, new HR policies<br />
and initiatives, Security Clearance Project, EMT Employer of Choice initiatives,<br />
trench reinstatement consultation, Sustainability Filter for Capital projects,<br />
Sustainable Catering Guidelines, Communications Strategy, Litter Campaign,<br />
and source separation education and programs<br />
CD 13.3 Provide special event planning and logistical support for Earth Hour/ Earth Day<br />
activities<br />
CD 13.4 Support HRM’s sustainability focus through 2-3 strategic stakeholder<br />
performances of MindShift<br />
CD 13.5 Continue to support and educate HRM Business Parks staff on the application<br />
and approval process for subdivision and other permits<br />
CD 13.6 Partner with <strong>Halifax</strong> Public Libraries staff to identify opportunities for future<br />
collaboration and sharing of resources to improve overall customer service<br />
Objectives for the next 3-5 years:<br />
CD 13.7<br />
CD 13.8<br />
Continue to participate and support the objectives of various interdepartmental<br />
committees<br />
Continue to support the rollout and communication of various corporate and<br />
business unit led policies, programs and initiatives<br />
F25
<strong>Halifax</strong> <strong>Regional</strong> <strong>Municipality</strong><br />
2010/11 Business Plans and Budget (Proposed) Community Development<br />
Service Level Changes<br />
Increase in Services/New Initiatives:<br />
• African Nova Scotian Office<br />
• Official opening of three major community facilities including: the Canada Games Centre (CGC),<br />
Prospect Road Community Centre, and 4-Pad Arena Complex<br />
• Capital improvements to HRM-owned supervised beachfronts<br />
• Maintenance and programming of new Oval on the <strong>Halifax</strong> Common<br />
Decrease in Services/Operational Pressures:<br />
Decrease in Service:<br />
• Reduction in community art, public art and cultural programming for 2010/11<br />
• Reduction in recreation funding support for Youth Engagement Strategy initiatives<br />
• Advertising and promotion of planning-related public meetings will be reduced; however,<br />
minimum requirements under legislation will still be met<br />
• Reduction in the scope of consulting projects related to the Housing Affordability and Heritage<br />
Functional Plans<br />
Operational Pressures:<br />
• Requirements and projects identified as part of the <strong>Regional</strong> Plan (i.e. coordination of 21 functional<br />
plans, Strategic Urban Partnership, HRMbyDesign Phase II, and community visioning) will put<br />
pressure on staff to complete these projects along with existing programs and services. This may<br />
result in reduced service or program delivery in lower priority areas.<br />
• Project management of HRM’s value-in-kind (VIK) contributions towards the successful delivery<br />
of the <strong>Halifax</strong> 2011 Canada Winter Games<br />
• Increased workforce planning efforts (i.e. succession planning, training opportunities) are required<br />
to address staff attrition due to an aging workforce and the impact of external competition<br />
Expected Services Not Being Delivered:<br />
• Elimination of mural traffic control box program<br />
• Suspension of artefact interpretation and cataloguing, and heritage events for 2010/11<br />
• Suspension of Community Facility Partnership Fund grants for 2010/11<br />
F26
Community Development<br />
Summary of Gross Expenditures by Division<br />
2008-2009 2009-2010 2009-2010 2010-2011 Change over<br />
Actual Budget Projections Budget Budget Var as %<br />
CDBU Administration<br />
C410 Director's Office 320,666 378,590 344,831 347,947 (30,643) (8.1)<br />
C412 2011 CWG Project Off 39,010 18,000 139,719 18,350 350 1.9<br />
C470 Canada Games 2011 900,353 0 0 0 0 -<br />
M691 VIK - Special Events 10,665 0 14,500 0 0 -<br />
1,270,694 396,590 499,050 366,297 (30,293) (7.6)<br />
Market Development<br />
C711 Destination <strong>Halifax</strong> 2,156,406 1,991,400 1,991,400 1,999,800 8,400 0.4<br />
2,156,406 1,991,400 1,991,400 1,999,800 8,400 0.4<br />
Facilities<br />
C705 Facility Management 1,159,916 1,347,600 1,378,630 1,399,202 51,602 3.8<br />
1,159,916 1,347,600 1,378,630 1,399,202 51,602 3.8<br />
Community Relations<br />
A811 Community Grants 136,954 141,800 144,260 140,910 (890) (0.6)<br />
C730 Cultural Affairs 397,341 572,800 553,880 585,920 13,120 2.3<br />
C760 Community/CivicEvent 1,407,278 1,238,300 1,299,298 1,251,210 12,910 1.0<br />
C762 Youth Advocate Program 526,863 610,400 610,400 675,262 64,862 10.6<br />
C764 Cultural Development 0 0 0 (23,500) (23,500) -<br />
C770 Buildings/Operations 97,488 136,600 117,801 103,470 (33,130) (24.3)<br />
C771 BID's Special Projects 0 0 0 200,000 200,000 -<br />
1,083,333 1,145,100 1,019,610 1,341,554 196,454 17.2<br />
3,649,256 3,845,000 3,745,249 4,274,826 429,826 11.2<br />
Development Services<br />
C420 Subdivision & Dev. 2,364,035 2,385,600 2,351,582 2,462,430 76,830 3.2<br />
C430 Permits & Inspection 2,830,768 3,105,200 2,787,050 3,129,861 24,661 0.8<br />
C450 Development Engineering 1,144,435 1,146,900 1,111,500 1,188,861 41,961 3.7<br />
6,339,238 6,637,700 6,250,132 6,781,152 143,452 2.2<br />
Planning Services<br />
C310 Planning & Applic. 1,864,642 2,070,700 1,975,912 2,432,519 361,819 17.5<br />
C320 <strong>Regional</strong> Comm Plann 850,339 879,400 810,707 1,138,057 258,657 29.4<br />
C340 Planning Services 10 0 0 0 0 -<br />
C510 Locked Bus Dist. Com 1,305,260 0 0 0 0 -<br />
C511 Downtown Dartmouth BID 0 177,907 177,907 178,000 93 0.1<br />
C512 Downtown <strong>Halifax</strong> BID 0 525,274 525,274 525,300 26 0.0<br />
C513 Spring Garden Road BID 0 283,508 283,508 283,600 92 0.0<br />
C514 Quinpool Road BID 0 68,159 68,159 68,300 141 0.2<br />
C515 Spryfield & District BID 0 40,871 40,871 40,900 29 0.1<br />
C516 Sackville Drive BID 0 88,245 88,245 88,300 55 0.1<br />
C517 Dart Main St BID 0 74,428 74,428 74,600 172 0.2<br />
C779 Capital District 794,138 884,400 614,444 0 (884,400) (100.0)<br />
4,814,390 5,092,892 4,659,455 4,829,576 (263,316) (5.2)<br />
Recreation Services<br />
C726 Marketing & Promotions 186,627 172,900 159,884 117,600 (55,300) (32.0)<br />
C910 Facility Transfers 497,994 398,000 499,000 405,700 7,700 1.9<br />
D101 Rec. Prog. Admin. 925,485 972,000 891,058 916,830 (55,170) (5.7)<br />
D103 Recreation Equipment 1,225<br />
D104 LEED's Facilities 31,500 31,500 24,485 56,065 24,565 78.0<br />
1,642,832 1,574,400 1,574,427 1,496,195 (78,205) (5.0)<br />
Outdoor Recreation<br />
D755 Rec/Enviro Leadership 386,157 386,400 414,328 425,104 38,704 10.0<br />
D760 Otd Rec& Env Ser. (562) 0 0 0 0 -<br />
385,595 386,400 414,328 425,104 38,704 10.0<br />
Aquatic Services<br />
D175 Capt. Will Spry Aquatics 354,100 335,100 354,619 361,860 26,760 8.0<br />
D220 Northcliffe Aquatics 397,386 417,000 390,779 429,950 12,950 3.1<br />
D320 Bedford Outdoor Pool 66,698 68,300 66,300 74,580 6,280 9.2<br />
D540 Beaches/Common Pool 441,446 413,200 403,954 473,960 60,760 14.7<br />
D570 Needham Aquatics 129,513 146,600 154,867 158,610 12,010 8.2<br />
1,389,143 1,380,200 1,370,519 1,498,960 118,760 8.6<br />
F27
Community Development<br />
Summary of Gross Expenditures by Division (continued)<br />
2008-2009 2009-2010 2009-2010 2010-2011 Change over<br />
Actual Budget Projections Budget Budget Var as %<br />
Mainland South & Area<br />
D155 Area Prog. & Maint. 524,345 521,000 548,551 551,585 30,585 5.9<br />
D160 SMBC Prog. & Maint. 186,091 181,500 182,243 137,545 (43,955) (24.2)<br />
D165 CLCC Maint. 108,500 109,700 109,700 109,700 0 -<br />
D180 Herring Cv. AreaProg 159,803 146,800 160,280 181,855 35,055 23.9<br />
D170 CWSCC Prog. & Maint. 723,270 712,200 734,436 627,465 (84,735) (11.9)<br />
D176 CWSCC Fitness Ctr 41,461 45,200 41,385 46,840 1,640 3.6<br />
1,743,470 1,716,400 1,776,595 1,654,990 (61,410) (3.6)<br />
Mainland N & Western<br />
D210 Area Prog. & Maint. 755,599 695,900 731,953 741,290 45,390 6.5<br />
D230 Northcliffe Maint. 255,414 258,100 258,100 259,500 1,400 0.5<br />
D270 Lakeside Maint. 83,300 84,200 84,200 84,600 400 0.5<br />
D580 St Andrews Prog & Maint. 363,596 360,900 385,788 385,920 25,020 6.9<br />
1,457,910 1,399,100 1,460,041 1,471,310 72,210 5.2<br />
Bedford/Sack/Fall River<br />
D310 BSFR Prog. & Maint. 1,209,688 1,249,800 1,211,545 1,291,360 41,560 3.3<br />
D340 Fall River Rec. Ctr. 48,221 43,100 47,713 43,100 0 -<br />
D975 Bedford Leisure Club 1,237 0 0 0 0 -<br />
1,259,147 1,292,900 1,259,258 1,334,460 41,560 3.2<br />
Cole Hb/E Shore & Valley<br />
D330 Mid. Musq. Progrom 58,939 61,800 51,310 54,240 (7,560) (12.2)<br />
D410 Musq Harbour Program 363,214 348,100 364,447 370,150 22,050 6.3<br />
D420 MH Office & FitnessCtr 91,588 90,000 95,951 91,930 1,930 2.1<br />
D430 Sheet Hbr. Prog. 210,485 203,900 215,455 210,517 6,617 3.2<br />
D440 Sheet Hbr. Fitness Ctr 57,014 63,600 66,400 67,060 3,460 5.4<br />
D620 Pres/LkEcho/LT Prog 81,043 88,100 75,870 83,600 (4,500) (5.1)<br />
D630 Cole Harbour Program 400,338 417,100 407,670 424,190 7,090 1.7<br />
D172 NPCC Prog. & Maint 437,118 453,500 488,052 501,250 47,750 10.5<br />
1,699,739 1,726,100 1,765,155 1,802,937 76,837 4.5<br />
Peninsula<br />
D510 Area Prog. & Maint. 351,522 360,700 365,536 378,070 17,370 4.8<br />
D520 Dixon Maintenance 84,200 85,100 85,100 85,100 0 -<br />
D550 Dixon Program 306,538 323,200 367,049 363,230 40,030 12.4<br />
D560 Needham Maint. 159,800 161,600 161,600 161,600 0 -<br />
D585 BloomfieldProg& Main 146,111 117,100 113,220 116,130 (970) (0.8)<br />
D590 Citadel Prog & Maint. 378,345 374,700 384,841 392,030 17,330 4.6<br />
1,426,516 1,422,400 1,477,346 1,496,160 73,760 5.2<br />
Dartmouth/Eastern Passage<br />
D810 Area Prog. & Maint. 1,017,005 1,030,500 1,013,254 1,084,720 54,220 5.3<br />
D820 Findlay Maintenance 108,270 105,900 110,437 105,900 0 -<br />
D830 NS Hospital Aquatics 8,631 10,300 6,774 10,630 330 3.2<br />
D840 Grant Activities 66,329 50,400 56,720 0 (50,400) (100.0)<br />
1,200,235 1,197,100 1,187,185 1,201,250 4,150 0.3<br />
Progr & Community Dev 8,787,017 8,754,000 8,925,580 8,961,107 207,107 2.4<br />
Arenas<br />
D960 Devonshire Arena 155,899 157,100 158,300 157,900 800 0.5<br />
D970 Le Brun Centre 400,630 409,800 358,400 397,520 (12,280) (3.0)<br />
D980 Gray Arena 245,373 266,600 275,400 277,060 10,460 3.9<br />
D985 Bowles Arena 291,657 295,200 292,700 301,380 6,180 2.1<br />
1,093,560 1,128,700 1,084,800 1,133,860 5,160 0.5<br />
Facility Scheduling<br />
D911 Outdoor - <strong>Book</strong>ings 348,690 351,700 347,800 366,950 15,250 4.3<br />
D912 HRSB - <strong>Book</strong>ings 568,961 521,600 560,000 524,400 2,800 0.5<br />
917,651 873,300 907,800 891,350 18,050 2.1<br />
Arenas & Scheduling 2,011,211 2,002,000 1,992,600 2,025,210 23,210 1.2<br />
Clearing Account REC<br />
D999 Clearing Account Rec 40,289 (163,800) (163,800) (185,100) (21,300) 13.0<br />
40,289 (163,800) (163,800) (185,100) (21,300) 13.0<br />
F28
Community Development<br />
Summary of Gross Expenditures by Division (continued)<br />
2008-2009 2009-2010 2009-2010 2010-2011 Change over<br />
Actual Budget Projections Budget Budget Var as %<br />
Area Services<br />
C220 Riverlake Com. Ctr. 6,922 5,100 5,100 4,700 (400) (7.8)<br />
C230 Waverly Com. Centre 8,194 29,200 29,200 28,650 (550) (1.9)<br />
C250 BLT Rec. Advis. Comm 7,700 7,700 7,700 7,700 0 -<br />
C260 Lockview Ratepayers 6,567 7,300 7,300 7,120 (180) (2.5)<br />
C270 Lucasville Comm. Ctr 9,482 8,600 8,600 7,900 (700) (8.1)<br />
C280 Cole Harb.Pool/Tenni 52 0 0 0 0 -<br />
C290 Upper Sack. Com. Ctr 85,604 0 0 0 0 -<br />
124,520 57,900 57,900 56,070 (1,830) (3.2)<br />
Community Recreation Services 14,380,607 13,991,100 14,171,554 14,277,546 286,446 2.0<br />
Area Rate Services<br />
C105 Sackville Hts El Sch 167,975 183,200 183,200 179,680 (3,520) (1.9)<br />
C106 Prospect Rd Rec Ctr 0 228,200 228,200 228,200 0 -<br />
C107 GlenArb Hme Owners 11,714 18,460 18,460 18,240 (220) (1.2)<br />
C108 White Hill Res Assoc 0 27,200 27,200 27,100 (100) (0.4)<br />
C110 East Preston Rec Ctr 18,730 27,500 27,500 27,500 0 -<br />
C112 Waterstone Neighbour 0 14,100 14,100 14,100 0 -<br />
C115 Mineville Community (10,684) 10,000 10,000 10,000 0 -<br />
C120 Haliburton Hills (8,105) 40,600 40,600 40,300 (300) (0.7)<br />
C125 Beaver Bank Rec Centre 173,587 196,600 196,600 196,600 0 -<br />
C130 Highland Park 6,596 6,600 6,600 6,420 (180) (2.7)<br />
C132 Birch Bear Run HO 0 6,540 6,540 6,540 0 -<br />
C135 Kingswood Ratepayers 355 52,800 52,800 52,800 0 -<br />
C140 Prospect 30,998 67,100 67,100 67,100 0 -<br />
C142 Glengarry Estates HO 0 25,095 25,095 25,095 0 -<br />
C145 Westwood H Res Assoc 10,241 30,700 30,700 30,120 (580) (1.9)<br />
C150 Up. Hammonds Plains 28,851 29,900 29,900 29,900 0 -<br />
C155 Harrietsfield Rec Ct 34,065 28,200 28,200 28,000 (200) (0.7)<br />
C160 Musquodoboit Harbour 7,322 8,500 8,500 7,650 (850) (10.0)<br />
C165 Dutch Settlement 7,276 10,700 10,700 10,700 0 -<br />
C170 Hammonds Plns Com.RT 20,270 56,100 56,100 56,100 0 -<br />
C175 Hubbards Rec. Centre 20,893 32,700 32,700 32,450 (250) (0.8)<br />
C180 Grand Lake Com. Ctr 6,672 15,500 15,500 15,500 0 -<br />
C185 District 3 Cap. Fund (73,444) 0 0 0 0 -<br />
C190 Maplewood Subdivisio 17,803 18,450 18,450 18,450 0 -<br />
C194 Fall River Rec Ctr 0 682,100 682,100 682,100 0 -<br />
C196 Silverside Res.Assoc 16,081 16,300 16,300 16,300 0 -<br />
C198 St. Marg/Fox Hollow (4,925) 6,180 6,180 6,180 0 -<br />
C199 St. Marg Bay Ctr 264,963 270,200 270,200 270,200 0 -<br />
C210 LWF Recreation Ctr 166,153 152,100 152,100 151,960 (140) (0.1)<br />
913,385 2,261,625 2,261,625 2,255,285 (6,340) (0.3)<br />
Total $34,683,892 $35,563,907 $34,957,095 $36,183,684 $619,777 1.7<br />
F29
Community Development<br />
Summary of Gross Revenue by Division<br />
2008-2009 2009-2010 2009-2010 2010-2011 Change over<br />
Actual Budget Projections Budget Budget Var as %<br />
CDBU Administration<br />
C410 Director's Office (1,689) 0 0 0 0 -<br />
C470 Canada Games 2011 (900,353) 0 0 0 0 -<br />
(902,043) 0 0 0 0 -<br />
Market Development<br />
C711 Destination <strong>Halifax</strong> (1,752,856) (1,589,800) (1,589,800) (1,598,200) (8,400) 0.5<br />
(1,752,856) (1,589,800) (1,589,800) (1,598,200) (8,400) 0.5<br />
Facilities<br />
C705 Facility Management (81,841) (81,500) (81,000) (81,900) (400) 0.5<br />
(81,841) (81,500) (81,000) (81,900) (400) 0.5<br />
Community Relations<br />
C730 Cultural Affairs (89) 0 0 (25,000) (25,000) -<br />
C760 Community/CivicEvent (396,736) (252,800) (321,580) (254,100) (1,300) 0.5<br />
C762 Youth Advocate Program (521,049) (610,600) (610,600) (701,900) (91,300) 15.0<br />
C771 BID's Special Projects 0 0 0 (100,000) (100,000) -<br />
D710 Community Developers (23,378) (35,000) (35,000) (122,700) (87,700) 250.6<br />
(941,252) (898,400) (967,180) (1,203,700) (305,300) 34.0<br />
Development Services<br />
C420 Subdivision & Dev. (210,587) (285,900) (194,150) (292,700) (6,800) 2.4<br />
C430 Permits & Inspection (3,767,631) (3,822,100) (2,968,600) (3,297,400) 524,700 (13.7)<br />
C450 Development Engineering (293,325) (253,300) (163,820) (254,700) (1,400) 0.6<br />
(4,271,542) (4,361,300) (3,326,570) (3,844,800) 516,500 (11.8)<br />
Planning Services<br />
C310 Planning & Applic. (59,271) (51,800) (59,257) (57,600) (5,800) 11.2<br />
C320 <strong>Regional</strong> Comm Plann 960 0 (50) 0 0 -<br />
C510 Locked Bus Dist. Com (1,305,260) 0 0 0 -<br />
C511 Downtown Dartmouth BID 0 (177,907) (177,907) (178,000) (93) 0.1<br />
C512 Downtown <strong>Halifax</strong> BID 0 (525,274) (525,274) (525,300) (26) 0.0<br />
C513 Spring Garden Road BID 0 (283,508) (283,508) (283,600) (92) 0.0<br />
C514 Quinpool Road BID 0 (68,159) (68,159) (68,300) (141) 0.2<br />
C515 Spryfield & District BID 0 (40,871) (40,871) (40,900) (29) 0.1<br />
C516 Sackville Drive BID 0 (88,245) (88,245) (88,300) (55) 0.1<br />
C517 Dart Main St BID 0 (74,428) (74,428) (74,600) (172) 0.2<br />
C779 Capital District (88,471) (93,900) (98,235) 0 93,900 (100.0)<br />
(1,452,043) (1,404,092) (1,415,934) (1,316,600) 87,492 (6.2)<br />
Recreation Services<br />
C726 Marketing & Promotions 0 0 (560) 0 0 -<br />
C910 Facility Transfers (167,994) (78,400) (169,000) (78,800) (400) 0.5<br />
D101 Rec. Prog. Admin. 364 0 (10,288) 0 0 -<br />
(167,630) (78,400) (179,848) (78,800) (400) 0.5<br />
Outdoor Recreation<br />
D755 Rec/Enviro Leadership (116,811) (122,900) (140,500) (136,000) (13,100) 10.7<br />
D760 Otd Rec& Env Ser. (365) 0 0 0 0<br />
(117,176) (122,900) (140,500) (136,000) (13,100) 10.7<br />
Aquatic Services<br />
D175 Capt. Will Spry Aquatics (305,393) (287,000) (316,966) (288,500) (1,500) 0.5<br />
D220 Northcliffe Aquatics (463,682) (459,000) (438,903) (461,400) (2,400) 0.5<br />
D320 Bedford Outdoor Pool (51,254) (50,600) (53,347) (50,900) (300) 0.6<br />
D540 Beaches/Common Pool (65,168) (53,000) (52,434) (53,300) (300) 0.6<br />
D570 Needham Aquatics (45,394) (40,200) (50,500) (40,400) (200) 0.5<br />
(930,892) (889,800) (912,150) (894,500) (4,700) 0.5<br />
F30
Community Development<br />
Summary of Gross Revenue by Division (continued)<br />
2008-2009 2009-2010 2009-2010 2010-2011 Change over<br />
Actual Budget Projections Budget Budget Var as %<br />
Mainland South & Area<br />
D155 Area Prog. & Maint. (244,628) (245,500) (244,808) (245,500) 0 -<br />
D160 SMBC Prog. & Maint. (92,581) (88,000) (88,109) (88,000) 0 -<br />
D180 Herring Cv. AreaProg (28,118) (37,000) (37,503) (35,750) 1,250 (3.4)<br />
D170 CWSCC Prog. & Maint. (215,135) (202,500) (215,434) (202,500) 0 -<br />
D176 CWSCC Fitness Ctr (67,500) (83,100) (78,290) (83,100) 0 -<br />
(647,962) (656,100) (664,144) (654,850) 1,250 (0.2)<br />
Mainland N & Western<br />
D210 Area Prog. & Maint. (258,025) (276,200) (276,300) (280,000) (3,800) 1.4<br />
D270 Lakeside Maint. (27,947) 0 (26,700) 0 0 -<br />
D580 St Andrews Prog & Maint. (104,363) (99,600) (119,300) (108,300) (8,700) 8.7<br />
(390,335) (375,800) (422,300) (388,300) (12,500) 3.3<br />
Bedford/Sack/Fall River<br />
D310 BSFR Prog. & Maint. (422,474) (467,400) (462,003) (459,000) 8,400 (1.8)<br />
(422,474) (467,400) (462,003) (459,000) 8,400 (1.8)<br />
Cole Hb/E Shore & Valley<br />
D330 Mid. Musq. Progrom (20,544) (20,200) (16,200) (17,000) 3,200 (15.8)<br />
D410 Musq Harbour Program (79,767) (77,000) (83,700) (81,920) (4,920) 6.4<br />
D420 MH Office & FitnessCtr (33,717) (28,000) (31,500) (30,500) (2,500) 8.9<br />
D430 Sheet Hbr. Prog. (25,774) (25,000) (26,250) (25,500) (500) 2.0<br />
D440 Sheet Hbr. Fitness Ctr (9,208) (9,000) (12,100) (11,000) (2,000) 22.2<br />
D620 Pres/LkEcho/LT Prog (30,665) (33,000) (38,985) (34,000) (1,000) 3.0<br />
D630 Cole Harbour Program (105,190) (105,000) (105,074) (105,000) 0 -<br />
D172 NPCC Prog. & Maint (47,985) (44,000) (48,400) (44,000) 0 -<br />
(352,852) (341,200) (362,209) (348,920) (7,720) 2.3<br />
Peninsula<br />
D510 Area Prog. & Maint. (93,750) (99,500) (92,250) (85,200) 14,300 (14.4)<br />
D550 Dixon Program (88,474) (95,900) (96,460) (94,500) 1,400 (1.5)<br />
D560 Needham Maint. 0 0 (230) 0 0 -<br />
D585 BloomfieldProg& Main (115,524) (50,000) (103,000) (97,000) (47,000) 94.0<br />
D590 Citadel Prog & Maint. (115,677) (100,000) (134,300) (128,500) (28,500) 28.5<br />
(413,425) (345,400) (426,240) (405,200) (59,800) 17.3<br />
Dartmouth/Eastern Passage<br />
D810 Area Prog. & Maint. (322,057) (311,200) (319,359) (366,470) (55,270) 17.8<br />
D820 Findlay Maintenance 0 0 (80) 0 0 -<br />
D830 NS Hospital Aquatics 0 (10,100) (7,450) (10,200) (100) 1.0<br />
D840 Grant Activities (53,250) (50,600) (62,000) 0 50,600 (100.0)<br />
(375,307) (371,900) (388,889) (376,670) (4,770) 1.3<br />
Progr & Community Dev (2,602,354) (2,557,800) (2,725,785) (2,632,940) (75,140) 2.9<br />
Arenas<br />
D960 Devonshire Arena (190,919) (187,700) (198,200) (229,140) (41,440) 22.1<br />
D970 Le Brun Centre (343,173) (351,800) (331,688) (361,450) (9,650) 2.7<br />
D980 Gray Arena (290,317) (321,500) (330,836) (356,360) (34,860) 10.8<br />
D985 Bowles Arena (296,516) (279,300) (286,469) (313,550) (34,250) 12.3<br />
(1,120,924) (1,140,300) (1,147,193) (1,260,500) (120,200) 10.5<br />
Facility Scheduling<br />
D911 Outdoor - <strong>Book</strong>ings (24,881) (31,000) (27,500) (29,200) 1,800 (5.8)<br />
D912 HRSB - <strong>Book</strong>ings (568,961) (521,600) (560,000) (524,400) (2,800) 0.5<br />
(593,842) (552,600) (587,500) (553,600) (1,000) 0.2<br />
Arenas & Scheduling (1,714,766) (1,692,900) (1,734,693) (1,814,100) (121,200) 7.2<br />
Clearing Account REC<br />
D999 Clearing Account Rec (88) 0 0 0 0 -<br />
(88) 0 0 0 0 -<br />
F31
Community Development<br />
Summary of Gross Revenue by Division (continued)<br />
2008-2009 2009-2010 2009-2010 2010-2011 Change over<br />
Actual Budget Projections Budget Budget Var as %<br />
Area Services<br />
C220 Riverlake Com. Ctr. (2,000) 0 0 0 0 -<br />
C230 Waverly Com. Centre 0 (5,400) (5,400) (5,400) 0 -<br />
C290 Upper Sack. Com. Ctr (85,604) 0 0 0 0 -<br />
(87,604) (5,400) (5,400) (5,400) 0 -<br />
Community Recreation Services (5,620,511) (5,347,200) (5,698,376) (5,561,740) (214,540) 4.0<br />
Area Rate Services<br />
C105 Sackville Hts El Sch (201,537) (183,200) (183,200) (179,700) 3,500 (1.9)<br />
C106 Prospect Rd Rec Ctr (207,573) (228,200) (228,200) (228,200) 0 -<br />
C107 GlenArb Hme Owners (16,250) (18,460) (18,460) (18,460) 0 -<br />
C108 White Hill Res Assoc (27,150) (27,200) (27,200) (27,200) 0 -<br />
C110 East Preston Rec Ctr (22,712) (27,500) (27,500) (27,500) 0 -<br />
C112 Waterstone Neighbour 0 (14,100) (14,100) (14,100) 0 -<br />
C115 Mineville Community (9,480) (10,000) (10,000) (10,000) 0 -<br />
C120 Haliburton Hills (39,794) (40,600) (40,600) (40,600) 0 -<br />
C125 Beaver Bank Rec Centre (193,753) (196,600) (196,600) (196,600) 0 -<br />
C130 Highland Park (5,850) (6,600) (6,600) (6,600) 0 -<br />
C132 Birch Bear Run HO 0 (6,540) (6,540) (6,540) 0 -<br />
C135 Kingswood Ratepayers (52,800) (52,800) (52,800) (52,800) 0 -<br />
C140 Prospect (66,301) (67,100) (67,100) (67,100) 0 -<br />
C142 Glengarry Estates HO 0 (25,095) (25,095) (25,095) 0 -<br />
C145 Westwood H Res Assoc (27,600) (30,700) (30,700) (30,700) 0 -<br />
C150 Up. Hammonds Plains (31,261) (29,900) (29,900) (29,900) 0 -<br />
C155 Harrietsfield Rec Ct (25,970) (28,200) (28,200) (28,200) 0 -<br />
C160 Musquodoboit Harbour (7,354) (8,500) (8,500) (8,500) 0 -<br />
C165 Dutch Settlement (10,569) (10,700) (10,700) (10,700) 0 -<br />
C170 Hammonds Plns Com.RT (53,716) (56,100) (56,100) (56,100) 0 -<br />
C175 Hubbards Rec. Centre (28,550) (32,700) (32,700) (32,700) 0 -<br />
C180 Grand Lake Com. Ctr (14,832) (15,500) (15,500) (15,500) 0 -<br />
C190 Maplewood Subdivisio (18,450) (18,450) (18,450) (18,450) 0 -<br />
C194 Fall River Rec Ctr (612,366) (682,100) (682,100) (682,100) 0 -<br />
C196 Silverside Res.Assoc (16,200) (16,300) (16,300) (16,300) 0 -<br />
C198 St. Marg/Fox Hollow (6,180) (6,180) (6,180) (6,180) 0 -<br />
C199 St. Marg Bay Ctr (264,844) (270,200) (270,200) (270,200) 0 -<br />
C210 LWF Recreation Ctr (165,503) (152,100) (152,100) (152,100) 0 -<br />
(2,126,596) (2,261,625) (2,261,625) (2,258,125) 3,500 (0.2)<br />
Total (17,148,683) (15,943,917) (15,340,485) (15,865,065) 78,852 (0.5)<br />
F32
Community Development<br />
Summary of Net Expenditures by Division<br />
2008-2009 2009-2010 2009-2010 2010-2011 Change over<br />
Actual Budget Projections Budget Budget Var as %<br />
CDBU Administration<br />
C410 Director's Office 318,977 378,590 344,831 347,947 (30,643) (8.1)<br />
C412 2011 CWG Project Off 39,010 18,000 139,719 18,350 350 1.9<br />
M691 VIK - Special Events 10,665 0 14,500 0 0 -<br />
368,652 396,590 499,050 366,297 (30,293) (7.6)<br />
Market Development<br />
C711 Destination <strong>Halifax</strong> 403,550 401,600 401,600 401,600 0 -<br />
403,550 401,600 401,600 401,600 0 -<br />
Facilities<br />
C705 Facility Management 1,078,075 1,266,100 1,297,630 1,317,302 51,202 4.0<br />
1,078,075 1,266,100 1,297,630 1,317,302 51,202 4.0<br />
Community Relations<br />
A811 Community Grants 136,954 141,800 144,260 140,910 (890) (0.6)<br />
C730 Cultural Affairs 397,252 572,800 553,880 560,920 (11,880) (2.1)<br />
C760 Community/CivicEvent 1,010,542 985,500 977,718 997,110 11,610 1.2<br />
C762 Youth Advocate Program 5,814 (200) (200) (26,638) (26,438) 13,218.8<br />
C764 Cultural Development 0 0 0 (23,500) (23,500) -<br />
C770 Buildings/Operations 97,488 136,600 117,801 103,470 (33,130) (24.3)<br />
C771 BID's Special Projects 0 0 0 100,000 100,000 -<br />
D710 Community Developers 1,059,954 1,110,100 984,610 1,218,854 108,754 9.8<br />
2,708,003 2,946,600 2,778,069 3,071,126 124,526 4.2<br />
Development Services<br />
C420 Subdivision & Dev. 2,153,448 2,099,700 2,157,432 2,169,730 70,030 3.3<br />
C430 Permits & Inspection (936,863) (716,900) (181,550) (167,539) 549,361 (76.6)<br />
C450 Development Engineering 851,110 893,600 947,680 934,161 40,561 4.5<br />
2,067,695 2,276,400 2,923,562 2,936,352 659,952 29.0<br />
Planning Services<br />
C310 Planning & Applic. 1,805,371 2,018,900 1,916,655 2,374,919 356,019 17.6<br />
C320 <strong>Regional</strong> Comm Plann 851,299 879,400 810,657 1,138,057 258,657 29.4<br />
C340 Planning Services 10 0 0 0 0 -<br />
C510 Locked Bus Dist. Com 0 0 0 0 0 -<br />
C779 Capital District 705,667 790,500 516,209 0 (790,500) (100.0)<br />
3,362,347 3,688,800 3,243,521 3,512,976 (175,824) (4.8)<br />
Recreation Services<br />
C726 Marketing & Promotions 186,627 172,900 159,324 117,600 (55,300) (32.0)<br />
C910 Facility Transfers 330,000 319,600 330,000 326,900 7,300 2.3<br />
D101 Rec. Prog. Admin. 925,849 972,000 880,770 916,830 (55,170) (5.7)<br />
D103 Recreation Equipment 1,225 0 0 0 0 -<br />
D104 LEED's Facilities 31,500 31,500 24,485 56,065 24,565 78.0<br />
1,475,201 1,496,000 1,394,579 1,417,395 (78,605) (5.3)<br />
Outdoor Recreation<br />
D755 Rec/Enviro Leadership 269,346 263,500 273,828 289,104 25,604 9.7<br />
D760 Otd Rec& Env Ser. (927) 0 0 0 0 -<br />
268,419 263,500 273,828 289,104 25,604 9.7<br />
Aquatic Services<br />
D175 Capt. Will Spry Aquatics 48,707 48,100 37,653 73,360 25,260 52.5<br />
D220 Northcliffe Aquatics (66,297) (42,000) (48,124) (31,450) 10,550 (25.1)<br />
D320 Bedford Outdoor Pool 15,445 17,700 12,953 23,680 5,980 33.8<br />
D540 Beaches/Common Pool 376,278 360,200 351,520 420,660 60,460 16.8<br />
D570 Needham Aquatics 84,119 106,400 104,367 118,210 11,810 11.1<br />
458,251 490,400 458,369 604,460 114,060 23.3<br />
Mainland South & Area<br />
D155 Area Prog. & Maint. 279,717 275,500 303,743 306,085 30,585 11.1<br />
D160 SMBC Prog. & Maint. 93,510 93,500 94,134 49,545 (43,955) (47.0)<br />
D165 CLCC Maint. 108,500 109,700 109,700 109,700 0 -<br />
D180 Herring Cv. AreaProg 131,685 109,800 122,777 146,105 36,305 33.1<br />
D170 CWSCC Prog. & Maint. 508,135 509,700 519,002 424,965 (84,735) (16.6)<br />
D176 CWSCC Fitness Ctr (26,039) (37,900) (36,905) (36,260) 1,640 (4.3)<br />
1,095,508 1,060,300 1,112,451 1,000,140 (60,160) (5.7)<br />
F33
Community Development<br />
Summary of Net Expenditures by Division (continued)<br />
2008-2009 2009-2010 2009-2010 2010-2011 Change over<br />
Actual Budget Projections Budget Budget Var as %<br />
Mainland N & Western<br />
D210 Area Prog. & Maint. 497,574 419,700 455,653 461,290 41,590 9.9<br />
D230 Northcliffe Maint. 255,414 258,100 258,100 259,500 1,400 0.5<br />
D270 Lakeside Maint. 55,354 84,200 57,500 84,600 400 0.5<br />
D580 St Andrews Prog & Maint. 259,234 261,300 266,488 277,620 16,320 6.2<br />
1,067,575 1,023,300 1,037,741 1,083,010 59,710 5.8<br />
Bedford/Sack/Fall River<br />
D310 BSFR Prog. & Maint. 787,214 782,400 749,542 832,360 49,960 6.4<br />
D340 Fall River Rec. Ctr. 48,221 43,100 47,713 43,100 0 -<br />
D975 Bedford Leisure Club 1,237 0 0 0 0 -<br />
836,673 825,500 797,255 875,460 49,960 6.1<br />
Cole Hb/E Shore & Valley<br />
D330 Mid. Musq. Progrom 38,394 41,600 35,110 37,240 (4,360) (10.5)<br />
D410 Musq Harbour Program 283,447 271,100 280,747 288,230 17,130 6.3<br />
D420 MH Office & FitnessCtr 57,870 62,000 64,451 61,430 (570) (0.9)<br />
D430 Sheet Hbr. Prog. 184,711 178,900 189,205 185,017 6,117 3.4<br />
D440 Sheet Hbr. Fitness Ctr 47,806 54,600 54,300 56,060 1,460 2.7<br />
D620 Pres/LkEcho/LT Prog 50,377 55,100 36,885 49,600 (5,500) (10.0)<br />
D630 Cole Harbour Program 295,148 312,100 302,596 319,190 7,090 2.3<br />
D172 NPCC Prog. & Maint 389,133 409,500 439,652 457,250 47,750 11.7<br />
1,346,888 1,384,900 1,402,946 1,454,017 69,117 5.0<br />
Peninsula<br />
D510 Area Prog. & Maint. 257,771 261,200 273,286 292,870 31,670 12.1<br />
D520 Dixon Maintenance 84,200 85,100 85,100 85,100 0 -<br />
D550 Dixon Program 218,064 227,300 270,589 268,730 41,430 18.2<br />
D560 Needham Maint. 159,800 161,600 161,370 161,600 0 -<br />
D585 BloomfieldProg& Main 30,587 67,100 10,220 19,130 (47,970) (71.5)<br />
D590 Citadel Prog & Maint. 262,669 274,700 250,541 263,530 (11,170) (4.1)<br />
1,013,091 1,077,000 1,051,106 1,090,960 13,960 1.3<br />
Dartmouth/Eastern Passage<br />
D810 Area Prog. & Maint. 694,948 719,300 693,895 718,250 (1,050) (0.1)<br />
D820 Findlay Maintenance 108,270 105,900 110,357 105,900 0 -<br />
D830 NS Hospital Aquatics 8,631 200 (676) 430 230 115.0<br />
D840 Grant Activities 13,079 (200) (5,280) 0 200 (100.0)<br />
824,928 825,200 798,296 824,580 (620) (0.1)<br />
Progr & Community Dev 6,184,662 6,196,200 6,199,795 6,328,167 131,967 2.1<br />
Arenas<br />
D960 Devonshire Arena (35,020) (30,600) (39,900) (71,240) (40,640) 132.8<br />
D970 Le Brun Centre 57,457 58,000 26,712 36,070 (21,930) (37.8)<br />
D980 Gray Arena (44,944) (54,900) (55,436) (79,300) (24,400) 44.4<br />
D985 Bowles Arena (4,858) 15,900 6,231 (12,170) (28,070) (176.5)<br />
(27,364) (11,600) (62,393) (126,640) (115,040) 991.7<br />
Facility Scheduling<br />
D911 Outdoor - <strong>Book</strong>ings 323,809 320,700 320,300 337,750 17,050 5.3<br />
323,809 320,700 320,300 337,750 17,050 5.3<br />
Arenas & Scheduling 296,444 309,100 257,907 211,110 (97,990) (31.7)<br />
Clearing Account REC<br />
D999 Clearing Account Rec 40,201 (163,800) (163,800) (185,100) (21,300) 13.0<br />
40,201 (163,800) (163,800) (185,100) (21,300) 13.0<br />
Area Services<br />
C220 Riverlake Com. Ctr. 4,922 5,100 5,100 4,700 (400) (7.8)<br />
C230 Waverly Com. Centre 8,194 23,800 23,800 23,250 (550) (2.3)<br />
C250 BLT Rec. Advis. Comm 7,700 7,700 7,700 7,700 0 -<br />
C260 Lockview Ratepayers 6,567 7,300 7,300 7,120 (180) (2.5)<br />
C270 Lucasville Comm. Ctr 9,482 8,600 8,600 7,900 (700) (8.1)<br />
C280 Cole Harb.Pool/Tenni 52 0 0 0 0 -<br />
36,916 52,500 52,500 50,670 (1,830) (3.5)<br />
F34
Community Development<br />
Summary of Net Expenditures by Division (continued)<br />
2008-2009 2009-2010 2009-2010 2010-2011 Change over<br />
Actual Budget Projections Budget Budget Var as %<br />
Community Recreation Services 8,760,096 8,643,900 8,473,178 8,715,806 71,906 0.8<br />
Area Rate Services<br />
C105 Sackville Hts El Sch (33,562) 0 0 (20) (20) -<br />
C106 Prospect Rd Rec Ctr (207,573) 0 0 0 0 -<br />
C107 GlenArb Hme Owners (4,536) 0 0 (220) (220) -<br />
C108 White Hill Res Assoc (27,150) 0 0 (100) (100) -<br />
C110 East Preston Rec Ctr (3,982) 0 0 0 0 -<br />
C115 Mineville Community (20,164) 0 0 0 0 -<br />
C120 Haliburton Hills (47,899) 0 0 (300) (300) -<br />
C125 Beaver Bank Rec Centre (20,166) 0 0 0 0 -<br />
C130 Highland Park 746 0 0 (180) (180) -<br />
C135 Kingswood Ratepayers (52,445) 0 0 0 0 -<br />
C140 Prospect (35,303) 0 0 0 0 -<br />
C145 Westwood H Res Assoc (17,359) 0 0 (580) (580) -<br />
C150 Up. Hammonds Plains (2,410) 0 0 0 0 -<br />
C155 Harrietsfield Rec Ct 8,095 0 0 (200) (200) -<br />
C160 Musquodoboit Harbour (31) 0 0 (850) (850) -<br />
C165 Dutch Settlement (3,293) 0 0 0 0 -<br />
C170 Hammonds Plns Com.RT (33,447) 0 0 0 0 -<br />
C175 Hubbards Rec. Centre (7,657) 0 0 (250) (250) (625,100.0)<br />
C180 Grand Lake Com. Ctr (8,161) 0 0 0 0 -<br />
C185 District 3 Cap. Fund (73,444) 0 0 0 0 -<br />
C190 Maplewood Subdivisio (647) 0 0 0 0 -<br />
C194 Fall River Rec Ctr (612,366) 0 0 0 0 -<br />
C196 Silverside Res.Assoc (119) 0 0 0 0 -<br />
C198 St. Marg/Fox Hollow (11,105) 0 0 0 0 -<br />
C199 St. Marg Bay Ctr 120 0 0 0 0 -<br />
C210 LWF Recreation Ctr 649 0 0 (140) (140) -<br />
(1,213,210) 0 0 (2,840) (2,840) (7,100,100.0)<br />
Total $17,535,210 $19,619,990 $19,616,610 $20,318,619 $698,629 3.6<br />
F35
Community Development<br />
Summary by Expenditure & Revenue Types<br />
2008-2009 2009-2010 2009-2010 2010-2011 Change over<br />
Actual Budget Projections Budget Budget Var as %<br />
Expenditures<br />
Compensation & Benefits 20,325,498 20,094,400 19,912,814 21,298,100 1,203,700 6.0<br />
Office 893,427 770,550 690,263 614,465 (156,085) (20.3)<br />
Professional Fees 243,442 22,500 38,821 13,300 (9,200) (40.9)<br />
Legal & Consulting Fees 25,405 136,200 200,190 147,103 10,903 8.0<br />
External Services 1,046,861 1,978,260 1,942,044 1,058,970 (919,290) (46.5)<br />
Uniforms & Clothing 35,197 48,500 29,786 33,500 (15,000) (30.9)<br />
Salt 35 0 0 0 0 -<br />
Supplies & Materials 399,165 375,700 330,223 345,830 (29,870) (8.0)<br />
Utilities 222,597 216,600 209,750 217,800 1,200 0.6<br />
Building Costs 178,755 331,880 289,374 253,880 (78,000) (23.5)<br />
Equipment & Communications 311,530 245,400 203,144 199,010 (46,390) (18.9)<br />
Vehicle Expense 195,767 181,500 160,050 172,400 (9,100) (5.0)<br />
Travel 305,035 220,600 212,621 190,279 (30,321) (13.7)<br />
Training & Education 92,492 106,750 50,247 89,250 (17,500) (16.4)<br />
Facilities Rental 396,208 426,800 406,780 402,000 (24,800) (5.8)<br />
Advertising & Promotion 178,377 172,050 151,606 134,885 (37,165) (21.6)<br />
Other Goods & Services 1,695,128 1,863,740 1,823,081 2,041,347 177,607 9.5<br />
Interdepartmental 2,810,956 2,800,400 2,843,698 2,691,548 (108,852) (3.9)<br />
Debt-Interest 191,141 187,700 187,700 472,400 284,700 151.7<br />
Debt Principal 292,362 292,300 292,300 699,200 406,900 139.2<br />
Transfer Outside Agencies 4,388,577 4,118,541 4,198,426 4,154,875 36,334 0.9<br />
Insurance Costs 14,409 15,200 15,200 18,200 3,000 19.7<br />
Grants & Tax Concessions 830,363 2,057,200 2,062,700 1,091,200 (966,000) (47.0)<br />
Transfer to/from Reserves 25,000 (1,050,000) (1,244,859) (266,683) 783,317 (74.6)<br />
Provision for Allowance 22,320 37,751 37,751 37,790 39 0.1<br />
Other Fiscal 22,715 79,635 79,635 85,635 6,000 7.5<br />
Prior year Surplus/Deficit (458,868) (166,250) (166,250) (12,600) 153,650 (92.4)<br />
Expenditures 34,683,892 35,563,907 34,957,095 36,183,684 619,777 1.7<br />
Total $34,683,892 $35,563,907 $34,957,095 $36,183,684 $619,777 1.7<br />
Revenues<br />
Tax Revenues (215,800) (1,447,692) (1,447,692) (1,448,300) (608) 0.0<br />
Area Rate Revenue (3,169,756) (2,072,325) (2,072,325) (2,068,825) 3,500 (0.2)<br />
Transfers from other Gov'ts (521,049) (610,600) (610,600) (701,900) (91,300) 15.0<br />
Fines and Fees (48,553) (44,000) (68,200) (60,000) (16,000) 36.4<br />
Licenses & Permits (4,113,326) (4,276,400) (3,250,205) (3,744,800) 531,600 (12.4)<br />
Rental & Leasing (1,495,414) (1,341,900) (1,518,461) (1,370,170) (28,270) 2.1<br />
Recreational Revenue (3,959,689) (3,864,100) (3,947,057) (4,041,070) (176,970) 4.6<br />
Sales Revenue (319,731) (252,300) (226,866) (245,000) 7,300 (2.9)<br />
Other Revenue (3,305,365) (2,034,600) (2,199,079) (2,185,000) (150,400) 7.4<br />
Revenues (17,148,683) (15,943,917) (15,340,485) (15,865,065) 78,852 (0.5)<br />
Total (17,148,683) (15,943,917) (15,340,485) (15,865,065) 78,852 (0.5)<br />
Net Cost $17,535,210 $19,619,990 $19,616,610 $20,318,619 $698,629 3.6<br />
F36
<strong>Halifax</strong> <strong>Regional</strong> <strong>Municipality</strong><br />
2010/11 Business Plans and Budget (Proposed) Finance<br />
Finance<br />
Business Plan - 2010/11
<strong>Halifax</strong> <strong>Regional</strong> <strong>Municipality</strong><br />
2010/11 Business Plans and Budget (Proposed) Finance<br />
Mission: Leading Financial Stewardship<br />
We lead financial stewardship through advice, services and policy.<br />
Business Unit Overview:<br />
Finance leads HRM’s Fiscal Health & Accountability activities in support of the Executive<br />
Management Team’s priority areas and provides services and advice to internal clients, Council<br />
and residents of HRM.<br />
Chief Financial<br />
Officer/Director:<br />
Revenue Operations<br />
Manager<br />
Jerry Blackwood, CGA<br />
Accounting<br />
Operations Manager<br />
Louis de Montbrun, CA<br />
Procurement & Stores<br />
Operations Manager<br />
Anne Feist, CPPB<br />
Payroll Operations<br />
Manager<br />
Kevin Hislop<br />
Budget & Financial<br />
Analysis Manager<br />
Paul Fleming, MBA,<br />
CHRP<br />
Fiscal & Tax Policy<br />
Manager<br />
Bruce Fisher, MPA,<br />
CMA<br />
Cathie O’Toole, CGA<br />
Prepare billings; collect all revenues, administration of Animal Control and<br />
False Alarms By-Laws, Local Improvement Charges, Tax Sales, and<br />
Parking Regulations.<br />
Accounts Payable Processing, Asset and Project Accounting, Claims<br />
preparation, Banking, Payroll Accounting, Service Delivery and Financial<br />
Reporting. Year-end audited financial statements, ensuring HRM complies<br />
with industry and legislative financial reporting requirements for<br />
<strong>Operating</strong>, Capital, Trust Funds and Reserves.<br />
Procurement services including purchasing, inventory, storage and<br />
disposal, coordination of contracts and contract administration. Supply<br />
eight (8) fuelling stations and four (4) salt sheds.<br />
Responsible to provide all payroll related functions to HRM employees,<br />
Business Units and Boards and Commissions. Some of the services<br />
provided to clients include time and attendance tracking, payroll/benefits<br />
administration, bi-weekly payroll production, year end T4 production,<br />
labour and equipment costing, and providing policy /collective agreement<br />
interpretation and monitoring as related to payroll issues.<br />
Manages the <strong>Operating</strong>, Capital and Reserve Budget processes, and<br />
provides customer service and stewardship support to Business Units<br />
through business analysis and financial consulting staff. Provides financial<br />
advice and analysis, ensuring compliance with HRM policies and<br />
legislation, in support of Council, EMT and Business Unit decision<br />
making.<br />
Develops, defines and refines policies related to fiscal management,<br />
financial planning, debt policy, and taxation. Provides strategic support to<br />
corporate policy initiatives such as <strong>Regional</strong> Planning and leads the Multi<br />
Year Financial Strategy. HRM Finance lead on economic prosperity<br />
objectives. Provides advice and support to business units involved in policy<br />
and program delivery regarding grants.<br />
G2
<strong>Halifax</strong> <strong>Regional</strong> <strong>Municipality</strong><br />
2010/11 Business Plans and Budget (Proposed) Finance<br />
Corporate Reporting<br />
& Financial Policy<br />
Manager<br />
Pamela Caswill, CA<br />
Summary of Business<br />
Unit Structure<br />
Changes:<br />
Researches, analyses and recommends financial reporting and performance<br />
standards, processes and policies. In conjunction with the Treasurer, the<br />
Investment team guides the long and short term investment policy of the<br />
<strong>Municipality</strong> and provides leadership and control to the overall process<br />
through cash management performance measurement. Provides<br />
stewardship over the banking applications used by HRM and its related<br />
organizations and leads the Disaster Financial Recovery claims process as<br />
required.<br />
• No changes.<br />
Core Operations and Services provided:<br />
• Accounts Payable Processing<br />
• Project and Asset Accounting<br />
• FTE Position Management<br />
• Financial Reporting and Expenditure Analysis<br />
• Council Report Review and Support<br />
• Payroll Operations<br />
• Procurement & Stores Operations<br />
• Inventory Control<br />
• Corporate Financial Planning & Budget Process Management<br />
• Bylaw Registration and Administration, eg: False Alarms, Parking Meters<br />
• Area Rate Analysis and Administration<br />
• Coin Processing<br />
• Collective Agreement Costing<br />
• Job Costing<br />
• Fiscal and Tax Policy<br />
• Revenue & Tax Billing and Collection<br />
• Financial Analysis & Consulting<br />
• Customer Services & Inquiries<br />
• Parking Ticket Enforcement<br />
• HRM Investments & Cash Management<br />
• Banking Relationships & Coordination<br />
• Disaster Financial Assistance Claims Support<br />
• Financial Policy Development & Implementation<br />
G3
<strong>Halifax</strong> <strong>Regional</strong> <strong>Municipality</strong><br />
2010/11 Business Plans and Budget (Proposed) Finance<br />
Funded Full Time Equivalents (FTEs):<br />
Funded FTEs (includes full and<br />
part-time permanent positions)<br />
2008/09 2009/10 2010/11<br />
(Approved) (Approved) (Proposed)<br />
188 203.5 204<br />
Analysis of <strong>Operating</strong> Budget Changes:<br />
<strong>Operating</strong> Budget Change Details<br />
($000's)<br />
2009/10 Budget $4,074<br />
1 Compensation and Benefits 671<br />
2 Fines and Fees (2,609)<br />
3 Printing and Reproduction (76)<br />
4 Other Goods and Services (105)<br />
5 Contract Services 122<br />
2010/11 Budget $2,077<br />
Key Challenges and Opportunities<br />
The following challenges and opportunities will have an impact on the Business Unit between<br />
the 2010-2015 time frame..<br />
Challenges with Community-wide Impact:<br />
These are challenges or opportunities which affect the entire HRM Region, and which the<br />
Business Unit plays a role in influencing or addressing the outcome. Multiple business units may<br />
be involved in addressing the issue.<br />
Economic Prosperity: Providing support and developing financial approaches to help<br />
achieve HRM’s economic prosperity objectives.<br />
Long Term Fiscal Sustainability: Providing strategies to ensure sustainable and cost<br />
effective delivery of existing municipal services to residents and other taxpayers; and<br />
meet new service demands. The budget and business planning process is the key<br />
mechanism to determine service and funding levels. During the next 2 - 3 fiscal years it<br />
will be increasingly difficult to devise funding strategies, and it may be necessary to realign<br />
services to meet funding levels.<br />
G4
<strong>Halifax</strong> <strong>Regional</strong> <strong>Municipality</strong><br />
2010/11 Business Plans and Budget (Proposed) Finance<br />
Misunderstanding and Inequities within the current tax structure: The HRM Citizen<br />
Survey identified taxation and tax levels as a substantial concern for residents.<br />
Challenges with Service Delivery / Business Unit Impact<br />
These are issues which affect the business unit’s ability to deliver services (both internally and<br />
externally).<br />
Operationalizing Tangible Capital Asset Accounting: With the implementation of<br />
Tangible Capital Assets Accounting and Reporting in 09/10, new processes were<br />
developed with business unit stakeholders and these processes will continue to evolve<br />
during 10/11, including the implementation of the asset accounting module of SAP and a<br />
middleware application to link the source asset data to SAP.<br />
Revenue Tools Benefits Realization: Completion of the outstanding Hansen system<br />
modification requests and on-going support to realize all of the benefits of the new<br />
technology.<br />
Physical Moves: Although final outcomes surrounding new space for Finance with<br />
Corporate Accommodations remains uncertain, the 3rd Floor Duke Tower Finance staff is<br />
the business unit being considered to relocate to space in Alderney Gate, Dartmouth to<br />
achieve organizational cost savings. A move will cause disruption and will have an<br />
impact on the possible 130+ staff involved. The opening of the new Ragged Lake Transit<br />
Centre and changes at the Turner Drive stores location impacts many other Finance<br />
employees as well.<br />
Opportunities:<br />
• Maximizing existing technologies: Achieving improvements to our existing systems and<br />
enhancing the use of technology will create improved analysis and efficiencies.<br />
• Building financial capability in other business units: Build on our own inventory of<br />
knowledge and enhance relationships and build financial capacity within other business units.<br />
Continue to develop and formalize policies and guidelines.<br />
• Continue to build our Management Team: Continue to encourage a collaborative and<br />
open environment where we work as a team supporting each other through trust, advice and open<br />
communications.<br />
• Financial reporting improvements: Ongoing review, development and improvement of<br />
financial information, reporting, business processes and policies will result in improved service<br />
delivery to clients and the public.<br />
G5
<strong>Halifax</strong> <strong>Regional</strong> <strong>Municipality</strong><br />
2010/11 Business Plans and Budget (Proposed) Finance<br />
The goals for the FINANCE are:<br />
Business Unit Goals<br />
Goal 1:<br />
Goal 2:<br />
Goal 3:<br />
Goal 4:<br />
Goal 5:<br />
Improved Employee Engagement and Satisfaction<br />
Improved Financial Information<br />
Promote Fiscal Health & Accountability<br />
Optimize use of Skills and Technology<br />
Meet Internal Service Expectations<br />
Goal 1:<br />
Improved Employee Engagement and Satisfaction<br />
Corporate Strategy Linkage:<br />
EMT Priorities: Making HRM an Employer of Choice<br />
Description:<br />
Enhance staff retention, recruitment and succession planning. Develop staff and future leaders<br />
through internal and external training, mentoring, rewarding excellence, communications and<br />
creating a positive work environment.<br />
Goal 1:<br />
Improved Employee Engagement and Satisfaction<br />
Objectives for 2010/2011:<br />
FIN 1.1 Encourage a professional, positive, supportive and challenging work<br />
environment through the continued implementation of: orientation materials,<br />
employee feedback tools, targeted professional development, training plans and<br />
clearly identified roles and performance expectations.<br />
FIN 1.2 Recognize and reward employees and teams and ensure their achievements and<br />
acknowledgements are documented in personnel files where appropriate.<br />
FIN 1.3 Improve internal and external communications with regular team meetings,<br />
annual employee sessions, and updated intranet and internet content.<br />
Objectives for the next 3-5 years:<br />
FIN 1.4<br />
FIN 1.5<br />
FIN 1.6<br />
Develop internal training opportunities for Finance staff through regular lunch<br />
and learns.<br />
Implement the workforce planning initiative with Human Resources that will<br />
help to identify knowledge, skills and experience and analyze our business unit’s<br />
workforce needs.<br />
Identify, motivate and develop future talent in Finance. Establish training plans<br />
and opportunities for these individuals through the PDP process, succession<br />
planning and workforce planning.<br />
G6
<strong>Halifax</strong> <strong>Regional</strong> <strong>Municipality</strong><br />
2010/11 Business Plans and Budget (Proposed) Finance<br />
Goal 2:<br />
Improved Financial Information<br />
Corporate Strategy Linkage:<br />
EMT Priorities: Practising Fiscal Responsibility, Providing Excellence in Service Delivery<br />
Description:<br />
Service delivery to clients and the public will benefit from review, development and<br />
improvement of financial information, business processes and policies.<br />
Goal 2:<br />
Improved Financial Information<br />
Objectives for 2010/2011:<br />
FIN 2.1 Continue to improve reporting and assist in developing processes to address<br />
specific needs identified by internal and external clients.<br />
FIN 2.2 Roll-out the methodology to conduct cost analysis of programs and services that<br />
can be used by business units.<br />
FIN 2.3 Continue training and education for business units on use of SAP, financial<br />
business processes and policies. Further enhance relationships with business<br />
units.<br />
FIN 2.4 Ensure requirements for the new request for proposal for banking services are<br />
drafted and a process for submissions and review is underway as the current<br />
banking agreement expires in Fall 2011.<br />
FIN 2.5 Develop a project budget revision process, including information on appropriate<br />
sign-offs and Tangible Capital Asset implications.<br />
FIN 2.6 Continue to document financial reporting, funding claim submission<br />
requirements and business processes for cost sharing agreements including: Gas<br />
Tax, Public Transit, Municipal Rural Infrastructure Fund Program and Build<br />
Canada.<br />
FIN 2.7 Develop a plan to increase public availability of HRM’s financial information<br />
through an electronic format.<br />
Objectives for the next 3-5 years:<br />
FIN 2.8<br />
FIN 2.9<br />
FIN 2.10<br />
Continue to develop and document business processes, work flow and guidelines<br />
and create manuals for each division and operational area.<br />
Develop a process to include financial projections on projects.<br />
Identify key policies and practices required to be developed and completed.<br />
G7
<strong>Halifax</strong> <strong>Regional</strong> <strong>Municipality</strong><br />
2010/11 Business Plans and Budget (Proposed) Finance<br />
Goal 3:<br />
Promote Fiscal Health & Accountability<br />
Corporate Strategy Linkage:<br />
EMT Priorities: Practicing Fiscal Responsibility, Providing Excellence in Service Delivery<br />
Community Outcome Areas: Foster Economic Prosperity<br />
Description:<br />
Finance is the lead on the Corporate Fiscal Responsibility Strategy. Finance will continue to<br />
implement Corporate Asset Accounting, update policies such as the Multi Year Financial<br />
Strategy and Council’s direction on HRM’s overall Financial Strategy, and continue to document<br />
business processes and enhance controls. Finance also has an important role in furthering<br />
Economic Prosperity objectives.<br />
Goal 3:<br />
Promote Fiscal Health & Accountability<br />
Objectives for 2010/2011:<br />
FIN 3.1<br />
FIN 3.2<br />
Create a clear long term approach to the Multi-year Financial Strategy.<br />
Develop and improve options for Reserves and Capital Strategy.<br />
FIN 3.3 Incorporate Tangible Capital Asset and project budgeting and reporting into the<br />
Multi-Year Financial Strategy<br />
FIN 3.4 Work with project managers in Infrastructure and Asset Management as well as<br />
other business units to develop clear roles, responsibilities and accountabilities<br />
around project reporting, approvals and cost-sharing. Ensure expectations<br />
around infrastructure reporting and financial aspects of capital project<br />
management are well understood.<br />
FIN 3.5 Support Economic Prosperity. Develop options supporting investment in<br />
downtown.<br />
Objectives for the next 3-5 years:<br />
FIN 3.6<br />
FIN 3.7<br />
FIN 3.8<br />
Develop and refine the capacity to provide multi-year operational budgets and<br />
projects.<br />
Review the non-profit tax exemption program<br />
Analyze financial implications of new programs, services and resource<br />
requirements.<br />
G8
<strong>Halifax</strong> <strong>Regional</strong> <strong>Municipality</strong><br />
2010/11 Business Plans and Budget (Proposed) Finance<br />
Goal 4:<br />
Optimize use of Skills and Technology<br />
Corporate Strategy Linkage:<br />
EMT Priorities: Providing Excellence in Service Delivery<br />
Description:<br />
Build knowledge and skills with technology and identify opportunities for enhancement.<br />
Goal 4:<br />
Optimize use of Skills and Technology<br />
Objectives for 2010/2011:<br />
FIN 4.1 Develop a technology plan and approach for Finance by exploring the<br />
functionality potential of our current enterprise systems such as SAP and Hansen.<br />
FIN 4.2 Review of information technology requests to ensure priority areas are being<br />
addressed.<br />
FIN 4.3 Implement, as appropriate, the technology “quick hits” that were identified in the<br />
Business Process and Quality Assurance review reports.<br />
FIN 4.4 Participation in education, awareness and/or training sessions on technology<br />
security and new desktop applications that are planned to roll out from BPIM.<br />
Objectives for the next 3-5 years:<br />
FIN 4.5<br />
FIN 4.6<br />
FIN 4.7<br />
Investigate opportunities and costs to implement our technology plan.<br />
Identify the technology, skills and training requirements for key positions.<br />
Ongoing use and development of future business analyst positions in Finance.<br />
Goal 5:<br />
Meet Internal Service Expectations<br />
Corporate Strategy Linkage:<br />
EMT Priorities: Providing Excellence in Service Delivery<br />
Description:<br />
Finance is committed to meeting the Internal Service Expectations agreed upon from other<br />
Business Units.<br />
G9
<strong>Halifax</strong> <strong>Regional</strong> <strong>Municipality</strong><br />
2010/11 Business Plans and Budget (Proposed) Finance<br />
Goal 5:<br />
Meet Internal Service Expectations<br />
Objectives for 2010/2011:<br />
FIN5.1<br />
FIN 5.2<br />
FIN 5.3<br />
FIN 5.4<br />
Ongoing staff participation in several corporate initiatives and committees such<br />
as the Capital Steering Committee, Employee Recognition Committee,<br />
Community Visioning, Sustainability-Green Team, Labour Management<br />
Committee, Asset Management Strategy, Central Library Steering Committee,<br />
Diversity Strategy, Corporate Safety and the <strong>Regional</strong> Plan Review.<br />
Offer consultation and support to roll out new Corporate Policies and Initiatives.<br />
Financial support, expertise, advice and analysis to business units as<br />
requested/required.<br />
Ensure resources are available for an increased level of reports anticipated to be<br />
processed through FinTrack .<br />
G10
<strong>Halifax</strong> <strong>Regional</strong> <strong>Municipality</strong><br />
2010/11 Business Plans and Budget (Proposed) Finance<br />
Increases In Services / New Initiatives:<br />
Service Level Changes<br />
• Increased collections capacity through reorganization of existing resources to create a<br />
collections division within Revenue.<br />
• Implementation of the Dunning Module in Hansen to foster a more focussed collection<br />
effort and increase cash flow.<br />
• Response to Capital Budget Infrastructure Initiative (fast track capital projects)<br />
• Implementation of a Tangible Capital Asset sub-ledger to track asset costs, including<br />
opening value, additions, disposals, depreciation and net book value.<br />
• Continued roll out of amended procurement policy that will streamline the tender/award<br />
process with a greater emphasis on core values and sustainability.<br />
• Design and implementation of a new payroll journal to allow for electronic authorization<br />
via workflow. Implement electronic submissions of records of employment via the web.<br />
• Implementation of a pilot for electronic pay stub distribution.<br />
• Preparation/set up of new stores operations at the Ragged Lake Transit Centre<br />
• Created a fully automated Capital Budget process with in-house software providing more<br />
time to review specifics and increase quality control and production time.<br />
Decreases In Services / Operational Pressures (OP):<br />
OP: Tight fiscal capacity increases pressure to monitor projections and budget.<br />
OP: Hundreds of ideas received for efficiencies or revenue generation create a huge amount of<br />
analytical work which will require significant time to complete and may impact other<br />
initiatives.<br />
OP: Turnover in positions from retirements, departures and secondments has resulted in many<br />
new staff with limited knowledge and experience.<br />
Expected Services Not Being Delivered:<br />
None<br />
G11
Finance<br />
Summary of Gross Expenditures by Division<br />
2008-2009 2009-2010 2009-2010 2010-2011 Change over<br />
Actual Budget Projections Budget Budget Var as %<br />
Administration - Finance<br />
A301 Administration - Finance 333,397 377,980 380,572 396,745 18,765 5.0<br />
M621 VIK - Special Events 0 0 8,000 0 0 -<br />
333,397 377,980 388,572 396,745 18,765 5.0<br />
Finance<br />
A304 Financial Rpt & Trea 327,295 339,700 330,200 353,685 13,985 4.1<br />
A351 Budget & Fin.Analysi 591,295 609,600 650,700 790,437 180,837 29.7<br />
A810 Fiscal & Tax Policy 324,019 321,200 285,710 287,100 (34,100) (10.6)<br />
1,242,609 1,270,500 1,266,610 1,431,222 160,722 12.7<br />
Financial Services Admin<br />
A306 Cap Proj Overheads 246 (10) 0 (720) (710) 7,100.0<br />
A302 SMFS Admin. 161,377 184,400 177,500 190,645 6,245 3.4<br />
161,623 184,390 177,500 189,925 5,535 3.0<br />
Revenue<br />
A311 Revenue - Administration 296,045 319,790 306,457 332,436 12,646 4.0<br />
A312 Coin Room 216,170 213,180 209,537 247,500 34,320 16.1<br />
A313 Payment Processing 292,895 286,780 288,826 300,030 13,250 4.6<br />
A314 General Revenue 492,417 509,560 489,791 484,650 (24,910) (4.9)<br />
A315 Ticket Office 1,021,877 1,037,160 1,052,531 1,013,960 (23,200) (2.2)<br />
A316 Taxation 806,025 734,850 744,670 587,517 (147,333) (20.0)<br />
A325 Collections 0 0 0 261,927 261,927 -<br />
A360 Parking Meters 228,122 227,790 239,070 234,224 6,434 2.8<br />
3,353,551 3,329,110 3,330,882 3,462,244 133,134 4.0<br />
Accounting<br />
A321 Accounting Administration 806,818 696,980 676,200 730,305 33,325 4.8<br />
A322 Payment Processing 591,408 613,600 550,300 648,380 34,780 5.7<br />
A323 Accounting Processing 616,412 561,100 600,878 691,380 130,280 23.2<br />
A324 Accounting Reporting 332,526 365,500 355,600 387,380 21,880 6.0<br />
2,347,164 2,237,180 2,182,978 2,457,445 220,265 9.8<br />
Procurement<br />
A331 General Purchasing 592,912 592,780 558,480 613,872 21,092 3.6<br />
A332 Inventory & Asset Mg 126,838 90,750 108,450 93,670 2,920 3.2<br />
A333 Stores-Transit/Fire 844,533 890,100 888,100 931,075 40,975 4.6<br />
A334 Stores-East/West 560,437 577,200 579,000 610,230 33,030 5.7<br />
A335 Procurement FSRs 469,825 460,880 488,780 574,330 113,450 24.6<br />
A336 Procurement Staff 678,240 679,560 670,360 720,130 40,570 6.0<br />
A337 Disp.of Surplus Equi 28,579 0 0 0 0 -<br />
A338 Stores- Ragged Lake 0 0 0 73,235 73,235 -<br />
3,301,362 3,291,270 3,293,170 3,616,542 325,272 9.9<br />
Payroll Operations<br />
A615 Payroll Operations 1,211,058 1,262,800 1,173,100 1,311,800 49,000 3.9<br />
1,211,058 1,262,800 1,173,100 1,311,800 49,000 3.9<br />
Financial Services Division 10,374,758 10,304,750 10,157,630 11,037,956 733,206 7.1<br />
Revenue Replacement Project<br />
A319 Lock Tools Replace 7,400 0 0 0 0 -<br />
7,400 0 0 0 0 -<br />
PS TCA Project<br />
A391 PS3150 Compliance 160,846 188,300 175,100 172,650 (15,650) (8.3)<br />
160,846 188,300 175,100 172,650 (15,650) (8.3)<br />
Business Process and Quality As<br />
A317 Bus Process & QA 340,561 285,100 285,100 0 (285,100) (100.0)<br />
340,561 285,100 285,100 0 (285,100) (100.0)<br />
Total $12,459,571 $12,426,630 $12,273,012 $13,038,573 $611,943 4.9<br />
G12
Finance<br />
Summary of Gross Revenue by Division<br />
2008-2009 2009-2010 2009-2010 2010-2011 Change over<br />
Actual Budget Projections Budget Budget Var as %<br />
Administration - Finance<br />
A301 Administration - Finance (434) 0 (600) 0 0 -<br />
(434) 0 (600) 0 0 -<br />
Revenue<br />
A314 General Revenue (180,004) (181,900) (156,000) (155,200) 26,700 (14.7)<br />
A315 Ticket Office (6,450,114) (6,332,300) (6,560,000) (8,420,000) (2,087,700) 33.0<br />
A316 Taxation (1,803,886) (1,831,100) (1,735,000) (2,218,800) (387,700) 21.2<br />
A325 Collections 0 0 0 (145,000) (145,000) -<br />
(8,434,004) (8,345,300) (8,451,000) (10,939,000) (2,593,700) 31.1<br />
Accounting<br />
A321 Accounting Administration (3,430) 0 0 0 0 -<br />
A322 Payment Processing 0 0 (14,200) (15,000) (15,000) -<br />
(3,430) 0 (14,200) (15,000) (15,000) -<br />
Procurement<br />
A331 General Purchasing (800) 0 (5,950) 0 0 -<br />
A336 Procurement Staff 191 0 0 0 0 -<br />
A337 Disp.of Surplus Equi (26,418) 0 0 0 0 -<br />
(27,027) 0 (5,950) 0 0 -<br />
Payroll Operations<br />
A615 Payroll Operations (8,020) (7,800) (11,000) (7,800) 0 -<br />
(8,020) (7,800) (11,000) (7,800) 0 -<br />
Financial Services Division (8,472,481) (8,353,100) (8,482,150) (10,961,800) (2,608,700) 31.2<br />
PS TCA Project<br />
A391 PS3150 Compliance 0 0 (3,900) 0 0 -<br />
0 0 (3,900) 0 0 -<br />
Total (8,472,915) (8,353,100) (8,486,650) (10,961,800) (2,608,700) 31.2<br />
G13
Finance<br />
Summary of Net Expenditures by Division<br />
2008-2009 2009-2010 2009-2010 2010-2011 Change over<br />
Actual Budget Projections Budget Budget Var as %<br />
Administration - Finance<br />
A301 Administration - Finance 332,963 377,980 379,972 396,745 18,765 5.0<br />
M621 VIK - Special Events 0 0 8,000 0 0 -<br />
332,963 377,980 387,972 396,745 18,765 5.0<br />
Finance<br />
A304 Financial Rpt & Trea 327,295 339,700 330,200 353,685 13,985 4.1<br />
A351 Budget & Fin.Analysi 591,295 609,600 650,700 790,437 180,837 29.7<br />
A810 Fiscal & Tax Policy 324,019 321,200 285,710 287,100 (34,100) (10.6)<br />
1,242,609 1,270,500 1,266,610 1,431,222 160,722 12.7<br />
Financial Services Admin<br />
A306 Cap Proj Overheads 246 (10) 0 (720) (710) 7,100.0<br />
A302 SMFS Admin. 161,377 184,400 177,500 190,645 6,245 3.4<br />
161,623 184,390 177,500 189,925 5,535 3.0<br />
Revenue<br />
A311 Revenue - Administration 296,045 319,790 306,457 332,436 12,646 4.0<br />
A312 Coin Room 216,170 213,180 209,537 247,500 34,320 16.1<br />
A313 Payment Processing 292,895 286,780 288,826 300,030 13,250 4.6<br />
A314 General Revenue 312,413 327,660 333,791 329,450 1,790 0.5<br />
A315 Ticket Office (5,428,237) (5,295,140) (5,507,469) (7,406,040) (2,110,900) 39.9<br />
A316 Taxation (997,862) (1,096,250) (990,330) (1,631,283) (535,033) 48.8<br />
A325 Collections 0 0 0 116,927 116,927 -<br />
A360 Parking Meters 228,122 227,790 239,070 234,224 6,434 2.8<br />
(5,080,454) (5,016,190) (5,120,118) (7,476,756) (2,460,566) 49.1<br />
Accounting<br />
A321 Accounting Administration 803,388 696,980 676,200 730,305 33,325 4.8<br />
A322 Payment Processing 591,408 613,600 536,100 633,380 19,780 3.2<br />
A323 Accounting Processing 616,412 561,100 600,878 691,380 130,280 23.2<br />
A324 Accounting Reporting 332,526 365,500 355,600 387,380 21,880 6.0<br />
2,343,734 2,237,180 2,168,778 2,442,445 205,265 9.2<br />
Procurement<br />
A331 General Purchasing 592,112 592,780 552,530 613,872 21,092 3.6<br />
A332 Inventory & Asset Mg 126,838 90,750 108,450 93,670 2,920 3.2<br />
A333 Stores-Transit/Fire 844,533 890,100 888,100 931,075 40,975 4.6<br />
A334 Stores-East/West 560,437 577,200 579,000 610,230 33,030 5.7<br />
A335 Procurement FSRs 469,825 460,880 488,780 574,330 113,450 24.6<br />
A336 Procurement Staff 678,430 679,560 670,360 720,130 40,570 6.0<br />
A337 Disp.of Surplus Equi 2,161 0 0 0 0 -<br />
A338 Stores- Ragged Lake 0 0 0 73,235 73,235 -<br />
3,274,335 3,291,270 3,287,220 3,616,542 325,272 9.9<br />
Payroll Operations<br />
A615 Payroll Operations 1,203,038 1,255,000 1,162,100 1,304,000 49,000 3.9<br />
1,203,038 1,255,000 1,162,100 1,304,000 49,000 3.9<br />
Financial Services Division 1,902,277 1,951,650 1,675,480 76,156 (1,875,494) (96.1)<br />
Revenue Replacement Project<br />
A319 Lock Tools Replace 7,400 0 0 0 0 -<br />
7,400 0 0 0 0 -<br />
PS TCA Project<br />
A391 PS3150 Compliance 160,846 188,300 171,200 172,650 (15,650) (8.3)<br />
160,846 188,300 171,200 172,650 (15,650) (8.3)<br />
Business Process and Quality As<br />
A317 Bus Process & QA 340,561 285,100 285,100 0 (285,100) (100.0)<br />
340,561 285,100 285,100 0 (285,100) (100.0)<br />
Total $3,986,656 $4,073,530 $3,786,362 $2,076,773 -$1,996,757 (49.0)<br />
G14
Finance<br />
Summary by Expenditure & Revenue Types<br />
2008-2009 2009-2010 2009-2010 2010-2011 Change over<br />
Actual Budget Projections Budget Budget Var as %<br />
Expenditures<br />
Compensation & Benefits 10,804,399 10,907,000 10,675,228 11,577,850 670,850 6.2<br />
Office 508,922 411,737 452,260 314,940 (96,797) (23.5)<br />
Professional Fees 260,420 132,800 137,900 135,400 2,600 2.0<br />
Legal & Consulting Fees 71,231 6,000 20,400 4,160 (1,840) (30.7)<br />
External Services 626,723 612,300 715,500 734,050 121,750 19.9<br />
Uniforms & Clothing 13,908 11,500 10,700 11,600 100 0.9<br />
Supplies & Materials 54,903 61,930 59,930 60,750 (1,180) (1.9)<br />
Utilities 18 0 0 0 0 -<br />
Building Costs 150 1,500 700 1,500 0 -<br />
Equipment & Communications 88,971 82,600 78,500 83,300 700 0.8<br />
Vehicle Expense 3,681 0 0 0 0 -<br />
Travel 44,862 42,320 45,751 37,834 (4,486) (10.6)<br />
Training & Education 49,443 79,665 68,727 74,650 (5,015) (6.3)<br />
Facilities Rental 28,831 11,400 27,100 7,100 (4,300) (37.7)<br />
Advertising & Promotion 23,825 17,500 3,100 990 (16,510) (94.3)<br />
Other Goods & Services 108,654 141,578 96,566 106,955 (34,623) (24.5)<br />
Interdepartmental 33,096 23,300 (6,050) 13,594 (9,706) (41.7)<br />
Transfer to/from Reserves (262,324) 0 0 0 0 -<br />
Other Fiscal (142) (116,500) (113,300) (126,100) (9,600) 8.2<br />
Expenditures 12,459,571 12,426,630 12,273,012 13,038,573 611,943 4.9<br />
Total $12,459,571 $12,426,630 $12,273,012 $13,038,573 $611,943 4.9<br />
Revenues<br />
Area Rate Revenue 191 0 0 0 0 -<br />
Fines and Fees (4,827,272) (4,698,300) (4,820,000) (4,803,800) (105,500) 2.2<br />
Tax Certificates (366,991) (372,300) (320,000) (350,000) 22,300 (6.0)<br />
Sales Revenue (3,210,049) (3,244,500) (3,280,000) (5,755,000) (2,510,500) 77.4<br />
Other Revenue (68,793) (38,000) (66,650) (53,000) (15,000) 39.5<br />
Revenues (8,472,915) (8,353,100) (8,486,650) (10,961,800) (2,608,700) 31.2<br />
Total (8,472,915) (8,353,100) (8,486,650) (10,961,800) (2,608,700) 31.2<br />
Net Cost $3,986,656 $4,073,530 $3,786,362 $2,076,773 -$1,996,757 (49.0)<br />
G15
<strong>Halifax</strong> <strong>Regional</strong> <strong>Municipality</strong><br />
2010/11 Business Plans and Budget (Proposed) Fire and Emergency<br />
Fire and Emergency<br />
Business Plan - 2010/11
<strong>Halifax</strong> <strong>Regional</strong> <strong>Municipality</strong><br />
2010/11 Business Plans and Budget (Proposed) Fire and Emergency<br />
Mission: <strong>Halifax</strong> <strong>Regional</strong> Fire and Emergency members are dedicated to enhancing and<br />
preserving quality of life, property and environment through education,<br />
leadership, partnerships and effective response to emergencies by ensuring the<br />
citizens of HRM live in safe and welcoming communities.<br />
Business Unit Overview:<br />
<strong>Halifax</strong> <strong>Regional</strong> Fire and Emergency (HRFE) provides emergency response twenty-four hours a<br />
day, seven days a week through 59 stations located throughout HRM which are staffed by career<br />
and volunteer firefighters. The services provided include fire suppression, emergency rescue<br />
response and extrication, dangerous goods response and emergency medical care. Nonemergency<br />
services include public awareness, inspections, investigations, technical expertise and<br />
training which is also provided to the public and other HRM Business units.<br />
Director:<br />
Operational Support<br />
Roy Hollett<br />
Deputy Chief Director<br />
Operations<br />
Stephen Thurber<br />
Deputy Chief Director<br />
Summary of<br />
Business Unit<br />
Structure Changes:<br />
William H. Mosher<br />
The Operational Support Team is the infrastructure that supports the<br />
Operations Division. This section is responsible for<br />
Communications, Buildings & Fleet, Attendance Management,<br />
Human Resources, Fire Prevention, Marketing & Public Information,<br />
Safe Communities, Emergency Measures, Firefighter Assistance<br />
Program, along with the Strategic Initiative of the Urban Search &<br />
Rescue (USAR).<br />
The Corporate Safety Division of HRM is also under Fire’s umbrella<br />
and is responsible to ensure that HRM meets its legislative<br />
compliance under the Occupational Health & Safety Act.<br />
The Operations Team is responsible for the mitigation of emergency<br />
response, which is provided from 59 Fire Stations that covers all of<br />
HRM. These fire stations complement ranges from being fully career<br />
firefighters to fully volunteer firefighters, with some stations having a<br />
combination of career and volunteer firefighters. Also reporting to<br />
the Deputy of Operations are the Logistics Division, Training<br />
Division and Labour Relations. A special operations section also falls<br />
under Operations and is responsible for the coordination and<br />
development of the Marine/Dive Teams as well as the strategic<br />
initiative of the Chemical Biological Radiological Nuclear. (CBRN)<br />
Team.<br />
None<br />
H2
<strong>Halifax</strong> <strong>Regional</strong> <strong>Municipality</strong><br />
2010/11 Business Plans and Budget (Proposed) Fire and Emergency<br />
Core Operations and Services provided:<br />
• 494 Career Staff (467 Uniformed & 27 Civilian)<br />
• 705 Volunteer Firefighters (147 Urban & 558 Rural)<br />
• Fire and Emergency Response, Medical Response<br />
• Vehicle Rescue, Water/Ice Rescue, Structural/Confined Space Rescue, High Angle Rescue,<br />
and Search and Rescue<br />
• Emergency Management Office (EMO)<br />
• Corporate Safety Office<br />
• Hazardous Material Response<br />
• Inspections; Investigations<br />
• Public Education; Public Information<br />
• Emergency Responses: (2009/08 - 11,467); (2008/07 - 11,820) (2007/06 - 12,267)<br />
• Smoke Detectors installed by Operations Crews (2009 - 51); (2008 - 41); (2007 - 53)<br />
• Public Education Presentations conducted (2009 - 390) (2008 - 731), (2007 - 748)<br />
• Public & Private Schools participating in Fire Prevention Week Activities (2009 - 109);<br />
(2008 - 109); (2007 - 109)<br />
• Occupancy Inspections (2009 - 1474); (2008 - 3512); (2007 - 2200)<br />
• 104 Fire Safety Plans Recorded in 2009<br />
• 144 Front Line Apparatus (Engines, Pumpers, Aerials, Rescues & Tactical Support<br />
• 168 Support Vehicles (Light Rescues, Air Supply Units, Utilities Trucks/Cars/Vans,<br />
Command and Speciality Trailers, Boats, Tractors, ATV’s Antiques, etc.)<br />
Funded Full Time Equivalents (FTEs):<br />
Funded FTEs<br />
(includes Full and Part-time )<br />
2008/09<br />
(Approved)<br />
494<br />
469 Uniformed<br />
25 Civilians<br />
2009/10<br />
(Approved)<br />
494<br />
467 Uniformed<br />
27 Civilians<br />
2010/11<br />
(Proposed)<br />
494<br />
467 Uniformed<br />
27 Civilians<br />
H3
<strong>Halifax</strong> <strong>Regional</strong> <strong>Municipality</strong><br />
2010/11 Business Plans and Budget (Proposed) Fire and Emergency<br />
Analysis of <strong>Operating</strong> Budget Changes:<br />
<strong>Operating</strong> Budget Change Details<br />
($000's)<br />
2009/10 Budget $54,248<br />
1 Salaries & benefits - includes cost changes resulting from collective<br />
agreement increases, step level increases, classification reviews and<br />
employer benefit costs.<br />
2 Increase in Honorariums to implement the first phase of a blended<br />
Honorarium System for all Fire Service Volunteers.<br />
2,017<br />
3 Inflation and Service Driver Increases to other Expenditure accounts. 42<br />
4 Debt Service Costs. 14<br />
5 Budget Transfers to Corporate for Printing and Computers (26)<br />
6 Fleet-Interdepartmental decrease. (Lower Fuel Prices). (31)<br />
7 Rural Fire Fuel decrease (Lower Fuel Prices). (34)<br />
8 Budget transfer to Community Development for Fire Halls (utilities). (23)<br />
9 Corporate across the board reductions. (98)<br />
10 Fire cost cutting exercise. (879)<br />
2010/11 Budget ( SAP Version Z5) $55,630<br />
400<br />
H4
<strong>Halifax</strong> <strong>Regional</strong> <strong>Municipality</strong><br />
2010/11 Business Plans and Budget (Proposed) Fire and Emergency<br />
Key Challenges and Opportunities<br />
The following challenges and opportunities will have an impact on the Business Unit between<br />
the 2010-2015 timeframe.<br />
Challenges with Community-wide Impact:<br />
These are challenges or opportunities which affect the entire HRM Region, and which the<br />
Business Unit plays a role in influencing or addressing the outcome. Multiple business units may<br />
be involved in addressing the issue.<br />
1. External Partnerships: Developing new and continuing to enhance existing partnerships<br />
with external agencies and other levels of government to provide services to our residents and<br />
visitors.<br />
2. Citizens Emergency Capabilty: There is a need to further develop awareness programs and<br />
Joint Emergency Management teams that are designed to assist residents to be prepared and<br />
be able to take care of themselves for the first 72 hours in the event of an emergency.<br />
3. Volunteer Recruitment & Retention: <strong>Halifax</strong> <strong>Regional</strong> Fire and Emergency faces a<br />
significant challenge in recruiting and retaining volunteer firefighters, which is also a major<br />
issue across the Province of NS and North America. Recruitment campaigns for volunteer<br />
firefighters are ongoing, with emphasis in communities with low volunteer turnout.<br />
4. Station Location Project: The identification of fire station consolidation and closures will<br />
have an impact on the community they are located in and will require an effective<br />
communication strategy and discussion with stakeholders. Also a major component of a<br />
community Fire Underwriters Survey is the analysis of the placement of fire stations and<br />
firefighter response to emergencies which is a key component in the establishing of rating<br />
levels to the Insurance industry for fire insurance rates for the citizens of HRM.<br />
Challenges with Service Delivery / Business Unit Impact<br />
These are issues which affect the business unit’s ability to deliver services (both internally and<br />
externally).<br />
1. Service Delivery Technology: The implementation of technological advances for the fire<br />
service is required to accurately measure service delivery. Research continues on finding<br />
ways to accurately measure our service delivery with tools such as Mobile Data Terminals<br />
(MDT’s). A pilot project for 5 Mobile Data Terminals is underway this fiscal year to evaluate<br />
and determine the next course of action. The installation of a Station Alerting system and<br />
Automatic Vehicle Locators (AVL) technology has also been identified as tools to assist the<br />
Fire Service in its service delivery as well as increasing efficiencies. Fire Department<br />
Management (FDM) requires resources in order to further develop and maximize the full use<br />
of this software.<br />
H5
<strong>Halifax</strong> <strong>Regional</strong> <strong>Municipality</strong><br />
2010/11 Business Plans and Budget (Proposed) Fire and Emergency<br />
2. Service Delivery - Resources: The fire service continues to strive to minimize the impacts to<br />
service delivery by realigning staffing on a daily basis to meet or maintain current levels of<br />
service delivery. Staff also continues to work on the alignment of existing resources and shift<br />
schedules to increase efficiencies in service delivery as required.<br />
3. Service Delivery - Station Location: As we move forward with the Station Location Project,<br />
this will be a challenge for the Fire Service as we make changes in service delivery with the<br />
building of new stations, closing redundant stations, and consolidating stations as identified<br />
for service improvements and efficiencies. RMS (formerly the Insurers’ Advisory<br />
Organization) will assist our Fire Service in validating our service delivery.<br />
The goals for Fire and Emergency are:<br />
Business Unit Goals<br />
Goal 1:<br />
Goal 2:<br />
Goal 3:<br />
Goal 4:<br />
Goal 5:<br />
Goal 6:<br />
Goal 7:<br />
Goal 8:<br />
Goal 9:<br />
Goal 10:<br />
Goal 11:<br />
Goal 12:<br />
Goal 13:<br />
Fire Service Strategies aligned with Approved Service Delivery Standard<br />
EMO Preparedness and Business Continuity Management<br />
Marine Emergency Operations<br />
Emergency Response Speciality Teams<br />
Training Facility<br />
Depot & Life Safety Equipment Supply<br />
Corporate Safety<br />
Volunteer Resource Strategies<br />
Camp Courage<br />
Emergency Services Achievement Program<br />
Increased Level of Engagement in Fire & Emergency<br />
Meet Internal Service Expectations<br />
Meet Internal Partnership / Collaboration Requirements<br />
H6
<strong>Halifax</strong> <strong>Regional</strong> <strong>Municipality</strong><br />
2010/11 Business Plans and Budget (Proposed) Fire and Emergency<br />
Goal 1:<br />
Fire Service Strategies aligned with Approved<br />
Service Delivery Standard<br />
Corporate Strategy Linkage:<br />
Community Outcome: Safe & Welcoming Communities<br />
Council Focus Area: Public Safety<br />
EMT Priority: Excellence in Service Delivery<br />
Description:<br />
HRM Council reaffirmed and approved the direction set forth in the 08/09 Business Plan. The<br />
recommendation as approved by Council was for the Fire Service to continue to align its fire<br />
service strategies with the Service Delivery Standard approved by Council in February, 2006.<br />
The intent of the Service Delivery Standard will be to provide service level standards for future<br />
years to address service deficiencies and standardize the level of fire service throughout all of<br />
HRM. This standard is based on population density and will determine the resources, equipment<br />
and station locations that are required for efficient, effective service delivery. We will also be<br />
looking at the future growth of HRM, to align with the <strong>Regional</strong> Plan to provide better planning<br />
for future fire station sites.<br />
Plans are also underway this year in developing the information and benchmarks to measure<br />
service delivery, as well as exploring the possibility of having the Risk Management Services<br />
(Insurers Advisory Organization) conduct an actuarial analysis to determine fire insurance<br />
premium ratings for HRM.<br />
Goal 1:<br />
Fire Service Strategies aligned with Approved<br />
Service Delivery Standard<br />
Objectives for 2010/2011:<br />
FIRE 1.1 To develop and implement a service level agreement with HRP for Dispatch<br />
services.<br />
FIRE 1.2 To continue to assess and evaluate the standard for response coverage for all Fire<br />
Service.<br />
Objectives for the next 3-5 years:<br />
FIRE 1.3<br />
FIRE 1.4<br />
To begin the actuarial analysis to be conducted by Risk Management Services<br />
(Insurers Advisory Organization) to determine Fire Insurance ratings which can<br />
benefit the citizens of HRM as a result of all the changes in fire protection since<br />
1996 can reduce insurance rates.<br />
To develop a multi-year plans to improve service delivery:<br />
$ Station locations and an emergency fleet that aligns with <strong>Regional</strong> Planning<br />
objectives;<br />
$ Staff and equipment levels align with service delivery.<br />
H7
<strong>Halifax</strong> <strong>Regional</strong> <strong>Municipality</strong><br />
2010/11 Business Plans and Budget (Proposed) Fire and Emergency<br />
FIRE 1.5<br />
FIRE 1.6<br />
To have the technology (ie MDT’s/ Status heads) in place to monitor and assist in<br />
the evaluation of service delivery.<br />
To review and identify resource requirements to work on FDM to further develop<br />
and implement module programs to expand the functionality for data mining,<br />
report building, etc.<br />
Goal 2:<br />
EMO Preparedness & Business Continuity Management<br />
Corporate Strategy Linkage:<br />
Community Outcome: Safe & Welcoming Communities<br />
EMT Priority: Excellence in Service Delivery<br />
Description:<br />
In addition to ensuring professional municipal response to emergencies, the Emergency<br />
Management Office provides leadership and support to all business units and affiliated agencies<br />
to ensure corporate readiness in the event of a disaster or large-scale emergency situation. This<br />
includes the update of existing data, the development of emergency plans, including business<br />
continuity plans, training, and exercises to measure preparedness, and to identify areas for<br />
improvements to ensure coordination and preparedness in the event of an emergency.<br />
Goal 2:<br />
EMO Preparedness & Business Continuity Management<br />
Objectives for 2010/2011:<br />
FIRE 2.1 To complete the evacuation sector profiles updates and include a shared user<br />
access for all.<br />
FIRE 2.2 To complete the assessment of HRM facilities that are eligible for fixed<br />
generators and to prioritize the purchase as budget permits.<br />
FIRE 2.3 To complete the prioritization of Municipal Services in conjunction with the<br />
revised service catalogue for Business Continuity Planning.<br />
FIRE 2.4 Based on the prioritization for services, EMO to coordinate the development of<br />
an overall Business Continuity Plan starting at the Business Unit level.<br />
FIRE 2.5 To develop a business case seeking additional funding for Volunteer Response<br />
Organizations - Ground Search & Rescue Teams.<br />
FIRE 2.6 To explore the feasibility of the implementation of an electronic Multi-Agency<br />
Tactical Response System.<br />
FIRE 2.7 To begin discussions with Business Units on the Emergency Response Systems<br />
currently used to determine the feasibility of using one (1) emergency response<br />
system for all HRM Public Safety Agencies.<br />
Objectives for the next 3-5 years:<br />
FIRE 2.8<br />
To conduct a Hazard Assessment for HRM that complies with established<br />
Provincial EMO Standards.<br />
H8
<strong>Halifax</strong> <strong>Regional</strong> <strong>Municipality</strong><br />
2010/11 Business Plans and Budget (Proposed) Fire and Emergency<br />
FIRE 2.9<br />
FIRE 2.10<br />
Upon completion of the Hazard Assessment, EMO will develop an<br />
encompassing Business Continuity Management Program for the <strong>Municipality</strong>.<br />
To develop a Service Level Agreement for Volunteer Organizations that interacts<br />
with the <strong>Municipality</strong> during times of emergency response.<br />
Goal 3:<br />
Marine Emergency Operations<br />
Corporate Strategy Linkage:<br />
Community Outcome: Safe & Welcoming Communities<br />
EMT Priorities – Excellence in Service Delivery<br />
Description:<br />
As part of the Emergency Operations, the Marine Emergency Operations Team would respond to<br />
all emergency situations on and around the harbour. The primary marine response capabilities<br />
focus on shoreline response, small pleasure water-craft, and Metro Transit Ferries. <strong>Halifax</strong><br />
<strong>Regional</strong> Fire and Emergency does have a limited capability for emergency marine response and<br />
continues to work with other agencies such as the Department of National Defence, Port<br />
Authority, Queen’s Harbour Master, Coast Guard, and <strong>Halifax</strong> <strong>Regional</strong> Police to develop<br />
partnerships and educate each other on service level capabilities in the event of an emergency in<br />
<strong>Halifax</strong> Harbour.<br />
Goal 3:<br />
Marine Emergency Operations<br />
Objectives for 2010/2011:<br />
FIRE 3.1 To continue to evaluate existing resources, equipment and current location to<br />
ensure optimized response capability.<br />
FIRE 3.2 To explore and research boat designs to meet the current needs of our Fire<br />
Service.<br />
FIRE 3.3 To conduct research on the feasibility of establishing a Search and Recovery<br />
Dive Team for Fire & Police.<br />
Objectives for the next 3-5 years:<br />
FIRE 3.4<br />
FIRE 3.5<br />
To purchase a purpose built boat to meet the needs of the Fire Service.<br />
Pending the feasibility study to establish a Search and Recovery Dive Team for<br />
Fire & Police through future budget processes.<br />
H9
<strong>Halifax</strong> <strong>Regional</strong> <strong>Municipality</strong><br />
2010/11 Business Plans and Budget (Proposed) Fire and Emergency<br />
Goal 4:<br />
Emergency Response Speciality Teams<br />
Corporate Strategy Linkage:<br />
Community Outcome: Safe & Welcoming Communities<br />
EMT Priority: Excellence in Service Delivery<br />
Description:<br />
Firefighters are faced with serious unpractised challenges in the areas of Hazardous Material<br />
Emergency Response, Chemical-Biological-Radiological-Nuclear Responses (CBRN), Technical<br />
Rescue and Urban Search and Rescue (USAR). Firefighters are expected to perform these<br />
arduous tasks in the most physically and mentally demanding environments, without the benefit<br />
of “on site preplanning”. <strong>Halifax</strong> <strong>Regional</strong> Fire and Emergency has teams of highly skilled<br />
firefighters who have specialized training and equipment to mitigate these types of emergencies.<br />
<strong>Halifax</strong> <strong>Regional</strong> Fire and Emergency was the Heavy Urban Search and Rescue (HUSAR)<br />
Atlantic Task Force 5 Team with support from the Federal Government. Presently, the Urban<br />
Search and Rescue (USAR) team has been downgraded to a “Medium” team for response<br />
capability in HRM. We continue to having ongoing discussions with the Atlantic Provinces to<br />
establish a funding formula to assist HRM & <strong>Halifax</strong> <strong>Regional</strong> Fire and Emergency to reestablish<br />
the “Heavy” designation for the Atlantic Task Force 5 Team and deployment capability<br />
for the Atlantic Provinces.<br />
Goal 4:<br />
Emergency Response Speciality Teams<br />
Objectives for 2010/2011:<br />
FIRE 4.1 To continue to develop internal resources with training, skill and utilization of<br />
equipment in support of deployment as required.<br />
FIRE 4.2 Memorandum of Understanding has been drafted and sent to the NS Fire<br />
Marshal’s Office to begin Provincial approvals for HRFE’s response to areas<br />
outside of HRM’s boundaries for incidents involving Chemical, Biological,<br />
Radiological and Nuclear events within the Province.<br />
FIRE 4.3 To seek financial support from the Atlantic Provinces to assist HRM in<br />
sustaining the “Heavy” designation for <strong>Halifax</strong> <strong>Regional</strong> Fire and Emergency as<br />
the Atlantic Task Force 5 Urban Search and Rescue (USAR) Team with response<br />
capabilities for the Atlantic Provinces.<br />
Objectives for the next 3-5 years:<br />
FIRE 4.4<br />
Depending on the outcome of the financial support for the USAR Team, this will<br />
determine the future level of response for this team.<br />
H10
<strong>Halifax</strong> <strong>Regional</strong> <strong>Municipality</strong><br />
2010/11 Business Plans and Budget (Proposed) Fire and Emergency<br />
Goal 5:<br />
Training Facility<br />
Corporate Strategy Linkage:<br />
EMT Priority: Excellence in Service Delivery<br />
Description:<br />
Today’s firefighters are faced with serious challenges as they must perform physically demanding<br />
skills in life threatening environments without the benefit of on site pre-job planning. This is<br />
compounded by a reduction in overall experience levels and opportunities to practice. The<br />
educational efforts for firefighters has been focussed on knowledge-based learning, however, it<br />
has become evident that for overall firefighter development and safety we must return to the<br />
learning and consistent practice of physical skills that will result in predictable and desired<br />
behaviours on the fire ground. Our Fire Service has limited time at the Waverley Firefighters<br />
School and the School is looking at increasing their Pre-Employment Firefighting Programs<br />
which will further impact our ability to use the facility for training. Also, it should be noted that<br />
the infrastructure at the Waverley Firefighters School is in need of re-capitalization and currently<br />
there is no plan or funding in place to complete this.<br />
The construction of a proper training facility would allow firefighters, driving engineers,<br />
company officers and incident commanders to learn and practice team skills in a safe and<br />
controlled environment. This facility would also address environmental issues such as air<br />
pollution and contain ground run-off that could have effects on the environment. This type of<br />
training would also help to reduce injuries and/or deaths to firefighters and civilians, reduce<br />
property damage, increase efficiency and morale with improved training capabilities for the fire<br />
service.<br />
Goal 5:<br />
Training Facility<br />
Objectives for 2010/2011:<br />
FIRE 5.1<br />
To identify a future site location(s) and obtain the land to build a training facility.<br />
Objectives for the next 3-5 years:<br />
FIRE 5.2<br />
FIRE 5.3<br />
To continue to research and fully develop plans identifying Fire & Emergency’s<br />
training requirements for a training facility to reduce risk, liability, and to<br />
improve the safety of our firefighters.<br />
Research and explore alternative options to provide firefighter training.<br />
H11
<strong>Halifax</strong> <strong>Regional</strong> <strong>Municipality</strong><br />
2010/11 Business Plans and Budget (Proposed) Fire and Emergency<br />
Goal 6:<br />
Logistics Depot & Life Safety Equipment Supply<br />
Corporate Strategy Linkage:<br />
Community Outcome: Safe & Welcoming Communities<br />
EMT Priority: Excellence in Service Delivery<br />
Description:<br />
The standardization of our life safety equipment along with the present facilities used by the<br />
Logistics Division has resulted in challenges for the Division. The division is currently housed<br />
in various buildings and has outgrown its space. This division is responsible for the care,<br />
maintenance, and storage of all the life safety equipment for approximately 467 uniformed<br />
personnel and 705 volunteer members. The division also stores and maintains all the USAR<br />
equipment. This division is also responsible for the preventative building maintenance programs<br />
and minor repairs for the 59 fire stations, and has proven to be very cost effective.<br />
Goal 6:<br />
Logistics Depot & Life Safety Equipment Supply<br />
Objectives for 2010/2011:<br />
FIRE 6.1 To explore the feasibility of leasing larger space to bring the Logistics Division<br />
together in one facility to meet office and warehousing needs. The warehouse<br />
space currently used is leased and expires December 31, 2011.<br />
Objectives for the next 3-5 years:<br />
FIRE 6.2<br />
To obtain approval and funding to relocate the Logistics Division to a new<br />
location with preference to a municipally owned facility in accordance with the<br />
budget and business planning process.<br />
Goal 7:<br />
Corporate Safety<br />
Corporate Strategy Linkage:<br />
EMT Priority: Employer of Choice<br />
Description:<br />
The responsibility of Corporate Safety was transferred to Fire and Emergency in April of 2007.<br />
Since that time, the Division has worked diligently to establish a structure that would meet the<br />
needs of Corporate HRM. To date, many changes and improvements have been implemented to<br />
the HRM Safety Program. A safety structure has been implemented to provide efficient and<br />
effective client services, with Corporate Safety personnel now centrally located in one office.<br />
Uniformed Safety Officers now give an appearance of authority and professionalism that receives<br />
respect and cooperation. Corporate Safety has two vehicles assigned to the division to allow<br />
H12
<strong>Halifax</strong> <strong>Regional</strong> <strong>Municipality</strong><br />
2010/11 Business Plans and Budget (Proposed) Fire and Emergency<br />
officers to conduct inspections, investigations and write and deliver reports on site, without<br />
having to return to the office.<br />
Goal 7:<br />
Corporate Safety<br />
Objectives for 2010/2011:<br />
FIRE 7.1 To improve the safety culture within HRM that will include health and safety<br />
attitude and behaviour changes, as well as a better understanding of occupational<br />
health and safety requirements for a safer workplace.<br />
Objectives for the next 3-5 years:<br />
FIRE 7.2<br />
FIRE 7.3<br />
FIRE 7.4<br />
FIRE 7.5<br />
A review of the existing staffing levels and work loads to ensure that Corporate<br />
Safety are meeting their mandate has identified the need for (1) Training Safety<br />
Officer.<br />
A review of the existing staffing levels and work loads to ensure that Corporate<br />
Safety are meeting their mandate has identified the need for (1) Administrative<br />
Support position to assist the division.<br />
To achieve and maintain compliance with all applicable regulatory requirements.<br />
To become a recognized leader in health and safety promotion.<br />
Goal 8:<br />
Volunteer Resource Strategies<br />
Corporate Strategy Linkage:<br />
Community Outcome: Safe & Welcoming Communities<br />
EMT Priority: Excellence in Service Delivery<br />
Description:<br />
Our volunteer firefighters are committed to protecting the citizens and property of HRM.<br />
Volunteer recruitment continues to be a challenge especially in areas that are fully protected by<br />
volunteers. The downward trend in volunteering is not only an issue for HRM but also for the<br />
Province and North America. As a result, we will continue to focus our efforts on the<br />
recruitment and retention of volunteers in our Fire Service.<br />
Goal 8:<br />
Volunteer Resource Strategies<br />
Objectives for 2010/2011:<br />
FIRE 8.1<br />
To address volunteer recruitment and retention issues by:<br />
• Conducting volunteer recruitments drives;<br />
• Developing strategies to assist with volunteer retention.<br />
H13
<strong>Halifax</strong> <strong>Regional</strong> <strong>Municipality</strong><br />
2010/11 Business Plans and Budget (Proposed) Fire and Emergency<br />
FIRE 8.2 Continue to work with the Provincial Fire Marshal’s Office on a Provincial<br />
Recruitment and Retention Strategy. A Human Resources Staff person has been<br />
assigned to this working committee.<br />
FIRE 8.3 To implement the first phase of a blended Honorarium System for Fire Service<br />
Volunteers.<br />
Objectives for the next 3-5 years:<br />
FIRE 8.4<br />
FIRE 8.5<br />
To seek required funding to implement the second phase of the blended<br />
Honorarium system.<br />
To have the honorarium funding added to the compensation model to ensure<br />
consistency with other compensation related areas.<br />
Goal 9:<br />
Camp Courage<br />
Corporate Strategy Linkage:<br />
EMT Priority: Employer of Choice<br />
Description:<br />
Camp Courage, The First Responders Society is a non-profit registered charity established in<br />
2006 under the direction of one of HRM’s Firefighters. The purpose of this free Police, Fire and<br />
Paramedic camp is to inform and educate young women aged 15-19 about these non-traditional<br />
professions. The program accepts 24 candidates for eight days once a year and is divided among<br />
First Responders agencies, with two days dedicated to each of the three emergency services.<br />
Emergency Medical Care (EMC) focuses on various medical scenarios for paramedics. <strong>Halifax</strong><br />
<strong>Regional</strong> Police, RCMP, and Customs contribute to the Policing portion of the program with the<br />
Military Police occasionally participating. <strong>Halifax</strong> <strong>Regional</strong> Fire and Emergency is responsible<br />
for the firefighting portion. This program has been funded through donations in kind from the<br />
above agencies, as well as through fundraising efforts by the First Responders Society. The goal<br />
of this camp is to instil confidence, provide more employment options and promote good values<br />
in our youth to be community oriented citizens which has proven to been successful for both<br />
camp participants and first responders agencies.<br />
Goal 9:<br />
Camp Courage<br />
Objectives for 2010/2011:<br />
FIRE 9.1<br />
To support Camp Courage with value in kind services.<br />
Objectives for the next 3-5 years:<br />
FIRE 9.2<br />
To continue to support Camp Courage as an outreach initiative to attract females<br />
to consider non-traditional roles for career choices for HRM and its Emergency<br />
Services.<br />
H14
<strong>Halifax</strong> <strong>Regional</strong> <strong>Municipality</strong><br />
2010/11 Business Plans and Budget (Proposed) Fire and Emergency<br />
Goal 10:<br />
Emergency Services Achievement Program<br />
Corporate Strategy Linkage:<br />
EMT Priority: Employer of Choice<br />
Description:<br />
The Emergency Services Achievement Program (ESAP) is fully funded through a partnership<br />
with Human Resource Development Canada as a Youth Canada initiative to expose twelve (12)<br />
priority youth to practical life skills and employment scenarios, under the direction of the ESAP<br />
Coordinator who oversees the daily operations of the program. A funding application is<br />
submitted each year to Service Canada. The program is designed to deliver programs for teens to<br />
excite them about staying in school, avoiding integrity based issues and to develop an interest in<br />
fire services and recreation as a future career or voluntary positions.<br />
Goal 10:<br />
Emergency Services Achievement Program<br />
Objectives for 2010/2011:<br />
FIRE 10.1 To support the Emergency Services Achievement Program (ESAP) with value in<br />
kind services.<br />
Objectives for the next 3-5 years:<br />
FIRE 10.2<br />
To continue to support the EASP Program as an outreach initiative assisting<br />
priority youth in making for choices regarding education and/or careers.<br />
Goal 11:<br />
Increase Level of Employee Engagement in Fire and<br />
Emergency<br />
Corporate Strategy Linkage:<br />
EMT Priority: Employer of Choice<br />
Description:<br />
HRM is committed to increasing the level of employee engagement in the organization. An<br />
engaged employee can be defined as an employee that is committed to personal growth and the<br />
growth of the organization, and acts accordingly. As well, an engaged employee commits their<br />
time and effort to help the organization succeed. The results of a recent survey have suggested<br />
that there is room for improvement within Fire and Emergency business unit. Engaged<br />
employees also assists us in the continuing efforts to maintain trained capable staff to replace<br />
retiring members at all levels as part of our Succession Planning goals<br />
H15
<strong>Halifax</strong> <strong>Regional</strong> <strong>Municipality</strong><br />
2010/11 Business Plans and Budget (Proposed) Fire and Emergency<br />
Goal 11:<br />
Increase Level of Employee Engagement in Fire and<br />
Emergency<br />
Objectives for 2010/2011:<br />
FIRE 11.1 Conduct interviews with employees to identify the positive and negative<br />
influences on employees within Fire and Emergency.<br />
FIRE 11.2 Continue to provide opportunities for employees to further develop their career<br />
paths through secondment and other development opportunities.<br />
FIRE 11.3 Review results of the update of the Employee Engagement Survey for<br />
measurable actions in response to findings.<br />
FIRE 11.4 The Chief and Senior Staff to visit fire stations on an ongoing regular basis.<br />
Objectives for the next 3-5 years:<br />
FIRE 11.5 Continue developing Succession Plans for key Fire and Emergency positions.<br />
Goal 12:<br />
Meet Internal Service Expectations<br />
Corporate Strategy Linkage:<br />
EMT Priority: Excellence in Service Delivery<br />
Description:<br />
Working with other business units will improve communication and business practices to ensure<br />
that HRM is working efficiently and effectively to improve service delivery for both internal and<br />
external clients.<br />
Goal 12:<br />
Meet Internal Service Expectations<br />
Objectives for 2010/2011:<br />
FIRE 12.1<br />
FIRE 12.2<br />
FIRE 12.3<br />
FIRE 12.4<br />
FIRE 12.5<br />
To work with BIPM in the roll out of the new Desktop applications planned for<br />
this budget year.<br />
To work with Police/HR/Finance in reviewing the Financial positions across the<br />
organization for horizontal equity and consistency.<br />
To continue to support Finance in the Corporate roll out of Policies, Multi year<br />
Financial Strategy, etc.<br />
To continue to support HR in the rollout of policies, collective bargaining, the<br />
development and delivery of programs (Workforce planning, etc.).<br />
To continue to work with HRP in the development of Service Level Agreement<br />
for Dispatch Services, Back-up Paging System.<br />
H16
<strong>Halifax</strong> <strong>Regional</strong> <strong>Municipality</strong><br />
2010/11 Business Plans and Budget (Proposed) Fire and Emergency<br />
FIRE 12.6<br />
Goal 13:<br />
To continue to work with Solid Waste Resources (SWR) in the education of staff<br />
in source separation in accordance with HRM Building Standards for Recycling<br />
and Organics Program.<br />
Meet Internal Partnership / Collaboration Requirements<br />
Corporate Strategy Linkage:<br />
EMT Priority: Excellence in Service Delivery<br />
Description:<br />
Collaboration and the development of internal partnership will greatly assist HRM in providing<br />
service delivery for internal clients more efficiently and effectively.<br />
Goal 13:<br />
Meet Internal Partnership / Collaboration Requirements<br />
Objectives for 2010/2011:<br />
FIRE 13.1<br />
FIRE 13.2<br />
FIRE 13.3<br />
FIRE 13.4<br />
To continue to work with IAM on the status of facilities, advising of surplus<br />
property and future planning for the Fire Service.<br />
To continue to work with Police/RCMP/TPW to explore the feasibility of one<br />
Response system for HRM Public Safety Agencies during a multi-agency<br />
response.<br />
To continue to support TPW in the collaborative work on education and<br />
implementation of diversion program.<br />
To continue to work and support various Corporate Committees such as:<br />
Information Communication Technology, Corporate Accommodations, Special<br />
Events, etc. to ensure the various objectives/goals are moving forward within<br />
HRM.<br />
H17
<strong>Halifax</strong> <strong>Regional</strong> <strong>Municipality</strong><br />
2010/11 Business Plans and Budget (Proposed) Fire and Emergency<br />
Increases In Services / New Initiatives:<br />
None.<br />
Service Level Changes<br />
Decreases In Services / Operational Pressures (OP):<br />
OP/ Changes in day to day staffing complement may result in station closures during peak<br />
vacation periods as staff will be reassigned to other stations in an effort to reduce overtime<br />
expenditures, which may result in an increase in response times.<br />
Expected Services Not Being Delivered:<br />
None<br />
H18
Fire & Emergency Services<br />
Summary of Gross Expenditures by Division<br />
2008-2009 2009-2010 2009-2010 2010-2011 Change over<br />
Actual Budget Projections Budget Budget Var as %<br />
Operations<br />
F110 Operations 35,597,953 37,080,500 36,735,523 38,825,700 1,745,200 4.7<br />
F120 Training 1,196,769 1,262,700 1,494,038 1,306,300 43,600 3.5<br />
F791 Rural Fire Debt Payments 710,874 800,900 804,200 815,160 14,260 1.8<br />
F792 Rural Fire Fleet Mtn 127,478 161,500 135,100 127,500 (34,000) (21.1)<br />
F793 Rural Fire-Rural Op 2,832,871 2,815,400 2,796,369 2,521,000 (294,400) (10.5)<br />
F724 Enfield 40,000 40,000 40,000 40,000 0 -<br />
F727 Milford Station 2,400 2,400 2,400 2,400 0 -<br />
F728 Hubbards Rural Fire 40,000 40,000 40,000 40,000 0 -<br />
40,548,345 42,203,400 42,047,630 43,678,060 1,474,660 3.5<br />
Operations Support<br />
A451 Emerg Measures Recov 25,000 25,000 25,000 0 (25,000) (100.0)<br />
C801 Emergency Meas. Adm 153,362 121,400 167,813 122,530 1,130 0.9<br />
F121 Career Development 217,882 303,700 274,814 154,545 (149,155) (49.1)<br />
F130 Prevention 1,189,134 1,775,200 1,671,360 1,826,700 51,500 2.9<br />
F140 Administration 5,172,384 4,929,200 5,145,795 5,255,880 326,680 6.6<br />
F141 Community Relations 124,124 137,200 137,430 134,500 (2,700) (2.0)<br />
F150 Mechanical Maint. 2,095,659 2,245,100 2,212,808 2,210,031 (35,069) (1.6)<br />
F160 Buildings & Logistic 1,919,730 1,889,700 2,090,335 2,032,100 142,400 7.5<br />
F180 Safety & Strat. Init 379,973 295,400 205,968 192,650 (102,750) (34.8)<br />
F181 USAR Project 370,194 600,000 141,620 400,000 (200,000) (33.3)<br />
F182 Corporate Safety 17,839 53,800 42,054 28,420 (25,380) (47.2)<br />
F190 Communications 416,477 213,200 406,821 248,300 35,100 16.5<br />
12,081,759 12,588,900 12,521,818 12,605,656 16,756 0.1<br />
Locked Cost Centres<br />
F725 Locked Zone 4 17 0 0 0 0 -<br />
F751 Blocked District 1 Fire 140 0 0 0 0 -<br />
F753 BlockFire D3 Rev&Cap 405 0 0 0 0 -<br />
F756 Blocked District 6 Fire 2,734 0 0 0 0 -<br />
F752 Blocked District 2 Fire 21 0 0 0 0 -<br />
3,316 0 0 0 0 -<br />
Total $52,633,420 $54,792,300 $54,569,448 $56,283,716 $1,491,416 2.7<br />
H19
Fire & Emergency Services<br />
Summary of Gross Revenue by Division<br />
2008-2009 2009-2010 2009-2010 2010-2011 Change over<br />
Actual Budget Projections Budget Budget Var as %<br />
Operations<br />
F110 Operations (404,990) (70,000) (278,427) (329,000) (259,000) 370.0<br />
F120 Training (14,393) 0 (1,690) 0 0 -<br />
F793 Rural Fire-Rural Op (171,094) (24,500) (22,548) (24,500) 0 -<br />
(590,477) (94,500) (302,665) (353,500) (259,000) 274.1<br />
Operations Support<br />
C801 Emergency Meas. Adm (1,173) 0 0 0 0 -<br />
F121 Career Development (7,142) 0 (8,165) 0 0 -<br />
F130 Prevention (26,237) 0 (10,300) 0 0 -<br />
F140 Administration (171,671) 0 9,261 0 0 -<br />
F141 Community Relations (3,400) 0 (1,000) 0 0 -<br />
F150 Mechanical Maint. (205) 0 0 0 0 -<br />
F160 Buildings & Logistic (26,224) 0 (14,800) 0 0 -<br />
F180 Safety & Strat. Init (1,677) 0 (51,307) 0 0 -<br />
F181 USAR Project (356,898) (450,000) 2,083 (300,000) 150,000 (33.3)<br />
F182 Corporate Safety 0 0 (7,103) 0 0 -<br />
(594,626) (450,000) (81,331) (300,000) 150,000 (33.3)<br />
Total (1,185,103) (544,500) (383,996) (653,500) (109,000) 20.0<br />
H20
Fire & Emergency Services<br />
Summary of Net Expenditures by Division<br />
2008-2009 2009-2010 2009-2010 2010-2011 Change over<br />
Actual Budget Projections Budget Budget Var as %<br />
Operations<br />
F110 Operations 35,192,963 37,010,500 36,457,096 38,496,700 1,486,200 4.0<br />
F120 Training 1,182,376 1,262,700 1,492,348 1,306,300 43,600 3.5<br />
F791 Rural Fire Debt Payments 710,874 800,900 804,200 815,160 14,260 1.8<br />
F792 Rural Fire Fleet Mtn 127,478 161,500 135,100 127,500 (34,000) (21.1)<br />
F793 Rural Fire-Rural Op 2,661,777 2,790,900 2,773,821 2,496,500 (294,400) (10.5)<br />
F724 Enfield 40,000 40,000 40,000 40,000 0 -<br />
F727 Milford Station 2,400 2,400 2,400 2,400 0 -<br />
F728 Hubbards Rural Fire 40,000 40,000 40,000 40,000 0 -<br />
39,957,867 42,108,900 41,744,965 43,324,560 1,215,660 2.9<br />
Operations Support<br />
A451 Emerg Measures Recov 25,000 25,000 25,000 (25,000) (100.0)<br />
C801 Emergency Meas. Adm 152,189 121,400 167,813 122,530 1,130 0.9<br />
F121 Career Development 210,740 303,700 266,649 154,545 (149,155) (49.1)<br />
F130 Prevention 1,162,897 1,775,200 1,661,060 1,826,700 51,500 2.9<br />
F140 Administration 5,000,714 4,929,200 5,155,056 5,255,880 326,680 6.6<br />
F141 Community Relations 120,724 137,200 136,430 134,500 (2,700) (2.0)<br />
F150 Mechanical Maint. 2,095,455 2,245,100 2,212,808 2,210,031 (35,069) (1.6)<br />
F160 Buildings & Logistic 1,893,506 1,889,700 2,075,535 2,032,100 142,400 7.5<br />
F180 Safety & Strat. Init 378,296 295,400 154,661 192,650 (102,750) (34.8)<br />
F181 USAR Project 13,296 150,000 143,703 100,000 (50,000) (33.3)<br />
F182 Corporate Safety 17,839 53,800 34,951 28,420 (25,380) (47.2)<br />
F190 Communications 416,477 213,200 406,821 248,300 35,100 16.5<br />
11,487,133 12,138,900 12,440,487 12,305,656 166,756 1.4<br />
Locked Cost Centres<br />
F725 Locked Zone 4 17 0 0 0 0 -<br />
F751 Blocked District 1 Fire 140 0 0 0 0 -<br />
F753 BlockFire D3 Rev&Cap 405 0 0 0 0 -<br />
F756 Blocked District 6 Fire 2,734 0 0 0 0 -<br />
F752 Blocked District 2 Fire 21 0 0 0 0 -<br />
3,316 0 0 0 0 -<br />
Total $51,448,316 $54,247,800 $54,185,452 $55,630,216 $1,382,416 2.5<br />
H21
Fire & Emergency Services<br />
Summary by Expenditure & Revenue Types<br />
2008-2009 2009-2010 2009-2010 2010-2011 Change over<br />
Actual Budget Projections Budget Budget Var as %<br />
Expenditures<br />
Compensation & Benefits 42,758,268 44,592,900 44,476,479 46,909,900 2,317,000 5.2<br />
Office 534,005 330,500 557,070 321,280 (9,220) (2.8)<br />
Professional Fees 6,537 5,000 90,000 5,000 0 -<br />
Legal & Consulting Fees 85,655 25,000 2,000 25,000 0 -<br />
External Services 235,140 275,900 220,420 278,900 3,000 1.1<br />
Uniforms & Clothing 497,926 670,300 657,250 670,300 0 -<br />
Salt 393 0 0 0 0 -<br />
Supplies & Materials 159,854 170,900 167,260 162,850 (8,050) (4.7)<br />
Utilities 430,565 479,500 391,337 412,800 (66,700) (13.9)<br />
Building Costs 721,029 788,800 1,094,130 788,800 0 -<br />
Equipment & Communications 2,100,728 2,146,400 1,609,414 1,666,300 (480,100) (22.4)<br />
Vehicle Expense 146,394 161,500 161,220 127,500 (34,000) (21.1)<br />
Travel 265,056 211,500 235,125 102,145 (109,355) (51.7)<br />
Training & Education 145,473 395,800 271,600 365,800 (30,000) (7.6)<br />
Facilities Rental 61,165 10,000 72,500 10,000 0 -<br />
Advertising & Promotion 44,811 20,000 23,400 18,000 (2,000) (10.0)<br />
Other Goods & Services 708,751 594,900 614,735 551,550 (43,350) (7.3)<br />
Interdepartmental 2,645,115 2,736,500 2,747,908 2,701,431 (35,069) (1.3)<br />
Debt-Interest 135,494 188,100 208,703 181,960 (6,140) (3.3)<br />
Debt Principal 575,379 612,800 595,497 633,200 20,400 3.3<br />
Insurance Costs 60,479 60,000 62,400 60,000 0 -<br />
Grants & Tax Concessions 30,201 31,000 26,000 31,000 0 -<br />
Transfer to/from Reserves 285,000 285,000 285,000 260,000 (25,000) (8.8)<br />
Expenditures 52,633,420 54,792,300 54,569,448 56,283,716 1,491,416 2.7<br />
Total $52,633,420 $54,792,300 $54,569,448 $56,283,716 $1,491,416 2.7<br />
Revenues<br />
Fines and Fees (69,030) (70,000) (74,000) (70,000) 0 -<br />
Rental & Leasing (40,279) 0 (27,384) 0 0 -<br />
Other Revenue (1,075,795) (474,500) (282,612) (583,500) (109,000) 23.0<br />
Revenues (1,185,103) (544,500) (383,996) (653,500) (109,000) 20.0<br />
Total (1,185,103) (544,500) (383,996) (653,500) (109,000) 20.0<br />
Net Cost $51,448,316 $54,247,800 $54,185,452 $55,630,216 $1,382,416 2.5<br />
H22
<strong>Halifax</strong> <strong>Regional</strong> <strong>Municipality</strong><br />
2010/11 Business Plan and Budget (Proposed) Fiscal Services<br />
Fiscal Services<br />
Business Plan<br />
2010/11<br />
I1
<strong>Halifax</strong> <strong>Regional</strong> <strong>Municipality</strong><br />
2010/11 Business Plan and Budget (Proposed) Fiscal Services<br />
Business Unit Overview:<br />
Fiscal Services is not a traditional business unit. As part of normal HRM operations, there are responsibilities and<br />
obligations that are not related to any specific operational or support business unit.<br />
Fiscal Services encompasses all non-departmental revenues and non-departmental obligations. The major components of<br />
Fiscal Services include:<br />
Property Tax Revenue<br />
Education Costs<br />
Hydrants<br />
Insurance Costs<br />
Transfers to Outside Agencies<br />
Debt Charges<br />
Reserve Transactions<br />
Valuation Allowances<br />
Capital and <strong>Operating</strong> Grants<br />
<strong>Operating</strong> Cost of Capital<br />
Management responsibility for Fiscal Services resides in various business units with primary responsibility being held by<br />
the Office of the Chief Administrator and Finance.<br />
Summary of 2010/11 <strong>Operating</strong> Budget<br />
Revenues<br />
Amount<br />
Residential Property Taxes (net of appeals) (182,954,000)<br />
Commercial, Resource & Business Occupancy Property Taxes (net of appeals) (182,866,000)<br />
Deed Transfer Taxes (30,000,000)<br />
Payment in Lieu of Taxes & Tax Agreements (37,577,038)<br />
HRWC Water Dividend (3,700,000)<br />
Area Rates for Supplementary Education (19,025,000)<br />
Provincial Area Rates (112,253,518)<br />
Area Rate for Fire Protection (9,142,000)<br />
Interest Revenue (3,332,000)<br />
LIC & HRWC Recoverable Debt Charges (3,497,191)<br />
HST offset Unconditional Grant (3,000,000)<br />
Other Revenue (6,133,606)<br />
Total Revenues (593,480,353)<br />
I2
<strong>Halifax</strong> <strong>Regional</strong> <strong>Municipality</strong><br />
2010/11 Business Plan and Budget (Proposed) Fiscal Services<br />
Expenditures<br />
Debt Charges (Principal & Interest) 38,632,312<br />
Transfer to Reserves 25,662,736<br />
Insurance Policy/Premium 4,550,600<br />
Supplementary Education 19,025,000<br />
Mandatory Provincial Payments 112,171,202<br />
Fire Protection (Hydrants) 9,142,000<br />
Grants & Tax Concessions 5,453,900<br />
<strong>Operating</strong> Costs of New Capital 8,849,200<br />
Provision for Valuation Allowance 3,500,000<br />
Capital from <strong>Operating</strong> 33,098,624<br />
Retirement Obligations 2,258,670<br />
Transfers to Agencies 721,800<br />
Other Expenditures 4,239,499<br />
Total Expenditures 267,305,543<br />
Fiscal Services Net Budget (326,174,810)<br />
Analysis of Budget Changes<br />
Approved 2009/10 Business Plan Base Budget (323,190,288)<br />
Increase in Property Tax Revenue (10,313,400)<br />
Increase Debt Charges (Principal & Interest) (1,485,946)<br />
Increase in Revenue in Lieu of Taxes & Tax Agreements (2,738,138)<br />
Increase in Deed Transfer Taxes (570,000)<br />
Increase in Transfer to Reserves 12,453,236<br />
Increase in Capital from <strong>Operating</strong> (751,076)<br />
Increase in Grants & Tax Concessions (146,000)<br />
Increase in HST Offset (200,000)<br />
Decrease in Interest Revenue 2,383,000<br />
Increase in <strong>Operating</strong> Costs of New Capital 5,949,200<br />
Other Fiscal Transactions (net) (7,565,398)<br />
Proposed 2010/11 Budget (326,174,810)<br />
I3
<strong>Halifax</strong> <strong>Regional</strong> <strong>Municipality</strong><br />
2010/11 Business Plan and Budget (Proposed) Fiscal Services<br />
Key Obligations and Responsibilities<br />
The following challenges and opportunities will have an impact on Fiscal Services during the 2010/11 time frame.<br />
Obligations / Responsibilities:<br />
Debt Repayment and Servicing<br />
Debt charges consist of payments made on outstanding debentures (principal) and the interest costs associated with those<br />
debentures. Also included in the debt charges are other costs relating to bank charges, debenture discount and interest<br />
payments to Agencies, Boards & Commissions totaling about $1million. Not all HRM’s debt charges are included in<br />
Fiscal Services. The debt charges for Metro Transit, Solid Waste, Fire and some Area Rates are allocated to their<br />
respective departments. HRM’s current debt charges of $45.4 million represent 6.2% of gross expenditures. The<br />
2010 - 11 Net HRM Debt Charges By Business Unit<br />
Principal Interest Other Totals<br />
Fiscal Services (Note 1,2) 25,416,660 7,607,467 582,288 33,606,415<br />
Metro Transit 5,121,802 1,227,978 6,349,780<br />
Solid Waste 2,584,797 816,455 3,401,252<br />
Other (Fire & Area Rates) 1,362,512 652,595 2,015,107<br />
Totals 34,485,771 10,304,495 582,288 45,372,554<br />
Note 1: Other costs are broken-down as: Debenture Discounts ($288,288) and, Bank Charges ($302,000).<br />
Note 2: Gross principal debt charges are $37,394,285 with $2,908,514 in recoveries from LIC and HRWC netting to $34,485,770.Gross<br />
interest charges are $11,095,378 with $790,883 in recoveries from LIC and HRWC netting to $10,304,495.<br />
I4
<strong>Halifax</strong> <strong>Regional</strong> <strong>Municipality</strong><br />
2010/11 Business Plan and Budget (Proposed) Fiscal Services<br />
Obligations / Responsibilities:<br />
Reserve Funding<br />
Reserves assist in planning for HRM’s future needs. In general, reserve funds are intended to serve three purposes:<br />
a) they allow for a smoothing of expenditures that might otherwise require an extreme single year outlay;<br />
b) they allow for long term planning of major capital expenditures; and<br />
c) they assist with cash flow management and can reduce the issuance of debt, acting as “savings” for future needs.<br />
Therefore, reserves are a means by which HRM can accumulate funds for an anticipated future requirement. The<br />
following is a list of reserves funded from the Fiscal Services' proposed operating budget in 2010/11 fiscal year. (A<br />
complete list of all HRM Reserves is shown under the Reserves Section of this Proposed 2010/11 <strong>Operating</strong> Budget<br />
Reserve Transactions:<br />
Amount<br />
Transfers to Reserves<br />
Q126 Strategic Growth Reserve 5,000,000<br />
Q120 Otter Lake Landfill Closures 10,000,000<br />
Q129 Ferry Replacement Reserve 1,300,000<br />
Q308 Operations Stabilization Reserve 2,698,700<br />
Q309 Snow and Ice Reserve 4,677,211<br />
Q133 CCC Bedford South Interchange Reserve 450,000<br />
Q206 Fire Vehicle Equipment Reserve 300,000<br />
Q125 Metro Park Parkade Reserve 223,800<br />
Q313 Municipal Elections Reserve 400,000<br />
Q316 DNA Costs (HRP and RCMP) Reserve 113,025<br />
Q321 Information & Communication Technologies (ICT) Reserve 500,000<br />
Total 25,662,736<br />
Analysis of Reserve Budget Changes<br />
Changes in Funding<br />
Approved 2009/10 Reserve Transfer Budget 13,209,500<br />
Increase in Q120 Otter Lake Landfill Closures 10,000,000<br />
Decreased in New Debt Servicing Reserve (3,000,000)<br />
Increase in Q308 Operations Stabilization Reserve 2,698,700<br />
Increase in Q313 Municipal Elections Reserve 400,000<br />
Increase in Q321 Information & Communications Technologies Reserve 500,000<br />
Increase in Q309 Snow and Ice Reserve 4,052,611<br />
Increase in Q316 DNA Costs (HRP and RCMP) Reserve 1,925<br />
Decrease in Reserve Interest (2,200,000)<br />
Increase in Funding Transfers to Reserves 12,453,236<br />
Proposed Reserve Transfer Total 25,662,736<br />
Certain other reserve transactions are included within departmental budgets. All transactions are consistent with the<br />
HRM Reserve Budget and Multi-Year Financial Strategy.<br />
I5
<strong>Halifax</strong> <strong>Regional</strong> <strong>Municipality</strong><br />
2010/11 Business Plan and Budget (Proposed) Fiscal Services<br />
Obligations / Responsibilities:<br />
Transfers to Outside Agencies<br />
HRM has an obligation and responsibility to provide funding to outside agencies or collect funding on their behalf for<br />
education costs, fire protection and for other services provided by the Province of Nova Scotia. These funding<br />
arrangements are either required under the MGA, agreements signed by HRM or its predecessor municipalities with the<br />
Province of Nova Scotia.<br />
1) Supplementary Education<br />
Since 1996-97, the year of amalgamation, HRM has provided funding to the <strong>Halifax</strong> <strong>Regional</strong> School Board (HRSB) for<br />
the former cities of <strong>Halifax</strong> and Dartmouth. In 2000-01 Council added an area rate for use in the Bedford-County areas<br />
under the MGA. As of April 1, 2006 these funds are shared with the Conseil scolaire acadien provincial (CSAP), the<br />
province-wide Acadian school board. Fiscal year 2010-11 is the fourth year of a four-year plan to unify the area rates for<br />
Supplementary Education. As per HRM's agreement with the school boards, the total payment for 2010-11 will be<br />
$19,025,000.<br />
2) Mandatory Education and Services Provided by the Province of Nova Scotia<br />
The funding source for the following transfers is the Provincial Area Rates and any increase in the budget amount has<br />
zero net impact to the overall HRM's budget.<br />
Mandatory Education<br />
Since 1996/97, the year of amalgamation, HRM has been required to provide funding to the <strong>Halifax</strong> <strong>Regional</strong> School<br />
Board (HRSB) under the Municipal Government Act (MGA). This mandatory education contribution is set at the value<br />
of the “Education Rate” times the “Uniform Assessment”. The estimate for 10/11 is $96.9 million, which is unchanged<br />
from the prior year.<br />
Assessment<br />
In 2001/02 HRM was notified by the Province that it would be required to pay a share of the cost of operating the<br />
provincial assessment system. HRM pays an amount equal to the total provincial assessment costs times the average of<br />
(1) HRM’s share of Uniform Assessment, and (2) HRM’s share of assessment accounts. The estimate for 10/11 is $6.6<br />
million, an increase of $205k over previous year’s budget.<br />
Correctional Services<br />
HRM is required (as are all municipalities) to make a mandatory contribution to the Province to fund the cost of<br />
correctional services. The contribution amount is set by Provincial formula. HRM’s budgeted amount of $7.9 million for<br />
2010/11 is based upon assumed changes in CPI and uniform assessment.<br />
The following is a list of budgeted 2010/11 fiscal year payments mandated by the Province:<br />
Estimated Amount<br />
<strong>Halifax</strong> <strong>Regional</strong> School Board - Mandatory Education 96,976,800<br />
Assessment Services 6,616,491<br />
Correctional Services 6,358,796<br />
Metropolitan <strong>Regional</strong> Housing Authority 2,301,431<br />
Total Transfers 112,253,518<br />
Deficits for Area Rates related to Provincial Services to be collected in 2010/11 0<br />
I6
<strong>Halifax</strong> <strong>Regional</strong> <strong>Municipality</strong><br />
2010/11 Business Plan and Budget (Proposed) Fiscal Services<br />
World Trade Center<br />
HRM has an agreement to fund the World Trade Centre. For the 2010/11 fiscal year, HRM has budgeted an amount of<br />
$588,000 in order to meet its obligations. There is no increase compared to previous year's budget based upon <strong>Halifax</strong><br />
CPI.<br />
3) Fire Protection Services (Hydrants)<br />
The Nova Scotia Utilities and Review Board (NSUARB) requires HRM to make a contribution to fund the operations of<br />
the <strong>Halifax</strong> <strong>Regional</strong> Water Commission (HRWC). This contribution is used to fund the hydrant costs incurred by the<br />
Commission and is set by a formula approved by the NSUARB. The hydrant charges are recovered via a special “Fire<br />
Protection” area rate that HRM levies on all properties within 1,200 feet of a hydrant that is designed and operated for<br />
public fire protection purposes.<br />
The amount required for the 10/11 Area Rate is $9,142,000. This amount is higher than previous years as last year,<br />
$4,833,500 from previously collected funds was allocated in order to decrease the rate for 2009/10.<br />
Obligations / Responsibilities:<br />
Grants to Non-Profit Organizations<br />
Included within Fiscal Services are various grants and tax concessions to registered Non-Profit Organizations. The<br />
2010/11 proposed budget includes the following amounts:<br />
Amount<br />
Community Grants 572,700<br />
Residential Tax Exemptions/Low Income Contingency 1,486,400<br />
Non-Profit Tax Concessions 2,823,700<br />
Fire Protection/Commercial Tax Concessions 571,100<br />
Total 5,453,900<br />
HRM’s residential tax relief programs consist of rebate and deferral programs targeted at those households with annual<br />
income of less than $29,000 per annum.<br />
Changes over the 2010/11 budget are: an decrease of $25,000 for the Residential Tax Exemption Program based on<br />
reduced uptake on the program, an increase of $510,000 for the Barrington Heritage District Financial Incentives (Tax<br />
Credits), and an increase of $299,000 for the Non-Profit Tax Exemption program based on increased average<br />
assessments and increased commercial tax rates, and an increase of $70,000 in the Residential Fire Exemptions program.<br />
Obligations / Responsibilities:<br />
<strong>Operating</strong> Costs of New Capital<br />
Included within Fiscal Services is a net amount of $9.7 million to provide for the operating costs associated with new<br />
capital projects proposed for 2010/11. Funds for such projects are held in Fiscal until such time as the capital project is<br />
complete. At that time, they are transferred to the relevant business unit.<br />
I7
<strong>Halifax</strong> <strong>Regional</strong> <strong>Municipality</strong><br />
2010/11 Business Plan and Budget (Proposed) Fiscal Services<br />
Obligations / Responsibilities:<br />
Other Fiscal Transactions<br />
Also included within Fiscal Services are a variety of other financial transactions not directly tied to program operations.<br />
For instance, provisions for payments to the capital fund to offset debt costs (Capital From <strong>Operating</strong> or “Pay as You<br />
Go”) are normally included here. In 2010/11 HRM has budgeted for $32.0 million in Capital from <strong>Operating</strong>.<br />
HRM has also included Provisions for Uncollected Debts of $3.5 million in 10/11 compared to $3.1 million in 09/10.<br />
These amounts include approximately $2.4 million in respect of Grants-in-Lieu from the Federal and Provincial<br />
Governments for which HRM may be unable to enforce collection. HRM has also budgeted $0.7 million for outstanding<br />
assessment appeals, and $0.3 million for non-tax receivables and related items. This provision is required by the<br />
Province of Nova Scotia’s Financial Reporting and Accounting Manual (FRAM).<br />
Fiscal Services includes a variety of other revenues and expenditures amounts which include provisions for salary and<br />
wage compensation for collective bargaining and others are:<br />
Expenditures<br />
Insurance Claims 4,550,600<br />
Compensation PPP (Retirement Obligation) 2,258,670<br />
Revenues<br />
Unconditional Transfers (HST Offset) (3,000,000)<br />
Parking Meters (2,630,000)<br />
I8
Fiscal Services<br />
Summary of Gross Expenditures by Division<br />
2008-2009 2009-2010 2009-2010 2010-2011 Change over<br />
Actual Budget Projections Budget Budget Var as %<br />
Private Roads<br />
R756 Petpeswick Drive 3,000 3,200 3,200 3,200 0 -<br />
R757 Three Brooks Home Ow 0 53,940 53,940 53,940 0 -<br />
3,000 57,140 57,140 57,140 0 -<br />
Debt Servicing<br />
M110 Debt & Interest Chg 40,594,344 46,189,588 45,444,147 45,372,554 (817,034) (1.8)<br />
M112 Alloc Debt Chg to BU (12,732,574) (10,163,826) (10,163,826) (11,766,138) (1,602,312) 15.8<br />
M113 Int.Pmt-Gen Govt 1,523,333 0 0 0 0 -<br />
M114 Int.Pmt-Protect.Serv 597,713 0 0 0 0 -<br />
M115 Int.Pmt-Transp.Serv. 4,367,276 0 0 0 0 -<br />
M118 Int.Pmt-CD Planning 221,216 0 0 0 0 -<br />
M119 Int.Pmt-CD Rec. 593,890 0 0 0 0 -<br />
M122 HRWC Debt Charges 413,718 1,637,607 1,637,607 1,335,506 (302,101) (18.4)<br />
M530 Local Improvement Charges 4,165,570 3,781,392 3,781,392 3,690,391 (91,001) (2.4)<br />
39,744,486 41,444,761 40,699,320 38,632,313 (2,812,448) (6.8)<br />
Transfers To Outside Agencies<br />
M230 Corrections Services 7,906,837 7,983,000 7,983,000 6,358,796 (1,624,204) (20.3)<br />
M240 Metro Housing Authority 2,629,553 2,726,500 2,726,500 2,219,115 (507,385) (18.6)<br />
M250 World Trade Centre 570,168 588,000 588,000 588,000 0 -<br />
M280 Mandatory Education 93,092,130 96,565,200 96,565,200 96,976,800 411,600 0.4<br />
M284 Suppl Education HFX (0) 0 0 0 0 -<br />
M285 Suppl Ed Dartmouth 0 0 0 0 0 -<br />
M287 Suppl Educ.-CSAP 0 0 0 0 0 -<br />
M288 Suppl Educ HRM-wide 20,320,127 19,705,700 19,705,700 19,025,000 (680,700) (3.5)<br />
M291 Fire Protection (Hydrants) 9,504,591 4,969,000 4,969,000 9,142,000 4,173,000 84.0<br />
M292 NSLC Area Rate 1,093,979 0 0 0 0 -<br />
M318 Prop Valuation Serv 6,132,881 6,300,500 6,300,500 6,616,491 315,991 5.0<br />
141,250,267 138,837,900 138,837,900 140,926,202 2,088,302 1.5<br />
Other Fiscal Services<br />
M270 Compensation PPP 2,423,737 2,343,800 2,343,800 2,258,670 (85,130) (3.6)<br />
M310 Other Fiscal Serv. 2,248,744 9,793,550 9,342,950 3,456,858 (6,336,692) (64.7)<br />
M311 Grants & Tax Concessions 3,894,650 4,264,800 4,445,800 4,813,800 549,000 12.9<br />
M341 Surplus/Deficit 0 0 (825,000) 0 0 -<br />
M351 Managers Contingency 31,183 100,000 100,000 100,000 0 -<br />
M361 Councillors Discreti 68,850 69,000 69,000 69,000 0 -<br />
M451 Valuation Allowance 3,501,671 3,100,000 3,500,000 3,500,000 400,000 12.9<br />
12,168,835 19,671,150 18,976,550 14,198,328 (5,472,822) (27.8)<br />
Transfers to/fr Other Funds<br />
M316 Strategic Growth Fund 5,000,000 5,000,000 5,000,000 15,000,000 10,000,000 200.0<br />
M317 Oper Costs New Cap 3,194,866 2,900,000 2,872,378 8,849,200 5,949,200 205.1<br />
M319 DNA Reserve 111,100 111,100 111,100 113,025 1,925 1.7<br />
M320 Insurance Claims 4,183,061 4,200,000 4,200,000 4,550,600 350,600 8.3<br />
M321 Ferry Replacement Reserve 0 1,300,000 1,300,000 1,300,000 0 -<br />
M322 New Cap Replace Res 500,000 0 0 500,000 500,000 -<br />
M323 InsuranceReimb.Claim 136,743 0 0 0 0 -<br />
M325 CCC Bedford South Reserve 450,000 450,000 450,000 450,000 0 -<br />
M411 Oper Stabiliz Resrv 0 0 0 2,473,700 2,473,700 -<br />
M441 Interest on Reserves 3,995,859 2,265,000 1,233,000 0 (2,265,000) (100.0)<br />
M461 Capital Fr <strong>Operating</strong> 32,583,000 33,849,700 33,849,700 33,098,624 (751,076) (2.2)<br />
M471 Other Transfers 5,028,000 3,924,600 924,600 5,602,211 1,677,611 42.7<br />
55,182,629 54,000,400 49,940,778 71,937,360 17,936,960 33.2<br />
Non-Departmental Revenue<br />
M555 Parkade 1,718,353 1,554,100 1,554,100 1,554,100 0 -<br />
M580 Fiscal Services 412 100 100 100 0 -<br />
1,718,765 1,554,200 1,554,200 1,554,200 0 -<br />
Total $250,067,982 $255,565,551 $250,065,888 $267,305,543 $11,739,992 4.6<br />
I9
Fiscal Services<br />
Summary of Gross Revenue by Division<br />
2008-2009 2009-2010 2009-2010 2010-2011 Change over<br />
Actual Budget Projections Budget Budget Var as %<br />
Private Roads<br />
R756 Petpeswick Drive (3,200) (3,200) (3,200) (3,200) 0 -<br />
R757 Three Brooks Home Ow 0 (53,940) (53,940) (53,940) 0 -<br />
(3,200) (57,140) (57,140) (57,140) 0 -<br />
Debt Servicing<br />
M110 Debt & Interest Chg (3,613) 0 0 0 0 -<br />
M122 HRWC Debt Charges (413,718) (1,637,607) (1,637,607) (1,335,506) 302,101 (18.4)<br />
M530 Local Improvement Charges (3,660,304) (3,781,392) (3,781,392) (3,690,391) 91,001 (2.4)<br />
(4,077,635) (5,418,999) (5,418,999) (5,025,897) 393,102 (7.3)<br />
Transfers To Outside Agencies<br />
M230 Corrections Services (7,842,599) (7,983,000) (7,983,000) (6,358,796) 1,624,204 (20.3)<br />
M240 Metro Housing Authority (2,377,867) (2,726,500) (2,726,500) (2,219,115) 507,385 (18.6)<br />
M280 Mandatory Education (93,110,924) (96,565,200) (96,565,200) (96,976,800) (411,600) 0.4<br />
M284 Suppl Education HFX (0) 0 0 0 0 -<br />
M285 Suppl Ed Dartmouth 0 0 0 0 0 -<br />
M286 Suppl Ed County/Bed (0) 0 0 0 0 -<br />
M288 Suppl Educ HRM-wide (20,110,519) (19,705,700) (19,705,700) (19,025,000) 680,700 (3.5)<br />
M292 NSLC Area Rate (1,093,979) 0 0 0 0 -<br />
M318 Prop Valuation Serv (6,244,199) (6,300,500) (6,300,500) (6,616,491) (315,991) 5.0<br />
(130,780,088) (133,280,900) (133,280,900) (131,196,202) 2,084,698 (1.6)<br />
Other Fiscal Services<br />
M310 Other Fiscal Serv. (273,838) (435,000) (537,500) (526,860) (91,860) 21.1<br />
M311 Grants & Tax Concessions (32,578) 0 0 0 0 -<br />
M451 Valuation Allowance (20,713) 0 0 0 0 -<br />
(327,129) (435,000) (537,500) (526,860) (91,860) 21.1<br />
Transfers to/fr Other Funds<br />
M320 Insurance Claims 16,939 0 0 0 0 -<br />
M323 InsuranceReimb.Claim (136,743) 0 0 0 0 -<br />
(119,805) 0 0 0 0 -<br />
Non-Departmental Revenue<br />
M510 Property Tax (376,245,899) (364,112,400) (362,156,148) (383,503,740) (19,391,340) 5.3<br />
M520 Deed Transfer (35,166,329) (29,430,000) (30,500,000) (30,000,000) (570,000) 1.9<br />
M540 Grants in Lieu (27,828,898) (29,514,900) (28,545,958) (28,842,098) 672,802 (2.3)<br />
M550 Own Source Revenue (17,442,500) (12,070,000) (11,109,000) (9,692,000) 2,378,000 (19.7)<br />
M555 Parkade (1,718,353) (1,554,100) (1,554,100) (1,554,100) 0 -<br />
M560 Unconditional Trans. (3,319,321) (2,800,000) (3,275,000) (3,000,000) (200,000) 7.1<br />
M570 Conditional Transfer (82,400) (82,400) (82,400) (82,316) 84 (0.1)<br />
M580 Fiscal Services (820) 0 0 0 0 -<br />
(461,804,520) (439,563,800) (437,222,606) (456,674,254) (17,110,454) 3.9<br />
Total (597,112,377) (578,755,839) (576,517,145) (593,480,353) (14,724,514) 2.5<br />
I10
Fiscal Services<br />
Summary of Net Expenditures by Division<br />
2008-2009 2009-2010 2009-2010 2010-2011 Change over<br />
Actual Budget Projections Budget Budget Var as %<br />
Private Roads<br />
R756 Petpeswick Drive (200) 0 0 0 0 -<br />
(200) 0 0 0 0 -<br />
Debt Servicing<br />
M110 Debt & Interest Chg 40,590,730 46,189,588 45,444,147 45,372,554 (817,034) (1.8)<br />
M112 Alloc Debt Chg to BU (12,732,574) (10,163,826) (10,163,826) (11,766,138) (1,602,312) 15.8<br />
M113 Int.Pmt-Gen Govt 1,523,333 0 0 0 0 -<br />
M114 Int.Pmt-Protect.Serv 597,713 0 0 0 0 -<br />
M115 Int.Pmt-Transp.Serv. 4,367,276 0 0 0 0 -<br />
M118 Int.Pmt-CD Planning 221,216 0 0 0 0 -<br />
M119 Int.Pmt-CD Rec. 593,890 0 0 0 0 -<br />
M530 Local Improvement Charg 505,267 0 0 0 0 -<br />
35,666,851 36,025,762 35,280,321 33,606,416 (2,419,346) (6.7)<br />
Transfers To Outside Agencies<br />
M230 Corrections Services 64,238 0 0 0 0 -<br />
M240 Metro Housing Authority 251,686 0 0 0 0 -<br />
M250 World Trade Centre 570,168 588,000 588,000 588,000 0 -<br />
M280 Mandatory Education (18,794) 0 0 0 0 -<br />
M284 Suppl Education HFX (0) 0 0 0 0 -<br />
M285 Suppl Ed Dartmouth 1 0 0 0 0 -<br />
M286 Suppl Ed County/Bed (0) 0 0 0 0 -<br />
M287 Suppl Educ.-CSAP 0 0 0 0 0 -<br />
M288 Suppl Educ HRM-wide 209,608 0 0 0 0 -<br />
M291 Fire Protection (Hydrants) 9,504,591 4,969,000 4,969,000 9,142,000 4,173,000 84.0<br />
M318 Prop Valuation Serv (111,318) 0 0 0 0 -<br />
10,470,179 5,557,000 5,557,000 9,730,000 4,173,000 75.1<br />
Other Fiscal Services<br />
M270 Compensation PPP 2,423,737 2,343,800 2,343,800 2,258,670 (85,130) (3.6)<br />
M310 Other Fiscal Serv. 1,974,906 9,358,550 8,805,450 2,929,998 (6,428,552) (68.7)<br />
M311 Grants & Tax Concessions 3,862,072 4,264,800 4,445,800 4,813,800 549,000 12.9<br />
M341 Surplus/Deficit 0 0 (825,000) 0 0 -<br />
M351 Managers Contingency 31,183 100,000 100,000 100,000 0 -<br />
M361 Councillors Discreti 68,850 69,000 69,000 69,000 0 -<br />
M451 Valuation Allowance 3,480,958 3,100,000 3,500,000 3,500,000 400,000 12.9<br />
11,841,706 19,236,150 18,439,050 13,671,468 (5,564,682) (28.9)<br />
Transfers to/fr Other Funds<br />
M316 Strategic Growth Fund 5,000,000 5,000,000 5,000,000 15,000,000 10,000,000 200.0<br />
M317 Oper Costs New Cap 3,194,866 2,900,000 2,872,378 8,849,200 5,949,200 205.1<br />
M319 DNA Reserve 111,100 111,100 111,100 113,025 1,925 1.7<br />
M320 Insurance Claims 4,200,000 4,200,000 4,200,000 4,550,600 350,600 8.3<br />
M321 Ferry Replacement Reserv 0 1,300,000 1,300,000 1,300,000 0 -<br />
M322 New Cap Replace Res 500,000 0 0 500,000 500,000 -<br />
M323 InsuranceReimb.Claim (0) 0 0 0 0 -<br />
M325 CCC Bedford South Reser 450,000 450,000 450,000 450,000 0 -<br />
M411 Oper Stabiliz Resrv 0 0 0 2,473,700 2,473,700 -<br />
M441 Interest on Reserves 3,995,859 2,265,000 1,233,000 0 (2,265,000) (100.0)<br />
M461 Capital Fr <strong>Operating</strong> 32,583,000 33,849,700 33,849,700 33,098,624 (751,076) (2.2)<br />
M471 Other Transfers 5,028,000 3,924,600 924,600 5,602,211 1,677,611 42.7<br />
55,062,824 54,000,400 49,940,778 71,937,360 17,936,960 33.2<br />
Non-Departmental Revenue<br />
M510 Property Tax (376,245,899) (364,112,400) (362,156,148) (383,503,740) (19,391,340) 5.3<br />
M520 Deed Transfer (35,166,329) (29,430,000) (30,500,000) (30,000,000) (570,000) 1.9<br />
M540 Grants in Lieu (27,828,898) (29,514,900) (28,545,958) (28,842,098) 672,802 (2.3)<br />
M550 Own Source Revenue (17,442,500) (12,070,000) (11,109,000) (9,692,000) 2,378,000 (19.7)<br />
M560 Unconditional Trans. (3,319,321) (2,800,000) (3,275,000) (3,000,000) (200,000) 7.1<br />
M570 Conditional Transfer (82,400) (82,400) (82,400) (82,316) 84 (0.1)<br />
M580 Fiscal Services (408) 100 100 100 0 -<br />
(460,085,755) (438,009,600) (435,668,406) (455,120,054) (17,110,454) 3.9<br />
Total (347,044,395) (323,190,288) (326,451,257) (326,174,810) (2,984,522) 0.9<br />
I11
Fiscal Services<br />
Summary by Expenditure & Revenue Types<br />
2008-2009 2009-2010 2009-2010 2010-2011 Change over<br />
Actual Budget Projections Budget Budget Var as %<br />
Expenditures<br />
Compensation & Benefits 3,622,022 6,465,400 6,195,800 1,947,870 (4,517,530) (69.9)<br />
Office 4,680 0 0 0 0 -<br />
Legal & Consulting Fees 95,001 0 0 0 0 -<br />
External Services 133,043 34,550 34,550 34,550 0 -<br />
Supplies & Materials 5,817 0 0 0 0 -<br />
Building Costs 6,018 0 0 0 0 -<br />
Equipment & Communications 10,642 0 0 0 0 -<br />
Vehicle Expense 304,267 0 0 0 0 -<br />
Travel 3,011 0 0 0 0 -<br />
Training & Education 2,902 0 0 0 0 -<br />
Advertising & Promotion 1,090 0 0 0 0 -<br />
Other Goods & Services 2,594,173 3,827,300 3,799,678 11,642,408 7,815,108 204.2<br />
Interdepartmental 87,886 87,800 87,800 87,800 0 -<br />
Debt-Interest 9,962,468 10,274,126 9,528,685 8,398,351 (1,875,775) (18.3)<br />
Debt Principal 27,243,730 29,170,062 29,170,062 28,325,174 (844,888) (2.9)<br />
Transfer Outside Agencies 130,106,353 137,472,740 137,472,740 132,563,142 (4,909,598) (3.6)<br />
Insurance Costs 3,105,316 4,200,000 4,200,000 4,550,600 350,600 8.3<br />
Grants & Tax Concessions 3,963,500 5,599,900 5,599,900 5,453,900 (146,000) (2.6)<br />
Transfer to/from Reserves 20,636,399 13,209,500 9,177,500 25,662,736 12,453,236 94.3<br />
Fire Protection 9,504,591 9,802,500 9,802,500 9,142,000 (660,500) (6.7)<br />
Capital from <strong>Operating</strong> 30,983,000 33,849,700 33,849,700 33,098,624 (751,076) (2.2)<br />
Debenture Discount 381,590 372,073 372,073 280,288 (91,785) (24.7)<br />
Provision for Allowance 3,501,671 3,100,000 3,500,000 3,500,000 400,000 12.9<br />
Other Fiscal 2,934,269 2,683,100 2,683,100 2,618,100 (65,000) (2.4)<br />
Prior year Surplus/Deficit 874,544 (4,583,200) (5,408,200) 4,583,200 (100.0)<br />
Expenditures 250,067,982 255,565,551 250,065,888 267,305,543 11,739,992 4.6<br />
Total 250,067,982 255,565,551 250,065,888 267,305,543 11,739,992 4.6<br />
Revenues<br />
Tax Revenues (373,721,444) (362,737,292) (355,678,794) (377,132,691) (14,395,399) 4.0<br />
Deed Transfer Tax (35,166,329) (29,430,000) (30,500,000) (30,000,000) (570,000) 1.9<br />
Area Rate Revenue (132,539,288) (134,664,540) (134,664,540) (132,579,842) 2,084,698 (1.5)<br />
Tax Agreements (4,681,163) (3,830,000) (8,932,246) (8,734,940) (4,904,940) 128.1<br />
Payments in Lieu of taxes (27,828,898) (29,514,900) (28,545,958) (28,842,098) 672,802 (2.3)<br />
Transfers from other Gov'ts (3,401,721) (2,882,400) (3,357,400) (3,082,316) (199,916) 6.9<br />
Interest Revenue (11,154,165) (5,715,000) (4,754,000) (3,332,000) 2,383,000 (41.7)<br />
Parking Meters (2,638,668) (2,625,000) (2,625,000) (2,630,000) (5,000) 0.2<br />
Rental & Leasing (1,718,353) (1,554,100) (1,554,100) (1,554,100) 0 -<br />
Sales Revenue (154) 0 0 0 0 -<br />
HRWC Dividend (3,622,229) (3,700,000) (3,700,000) (3,700,000) 0 -<br />
Other Revenue (639,966) (2,102,607) (2,205,107) (1,892,366) 210,241 (10.0)<br />
Revenues (597,112,377) (578,755,839) (576,517,145) (593,480,353) (14,724,514) 2.5<br />
Total (597,112,377) (578,755,839) (576,517,145) (593,480,353) (14,724,514) 2.5<br />
Net Cost (347,044,395) (323,190,288) (326,451,257) (326,174,810) (2,984,522) 0.9<br />
I12
<strong>Halifax</strong> <strong>Regional</strong> <strong>Municipality</strong><br />
Summary of Non-Departmental Revenues<br />
2008-2009 2009-2010 2009-2010 2010-2011 Change over<br />
Actual Budget Projections Budget Budget Var as %<br />
Tax Revenues<br />
Res. Property Taxes (189,542,648) (173,858,600) (173,816,833) (183,371,000) (9,512,400) 5.5<br />
Commercial Property Taxes (147,591,319) (167,207,000) (159,960,000) (177,677,000) (10,470,000) 6.3<br />
Resource Property Taxes (1,343,498) (1,257,000) (1,226,459) (1,313,000) (56,000) 4.5<br />
Recreational Non Profit (12,689) 0 (13,470) 0 0 -<br />
Resource Forest Taxes (41,892) 0 (43,260) 0 0 -<br />
Commercial Forest Taxes (114,272) 0 (114,510) 0 0 -<br />
Farm Acreage Taxes (53,939) 0 0 0 0 -<br />
Fire Protection (11,112,949) (4,969,000) (5,065,853) (9,142,000) (4,173,000) 84.0<br />
Business Occupancy Taxes (23,011,385) (14,881,000) (14,400,000) (5,156,000) 9,725,000 (65.4)<br />
Capital Charges (2,998,282) (2,454,892) (2,454,892) (2,363,891) 91,001 (3.7)<br />
Bus. Occupancy Open. (2,222) 0 0 0 0 -<br />
Bus. Occupancy Close 65,243 0 0 0 0 -<br />
Bus.Occ. Appeals 157,479 123,000 0 123,000 0 -<br />
Allow Resid.Appeals 424,408 417,000 120,000 417,000 0 -<br />
Allow Comm.Appeals 964,063 1,143,000 1,100,000 1,143,000 0 -<br />
Allow Resource Appea 48,157 14,000 3,283 14,000 0 -<br />
Transfer - General Rate 96,700 37,800 37,800 37,800 0 -<br />
Transfer - Urban Rate 347,600 155,400 155,400 155,400 0 -<br />
(373,721,444) (362,737,292) (355,678,794) (377,132,691) (14,395,399) 4.0<br />
Deed Transfer Tax<br />
Deed Transfer Taxes (35,166,329) (29,430,000) (30,500,000) (30,000,000) (570,000) 1.9<br />
(35,166,329) (29,430,000) (30,500,000) (30,000,000) (570,000) 1.9<br />
Area Rate Revenue<br />
Area Rate Revenue (130,783,288) (133,338,040) (133,338,040) (131,253,342) 2,084,698 (1.6)<br />
Area Rate LIC Residential (600,303) (940,000) (940,000) (940,000) 0 -<br />
Area Rate LIC Commercial (61,718) (386,500) (386,500) (386,500) 0 -<br />
Transfer from Area Rate (1,093,979) 0 0 0 0 -<br />
(132,539,288) (134,664,540) (134,664,540) (132,579,842) 2,084,698 (1.5)<br />
Tax Agreements<br />
Tax Agreement - NSLC (536,127) (550,000) (556,009) (570,000) (20,000) 3.6<br />
Tax Agreement - NSPI (2,162,497) (2,132,000) (2,162,497) (2,162,500) (30,500) 1.4<br />
Tax Agreement - MT&T (2,996,254) (2,636,000) (2,614,110) (2,600,000) 36,000 (1.4)<br />
Tax Agreement -NAM 0 0 (6,440) (6,440) (6,440) -<br />
Tax Agreement - Impe 0 0 (3,608,000) (3,608,000) (3,608,000) -<br />
Tax Agreement - Mari 0 0 (1,397,176) (1,248,000) (1,248,000) -<br />
Tax Agreement - Heritage 0 0 (134,521) (140,000) (140,000) -<br />
Tax Agreement - Other (6,375) (6,000) 0 0 6,000 (100.0)<br />
Hfx Int'l Tax O-set 1,020,090 1,494,000 1,546,507 1,600,000 106,000 7.1<br />
(4,681,163) (3,830,000) (8,932,246) (8,734,940) (4,904,940) 128.1<br />
Payments in Lieu of taxes<br />
Grant in Lieu - Federal (18,368,481) (17,651,600) (17,419,262) (18,081,000) (429,400) 2.4<br />
Grant in Lieu-Prov. (5,767,586) (6,007,700) (5,886,129) (6,029,500) (21,800) 0.4<br />
Grant in Lieu-CPC (532,594) (558,000) (544,736) (627,160) (69,160) 12.4<br />
Grant Lieu-Hflx Port (1,732,478) (1,935,200) (1,876,195) (1,894,000) 41,200 (2.1)<br />
Grant in Lieu - CBC (281,094) (300,900) (278,576) (297,000) 3,900 (1.3)<br />
Grant in Lieu - Via Rail (136,011) (140,600) (159,596) (167,000) (26,400) 18.8<br />
Grant in Lieu - WCB (139,920) (129,800) (126,673) (118,000) 11,800 (9.1)<br />
Grant in Lieu - Citadel 0 (1,610,700) (1,513,487) (1,546,000) 64,700 (4.0)<br />
Grant in Lieu-NRC 0 0 (69,055) (71,000) (71,000) -<br />
Grant in Lieu - Autoport 0 0 (661,251) 0 0 -<br />
Grant in Lieu - Other (870,735) (1,180,400) (10,998) (11,438) 1,168,962 (99.0)<br />
(27,828,898) (29,514,900) (28,545,958) (28,842,098) 672,802 (2.3)<br />
Transfers from other Gov'ts<br />
Uncond.Grant NS(oth) (3,319,321) (2,800,000) (3,275,000) (3,000,000) (200,000) 7.1<br />
Public House. Amort. (82,400) (82,400) (82,400) (82,316) 84 (0.1)<br />
(3,401,721) (2,882,400) (3,357,400) (3,082,316) (199,916) 6.9<br />
Interest Revenue<br />
Interest Revenue - Taxes (2,669,979) (2,222,000) (2,133,000) (2,240,000) (18,000) 0.8<br />
Int. Rev. - Invest. (314,024) (715,000) (150,000) 0 715,000 (100.0)<br />
Int. Rev. - Cap.Chrg (521,335) (413,000) (430,000) (440,000) (27,000) 6.5<br />
Interest Revenue - Other (228,439) (165,000) (140,000) (140,000) 25,000 (15.2)<br />
Investment Income (7,420,388) (2,200,000) (1,901,000) (512,000) 1,688,000 (76.7)<br />
(11,154,165) (5,715,000) (4,754,000) (3,332,000) 2,383,000 (41.7)<br />
I13
<strong>Halifax</strong> <strong>Regional</strong> <strong>Municipality</strong><br />
Summary of Non-Departmental Revenues (continued)<br />
2008-2009 2009-2010 2009-2010 2010-2011 Change over<br />
Actual Budget Projections Budget Budget Var as %<br />
Fee Revenue<br />
Parking Meters (2,638,668) (2,625,000) (2,625,000) (2,630,000) (5,000) 0.2<br />
Rental & Leasing (1,718,353) (1,554,100) (1,554,100) (1,554,100) 0 -<br />
(4,357,021) (4,179,100) (4,179,100) (4,184,100) (5,000) -<br />
Other Revenue<br />
Proceed Sale of Ass. (154) 0 0 0 0 -<br />
HRWC Dividend (3,622,229) (3,700,000) (3,700,000) (3,700,000) 0 -<br />
Recov External Parti (584,542) (1,637,607) (1,637,607) (1,335,506) 302,101 (18.4)<br />
NSF Chq Fee (13,880) (10,000) (10,000) (10,000) 0 -<br />
Miscellaneous Revenue (41,544) (455,000) (557,500) (546,860) (91,860) 20.2<br />
(4,262,348) (5,802,607) (5,905,107) (5,592,366) 210,241 (18.4)<br />
Total (597,112,377) (578,755,839) (576,517,145) (593,480,353) (14,724,514) 2.5<br />
I14
<strong>Halifax</strong> <strong>Regional</strong> <strong>Municipality</strong><br />
2010/11 Business Plans and Budget (Proposed) <strong>Halifax</strong> Public Libraries<br />
<strong>Halifax</strong> Public<br />
Libraries<br />
Business Plan - 2010/11
<strong>Halifax</strong> <strong>Regional</strong> <strong>Municipality</strong><br />
2010/11 Business Plans and Budget (Proposed) <strong>Halifax</strong> Public Libraries<br />
Vision:<br />
<strong>Halifax</strong> Public Libraries: Where we shape the future together… Imagine the<br />
possibilities<br />
Mission: Connecting people, Enriching communities, Inspiring discovery<br />
The Library’s mission supports <strong>Halifax</strong> <strong>Regional</strong> <strong>Municipality</strong>’s Community<br />
Outcome Areas of Diverse Recreation, Leisure and Cultural Choices, Well<br />
Planned and Engaged Communities and Safe and Welcoming Communities,<br />
Council Focus Areas of Community Planning and Infrastructure, and is also<br />
aligned with the EMT Priorities of Excellence in Service Delivery and Employer<br />
of Choice.<br />
Business Unit Overview:<br />
The <strong>Halifax</strong> Public Libraries provides public library service to the residents of HRM under the<br />
direction of the <strong>Halifax</strong> <strong>Regional</strong> Library Board in alignment with the strategic vision and<br />
mission through its network of branches, mobile library, website, books by mail and home<br />
delivery services. These services are organized and provided under the direction of the following:<br />
Director:<br />
Judith Hare, CEO<br />
BA (Hons), MLS<br />
Public Services<br />
Susan McLean<br />
BA (Hons), MLS<br />
Branch Services<br />
Vacant<br />
Corporate Research<br />
& Development<br />
Paula Saulnier<br />
BA, BEd, MLIS<br />
Finance & Facilities<br />
Shawn West<br />
MBA, CMA<br />
Responsible for providing vision, leadership and direction to the<br />
Library system and is the Secretary to the <strong>Halifax</strong> <strong>Regional</strong> Library<br />
Board. Oversees Senior Management and the Communications and<br />
Marketing Department.<br />
Responsible for the development of region-wide service including:<br />
information, youth, diversity, literacy, English Language Learning<br />
(ELL), older adults and reader’s services, as well as community<br />
development initiatives. Also responsible for the three resource<br />
libraries: Alderney Gate, Keshen Goodman and Spring Garden Road<br />
Public Libraries.<br />
Responsible for the delivery of library service from all outlets<br />
including branches, mobile library, <strong>Book</strong>s by Mail and Home<br />
Delivery service.<br />
Responsible for statistical and demographic trend analysis for <strong>Halifax</strong><br />
Public Libraries, for process design and implementation, project<br />
management and related organizational development facilitation.<br />
Responsible for financial planning and management of annual<br />
budgets, revenues and expenditures and procurement. Responsible<br />
for facilities, vehicles and asset management.<br />
J2
<strong>Halifax</strong> <strong>Regional</strong> <strong>Municipality</strong><br />
2010/11 Business Plans and Budget (Proposed) <strong>Halifax</strong> Public Libraries<br />
Information<br />
Technology and<br />
Collection<br />
Management<br />
Bruce Gorman<br />
BSc, MSc, ISP<br />
Human Resources<br />
Cathy Maddigan<br />
B. Comm, CHRP<br />
Summary of Business<br />
Unit Structure<br />
Changes:<br />
Includes Collection Development, Collection Access, Information<br />
Technology and the Library’s website. Responsible for ordering and<br />
receiving all materials for the Library’s collection and making them<br />
accessible through the Library’s catalogue and available to the public<br />
at library outlets. Responsible for the implementation and support of<br />
computer hardware and software and new technology throughout the<br />
Library system.<br />
Responsible for recruitment, employee and labour relations,<br />
collective bargaining, payroll, health and safety, training and<br />
development, employee assistance program, pension and group<br />
benefits etc. for all divisions and departments.<br />
N/A<br />
Core Operations and Services provided:<br />
• The <strong>Halifax</strong> Public Libraries system is comprised of 14 branch libraries, a mobile library that<br />
brings library service to communities outside the service area of a branch, home delivery and<br />
books by mail services for those unable to visit the Library due to disability, long-term illness<br />
or distance to nearest branch and a website (halifaxpubliclibraries.ca)<br />
• In 2009-10 there were over 2,251,504 in-person visits and 1,283,877 website visits. While<br />
this is a small decrease to in-person visits due in part to the closure of the Captain William<br />
Spry Library for a month while undergoing renovations, the website visits experienced a<br />
6.8% increase over the previous year. (2008/09: 2,372,967 in-person, 1,202,072 website;<br />
2007/08: 2,369,249 in-person, 1,179,040 website).<br />
• 170,000 active registered borrowers, which represents 45.7% of the population of HRM.<br />
• 1,081,770 items in the collection, including books, CDs, DVDs, videos, newspapers,<br />
magazines and downloadable books, movies and music, with a circulation of over 4,746,499<br />
items in 2009-10. This level of circulation is slightly less than the previous year due to<br />
closures and equates to 13 items borrowed per capita. (2008/09: 4,826,701; 2007/08:<br />
4,641,711). <strong>Halifax</strong> Public Libraries ranks above the national average of 10.21 items<br />
borrowed per capita (2008-09 Canadian Urban Libraries Council statistics).<br />
• Online catalogue to search the Library’s extensive collection, place items on hold and check<br />
accounts from anywhere with Internet access.<br />
• Programming that enhances opportunities for life long learning and community discussion,<br />
delivered largely in partnership with some 300 community groups.<br />
• This year 4,614 programs were offered for children, teenagers and adults with 108,464<br />
people attending. These programs ranged from baby & tot story times to reading support, to<br />
J3
<strong>Halifax</strong> <strong>Regional</strong> <strong>Municipality</strong><br />
2010/11 Business Plans and Budget (Proposed) <strong>Halifax</strong> Public Libraries<br />
family and senior drop-ins, school visits, teen programs, computer training, information and<br />
cultural programs, book clubs and heritage events.<br />
• Literacy and English Language Learning tutoring and programs.<br />
• Nearly 300 public access computers; and 5 learning labs.<br />
• Computer reservation system to book a computer on-line or via an automated phone system.<br />
• Wireless Internet access at all branches.<br />
• Meeting rooms available for public use at most branches.<br />
Funded Full Time Equivalents (FTEs):<br />
Funded FTEs (includes Full-<br />
Time and Part-Time Employees)<br />
2008/09<br />
(Approved)<br />
2009/10<br />
(Approved)<br />
2010/11<br />
(Proposed)<br />
277.9 278.9 * 285.39 **<br />
* Includes additional part-time hours at several branches across the region and 1 FTE for<br />
partial year at Woodlawn Public Library.<br />
** Additional staff approved for expanded Woodlawn Public Library.<br />
J4
<strong>Halifax</strong> <strong>Regional</strong> <strong>Municipality</strong><br />
2010/11 Business Plans and Budget (Proposed) <strong>Halifax</strong> Public Libraries<br />
Analysis of <strong>Operating</strong> Budget Changes:<br />
<strong>Operating</strong> Budget Change Details<br />
($000s)<br />
2009/10 Budget $19,673.9<br />
1 Salary & Benefit change includes increases for a provision for normal step<br />
increases and salaries as per the collective agreement and expanded Woodlawn<br />
staffing<br />
2 Mandated across departments SER reductions for courier/postage, office<br />
furniture, equipment and supplies, vehicle fuel, local travel<br />
648.8<br />
(35.0)<br />
3 Building maintenance and janitorial cleaning increase 17.8<br />
4 Heating fuel decrease based in part on change in service delivery at new<br />
Woodlawn location and adjusted for inflation (-$18.9k); plus difference of<br />
increase in electricity ($5k)<br />
5 Computer equipment decrease reflects ending hardware lease ($75k) one time<br />
only) and deferred replacement of PCs<br />
(13.9)<br />
(134.30)<br />
6 Library materials decrease to achieve budget envelope reduction (83.5)<br />
7 Facilities rental increase to reflect leases contracts 18.00<br />
8 Transfer to Central Library Reserve 760.8<br />
2010/11 Gross <strong>Operating</strong> Budget $20,852.6<br />
2009/10 Revenue <strong>Operating</strong> Budget (5,310.8)<br />
2010/11 Total Revenue <strong>Operating</strong> Budget (5,310.8)<br />
2010/11 Total NET <strong>Operating</strong> Budget $15,541.8<br />
J5
<strong>Halifax</strong> <strong>Regional</strong> <strong>Municipality</strong><br />
2010/11 Business Plans and Budget (Proposed) <strong>Halifax</strong> Public Libraries<br />
Key Challenges and Opportunities<br />
The following challenges and opportunities will have an impact on the Business Unit between<br />
the 2010-2015 time frame.<br />
Challenges with Community-wide Impact:<br />
These are challenges or opportunities which affect the entire HRM Region, and which the<br />
Business Unit plays a role in influencing or addressing the outcome. Multiple business units may<br />
be involved in addressing the issue.<br />
Opportunity:<br />
• Central Library Project: Funding commitments from both the Federal and Provincial<br />
levels of Governments provide $31 million toward the Central Library project for completion<br />
in 2013. The ‘<strong>Halifax</strong> Central Library - Building Program and Space Requirements’ report,<br />
prepared by the HOK Planning Group in 2008, builds on the urban design recommendations<br />
and guidelines included in the Spring Garden Road / Queen Street Area Joint Public Lands<br />
Plan. A Partnership of Culture and Learning is the focus for a new Central Library for<br />
<strong>Halifax</strong>. This direction was the result of extensive public consultations which were<br />
conducted in developing the ‘<strong>Halifax</strong> Central Library - Building Program and Space<br />
Requirements’. The public consultations made it clear that the community is seeking a library<br />
to support, cultivate and sustain culture and learning in the community as a key community<br />
resource and partner. A Central Library within the <strong>Halifax</strong> <strong>Regional</strong> <strong>Municipality</strong><br />
complements municipal strategic initiatives, including the extensive <strong>Halifax</strong> by Design<br />
project, the cultural plan, economic development and immigration strategies, youth<br />
engagement and is aligned with the Council Focus Area for Infrastructure. The Central<br />
Library speaks to quality of life initiatives and has the power to draw families and individuals<br />
into the downtown, cause corporations to locate in HRM and encourage new university<br />
graduates to remain here. The Central Library provides an opportunity to create a focal point<br />
and a demonstration of civic pride for both the municipality and the province.<br />
• Civic Engagement: The Central Library project provides opportunity for meaningful civic<br />
engagement. The public dialogue begun during the Public Lands Plan consultations and<br />
continued through the development of the Central Library Building Program will continue to<br />
inform the design process generating public interest and excitement. The Library also<br />
continues to engage the community through new partnership initiatives at branches<br />
throughout the municipality.<br />
• Public Image: The <strong>Halifax</strong> Public Libraries is a highly respected and valued service<br />
provider. The Library’s public image and reputation for community-based development and<br />
programming has been carefully fostered. Public response and use of the service indicates<br />
that the right things are being done. The Central Library project provides the opportunity to<br />
J6
<strong>Halifax</strong> <strong>Regional</strong> <strong>Municipality</strong><br />
2010/11 Business Plans and Budget (Proposed) <strong>Halifax</strong> Public Libraries<br />
further enhance the image of the Library and HRM on the national and international stage as<br />
a leader in innovation, culture, learning and sustainable development. The renovated and<br />
new facilities of Captain William Spry Library and the Woodlawn Library completed in<br />
2009-10 will make the <strong>Halifax</strong> Public Libraries a showcase for modern technology; from<br />
large screen tv’s, to an information portal, to portable computer labs, to gaming and media<br />
centers, the community will be exposed to the latest in technology. The Woodlawn Library<br />
also features a 100 seat auditorium for programming and community events<br />
• Support to Corporate Initiatives (Immigration Strategy, Economic Strategy, Cultural<br />
Plan, and Community Development): The Library has the expertise and organizational<br />
will to assist HRM in advancing corporate policy. The Library, with a network of<br />
community branches, can play a key role in service delivery. Libraries are experienced in<br />
providing a welcoming environment for people of diverse backgrounds, assisting in the<br />
integration of new residents into Canadian society, and fostering cultural understanding.<br />
Cultural programs, performance venues and life-long learning opportunities support the<br />
cultural plan. Online access to community resources and cultural events, through archived<br />
web- and podcasts, expand the availability of these events to those who cannot attend them<br />
in person. Libraries further economic development, serving as anchors generating foot traffic<br />
to support surrounding commercial development and supporting the image of the community<br />
as vibrant and engaged. Staff provides training, and the library provides online access to<br />
small business resources off-site, expanding the availability of resources to partners to make<br />
full use of Corporate Initiative resources beyond library hours and outside the walls of the<br />
library buildings. <strong>Halifax</strong> Public Libraries work collaboratively with communities to support<br />
and develop community strengths and initiatives.<br />
• Community Development: The Library is exploring a range of opportunities to engage the<br />
public in service development and delivery. Asset mapping is assisting in understanding the<br />
needs of immigrant and First Nations communities. Information gathered from this process<br />
will be used to define the best role for the library in meeting the needs of communities. The<br />
Library is also increasingly viewed as a place for meeting and connecting with others.<br />
Programs and facilities are being designed to maximize these opportunities and build strong<br />
communities. The Library works with over 300 partners and supports partnered grants in a<br />
range of community development initiatives.<br />
• Technology: In a global information society libraries bridge the digital divide and foster<br />
modern learning. Library C@P sites, public access computers, assistive technology, mobile<br />
technology, information technology learning centres, gaming and media centres, wireless<br />
access and staff assistance help individuals connect and learn the skills needed to use<br />
technology in daily life. Online learning and distance education are the new learning<br />
paradigms, through the use of tools such as interactive whiteboards, podcasting, and video<br />
conferencing we are poised to be a facilitator of this new education delivery system. Open<br />
Source software continues to gain acceptance and support. Libraries have often been tethered<br />
to expensive commercial software solutions particularly the Integrated Library System.<br />
J7
<strong>Halifax</strong> <strong>Regional</strong> <strong>Municipality</strong><br />
2010/11 Business Plans and Budget (Proposed) <strong>Halifax</strong> Public Libraries<br />
(ILS). Open Source solutions are now deployed and functioning in libraries all over the<br />
world. The library is and will continue to benefit from open source solutions that allow both<br />
control of destiny and costs.<br />
Inventory management systems are maturing into complete end to end solutions. From Radio<br />
Frequency Identification (RFID) tags on library material, to self check out and check in,<br />
automated material handling, enhanced security, reduced costs, and a better user experience,<br />
inventory management will revolutionise the library.<br />
Green is here. The library as a community leader should take a lead role and develop a green<br />
strategy including energy consumption, green computing, waste diversion and recycling. The<br />
new Central Library will be a LEED Gold building, adding to its sustainability in the<br />
community.<br />
• New Partnerships: As a trusted and valuable community partner, the Library continues to<br />
seek out partners throughout HRM to provide innovative programming that builds interest<br />
and commitment to the rich culture and learning opportunities of our increasingly diverse<br />
community<br />
• Collections: With the continuing acceptance and expansion of digital media, we have the<br />
opportunity to provide efficient, relevant collections in formats including downloadable<br />
audiobooks, ebooks, movies and music. With the addition of the popular Ipod format, this<br />
service has seen unprecedented popularity. The Library’s research databases are available<br />
24/7 via the Library website giving the community access to collections even when libraries<br />
are closed.<br />
Advances in technology are providing the library with the opportunity to deploy search and<br />
discovery solutions similar to Google and the Google experience, further unleashing the<br />
potential of the catalogue and providing the user with a more rewarding experience. The user<br />
will be presented with one search box containing results from our catalogue, databases, and<br />
community information providing rich meaningful results.<br />
The online social world continues to grow at a breakneck pace. Tools like Facebook and<br />
Twitter are as commonplace as podcasts and smart phones. The library continues to use these<br />
tools throughout its service delivery models and programs. An example of the library<br />
expertise and involvement was in hosting the second annual Podcamp <strong>Halifax</strong> which built on<br />
the success of the inaugural year with record attendance, international participants and a<br />
growing reputation With more to come and other initiatives to engage this new generation,<br />
the library will be at the forefront.<br />
J8
<strong>Halifax</strong> <strong>Regional</strong> <strong>Municipality</strong><br />
2010/11 Business Plans and Budget (Proposed) <strong>Halifax</strong> Public Libraries<br />
Challenges:<br />
• Infrastructure Gap / Deteriorating Infrastructure: The Library Master Facilities Plan<br />
provides the blueprint for short and long term development. The Plan now needs to be<br />
updated to review and address the needs of growing communities. Development of this plan<br />
ensures that the Library is aligning its capital projects to meet the priority needs of HRM<br />
residents.<br />
Library service is delivered through 14 facilities, mainly leased, that vary in quality and<br />
condition. Through the Facilities Review and Inventory, prepared in conjunction with HRM<br />
Infrastructure & Asset Management (IAM), deficiencies and repair needs were identified. A<br />
continuous improvement and refurbishment program continues to be needed to address aging<br />
infrastructure and provide the public with attractive, healthy spaces. The gap in funding for<br />
re-capitalization of existing buildings has been calculated at $350,000 per year.<br />
• Service Demand: The Library cannot respond to ongoing petitions for more hours of<br />
service at existing locations and requests for system expansion and new services. During the<br />
last 5 years, circulation has increased by 12.3%, in-person visits by 3%, computer use by<br />
83%, requests to hold materials for specific borrowers by 75%, program attendance by 7%<br />
and transaction volume by 31%. The resource base of staff, collections and technology has<br />
generally not kept pace. This stress on the system results in longer turnaround times for<br />
public access, generates backlogs and pressure on materials’ handling systems.<br />
• Rural Service: The Library continues to experience consistent demand for increased open<br />
hours in its rural branches, as well as requests for additional branch locations. It is an<br />
ongoing challenge to provide full service in all areas of HRM.<br />
• Demographics: Population growth and change have a direct impact on the Library. The<br />
oldest baby boomers turned 50 in 1996-97. A boomer turns 50 every 7.5 seconds and<br />
became the majority of the 50-74 Canadian age group in 2005. The largest percentage<br />
growth in HRM population noted in the 2006 Census is the 50-64 age group (+19.46%).<br />
Baby boomers are ‘book’ people and fuel the demand for traditional service. Boomers<br />
continue to dominate government and private sector organizations and their needs and<br />
interests in good measure determine service. In HRM, the largest decrease in growth in the<br />
adult population continues to be shown in the 20-34 age bracket, experiencing a 26.35%<br />
decrease since 1991; nevertheless, this group is the second largest percentage of the<br />
population at 22.45%. Children and young adults, 0-19, make up 22.73% of HRM’s<br />
population; this segment of the population has continued to decrease in percentage size since<br />
the 1991 census. Addressing the needs of this target group is essential in keeping and<br />
attracting a younger demographic to the area while balancing the needs of an older, aging<br />
population.<br />
J9
<strong>Halifax</strong> <strong>Regional</strong> <strong>Municipality</strong><br />
2010/11 Business Plans and Budget (Proposed) <strong>Halifax</strong> Public Libraries<br />
HRM is also supporting an increasingly diverse community. Diversity is reflected in many<br />
ways including: culture, income, geography, age, and education. The Library is aware that its<br />
service response needs to reflect this diversity and is incorporating community development<br />
approaches in addressing need for service change and in working effectively with its partners.<br />
• A demand for community connections: Residents are increasingly looking to the Library<br />
to provide locations and opportunities to connect with others. They want to connect in our<br />
branches, in programs and online through social networking. The Library has to consistently<br />
review its service delivery to ensure that these opportunities are maximized in all new and<br />
redesigned service options. This requires staff time to work with the community and design<br />
services, training budgets to allow staff to build capacity, as well as, funding for capital<br />
renovations. Innovation also impacts buildings as public demand increases for quality public<br />
spaces to access technology, meet with community members, or take part in life long<br />
learning opportunities. New branches and renovated branches have experienced increased<br />
use and positive response from their communities.<br />
• Innovation: Continuous improvement and innovation is increasingly challenging without<br />
the “seed money” required. New technologies are available that would considerably<br />
improve the library’s ability to manage transaction growth, such as RFID (Radio Frequency<br />
IDentification) and smart book returns, but the implementation costs are prohibitive. We<br />
have the ideas to move ahead but no money to effect change.<br />
The Library continues to face pressure to provide innovative, timely services to an<br />
increasingly tech savvy community. Ever-expanding technologies such as wireless, the<br />
digital explosion, Google, e-learning, e-books, downloadable audio books and movies,<br />
gaming and self service options are raising the bar as patrons expect fast, sophisticated<br />
solutions.<br />
• Collections: <strong>Halifax</strong> Public Libraries compares negatively to other Canadian Libraries of<br />
similar size in terms of per capita expenditure on library materials - the current survey by the<br />
Canadian Urban Libraries Council reveals that, at $4.60 per capita, <strong>Halifax</strong> continues to fall<br />
below the national average of $5.21 per capita.<br />
Serious deficiencies in the collection will result in a range of service impacts including fewer<br />
materials and an aging collection available to the public, limited ability to provide a diverse<br />
collection, increased waiting lists and wait times, and the inability to meet requests for<br />
purchase.<br />
J10
<strong>Halifax</strong> <strong>Regional</strong> <strong>Municipality</strong><br />
2010/11 Business Plans and Budget (Proposed) <strong>Halifax</strong> Public Libraries<br />
Challenges with Service Delivery / Business Unit Impact<br />
These are issues which affect the business unit’s ability to deliver services (both internally and<br />
externally).<br />
Challenges:<br />
• Budget Planning Framework: The Library cannot meaningfully develop strategic plans in<br />
an atmosphere of funding uncertainty. The Province has not implemented the recommended<br />
provincial funding formula which would increase dollars based on per capita funding. In this<br />
financial environment, it is challenging to advance service.<br />
• Succession Planning / Training and Development: Current funding for staff training, and<br />
development and succession planning is inadequate to ensure skill development and<br />
preparation of employees to take on more senior responsibilities or key roles within the<br />
Library. In 2009/10 a leadership program for librarians and managers has been self-funded<br />
but funds cannot be further reallocated internally without reducing public service.<br />
While succession planning is a corporate priority, the Library is making little progress in this<br />
important area. Many organizations have identified succession planning as a key tactic to<br />
address the impending labour shortages. The Library requires more than just having enough<br />
bodies to fill future vacancies. The challenge is to find a way to transfer the knowledge and<br />
talent to the succeeding generation of workers. In order for a comprehensive Talent<br />
Management Program to be implemented, regular training and professional development<br />
opportunities must be available, encouraged and funded. Innovation is an ongoing part of<br />
service delivery; if the Library is to continue to be innovative implementing programs and<br />
services effectively through its staff, an investment in training and effective change<br />
management for staff, at all levels, is crucial. This investment in training also serves as an<br />
investment in staff recruitment and retention as staff and potential recruits are placing<br />
increasing value on a workplace that fosters learning, growth and professional development.<br />
• Grants and Partnerships: The Library has missed significant grant funding opportunities,<br />
employment and internship opportunities and other programs where matching funding is<br />
required.<br />
J11
<strong>Halifax</strong> <strong>Regional</strong> <strong>Municipality</strong><br />
2010/11 Business Plans and Budget (Proposed) <strong>Halifax</strong> Public Libraries<br />
The goals for <strong>Halifax</strong> Public Libraries are:<br />
Business Unit Goals<br />
Goal 1: The Central Library reflects and engages the <strong>Municipality</strong>’s imagination and<br />
aspirations.<br />
Goal 2: Service is delivered in high quality, well designed and attractive facilities strategically<br />
located throughout the <strong>Municipality</strong> in alignment with the Library Facilities Master<br />
Plan and the HRM <strong>Regional</strong> Plan.<br />
Goal 3: A community-centered library system that fosters social understanding and cooperation<br />
among the diverse communities of the <strong>Municipality</strong>.<br />
Goal 4: To lead creative initiatives that connect, enrich and inspire discovery.<br />
Goal 5: Staff exemplify the Library’s vision, mission and values.<br />
Goal 6 Demonstrate accountability and stewardship to ensure sustainability while building our<br />
capacity.<br />
Goal 7 Develop and sustain aligned relationships and meaningful partnerships based on open<br />
communication and motivated participants.<br />
Goal 1:<br />
The Central Library reflects and engages the<br />
<strong>Municipality</strong>’s imagination and aspirations.<br />
Corporate Strategy Linkage:<br />
Council Focus Areas: Infrastructure<br />
EMT Priorities: Excellence in Service Delivery<br />
Community Outcomes: Diverse Recreation, Leisure and Cultural Choices<br />
Well-Planned and Engaged Communities<br />
Description:<br />
A landmark Central Library in <strong>Halifax</strong>’s downtown core will serve as a state-of-the-art<br />
information gateway, an icon of civic pride and aspirations, and a catalyst for economic and<br />
cultural vitality. It will provide services to peninsula residents, function as the hub of library<br />
operations in support of the entire branch network and create an engaging visitor destination for<br />
downtown. With the financial strategy approved and the architects selected the project will now<br />
move into the design phase, part of which will include a public consultation component. The<br />
Library will also implement the framework previously developed for the initiation of a capital<br />
campaign.<br />
J12
<strong>Halifax</strong> <strong>Regional</strong> <strong>Municipality</strong><br />
2010/11 Business Plans and Budget (Proposed) <strong>Halifax</strong> Public Libraries<br />
Goal 1:<br />
Objectives for 2010/2011:<br />
LIB1.1<br />
LIB 1.2<br />
LIB 1.3<br />
LIB 1.4<br />
The Central Library reflects and engages the<br />
<strong>Municipality</strong>’s imagination and aspirations.<br />
Demonstrate the value of the Central Library to the residents of HRM.<br />
Design Central Library with approved architects in cooperation with HRM<br />
according to plan and schedules.<br />
Ensure effective community engagement in the design phase of the Central<br />
Library project.<br />
Launch fund-raising campaign for Central Library.<br />
Goal 2:<br />
Service is delivered in high quality, well designed and<br />
attractive facilities strategically located throughout the<br />
<strong>Municipality</strong> in alignment with the Library Facilities<br />
Master Plan.<br />
Corporate Strategy Linkage:<br />
Council Focus Area: Infrastructure<br />
EMT Priorities: Excellence in Service Delivery,<br />
Practicing Fiscal Responsibility<br />
Community Outcomes: Well-Planned and Engaged Communities<br />
Description:<br />
Inherent to providing good library service is the need for welcoming, attractive, safe and efficient<br />
facilities. In 2004 the Library’s Needs Assessment & Master Facilities Plan was accepted by<br />
HRM Council. Work continues in addressing the priorities it identified. The top 2 priorities of<br />
building a new Central Library and enlarging the Woodlawn Library have been moving forward<br />
in the past year. The new and expanded Woodlawn Library will open in April 2010.<br />
Ongoing refurbishing of branches is required to protect the asset and ensure facilities remain in<br />
good repair. Proceeding with these projects is crucial to building capacity and strengthening the<br />
Library’s system of branches to meet the library service needs of HRM residents; the Sackville<br />
Public Library is the next priority. A review of the Master Facilities Plan at this time is<br />
appropriate to ensure optimizing existing resources and effectively planning for new resources.<br />
Effective management of ongoing maintenance issues and plans to address future maintenance<br />
and renovation needs ensure efficient use of facilities and reflects asset management.<br />
J13
<strong>Halifax</strong> <strong>Regional</strong> <strong>Municipality</strong><br />
2010/11 Business Plans and Budget (Proposed) <strong>Halifax</strong> Public Libraries<br />
Goal 2:<br />
Objectives for 2010/2011:<br />
LIB 2.1<br />
LIB 2.2<br />
Service is delivered in high quality, well designed and<br />
attractive facilities strategically located throughout the<br />
<strong>Municipality</strong> in alignment with the Library Facilities<br />
Master Plan.<br />
Develop criteria and mechanisms for managing requests for system expansion.<br />
Manage ongoing facilities maintenance projects and develop priorities.<br />
Objectives for the next 3-5 years:<br />
LIB 2.3<br />
Identify best practices from the Central Library and new Woodlawn Library<br />
processes related to space and facility usage that can be implemented at branches<br />
across the region.<br />
Goal 3:<br />
A community-centered library system that fosters social<br />
understanding and cooperation among the diverse<br />
communities of the <strong>Municipality</strong>.<br />
Corporate Strategy Linkage:<br />
Council Focus Areas: Community Planning<br />
EMT Priorities: Excellence in Service Delivery<br />
Community Outcomes: Safe and Welcoming Community<br />
Well-Planned and Engaged Communities<br />
Description:<br />
It is important that the Library work closely with the community in order to ensure that services<br />
are aligned with community need and that we are effectively allocating resources. Involving and<br />
working closely with citizens and partners results in outcomes that strengthen communities.<br />
In the upcoming year the Library’s focus will be on diverse communities using various<br />
communication mechanisms to engage the community. The diversity of the communities<br />
throughout HRM is a unique strength honoured by the Library as it strives to provide relevant<br />
collections and services and present displays and programs for all ages reflective of this diverse<br />
heritage. Partnering with related community organizations to coordinate a variety of special<br />
events is integral to this aspect of the library’s service delivery.<br />
J14
<strong>Halifax</strong> <strong>Regional</strong> <strong>Municipality</strong><br />
2010/11 Business Plans and Budget (Proposed) <strong>Halifax</strong> Public Libraries<br />
Goal 3:<br />
Objectives for 2010/2011:<br />
LIB 3.1<br />
LIB 3.2<br />
A community-centered library system that fosters social<br />
understanding and cooperation among the diverse<br />
communities of the <strong>Municipality</strong>.<br />
Create accessible environments and opportunities for diverse communities and<br />
organizations to connect, create and exchange ideas.<br />
Strengthen our community networks, leverage staff community connections,<br />
pursue new partnerships, and create an inclusive community process.<br />
Goal 4:<br />
To lead creative initiatives that connect, enrich and inspire<br />
discovery.<br />
Corporate Strategy Linkage:<br />
Council Focus Areas: Infrastructure<br />
EMT Priorities: Excellence in Service Delivery<br />
Community Outcomes: Diverse Recreation, Leisure and Cultural Choices<br />
Description:<br />
The creative use of Library resources and service delivery options is essential in responding to<br />
individual and community needs and enhancing the library experience. By proactively managing<br />
assets, including our collections, people, programming and technology, the Library works to<br />
maximize its contribution to the community through innovative solutions.<br />
Technology is enabling a new generation of online social interaction. As a virtual gathering<br />
place, the Library is at the forefront of this movement and will provide pathways for this new<br />
interaction. New technology solutions, such as RFID, contribute to effective service delivery and<br />
help manage collections transaction growth. The Library is working with other HRM<br />
departments represented in the ITC committee who are also interested in RFID asset tagging to<br />
reduce service implementation and delivery costs. At the same time, the Library continues to<br />
explore new and alternative ways to offer library services and programs to the residents of HRM.<br />
Goal 4:<br />
Objectives for 2010/2011:<br />
LIB 4.1<br />
LIB 4.2<br />
LIB 4.3<br />
To lead creative initiatives that connect, enrich and<br />
inspire discovery.<br />
Identify and develop services in non-traditional ways and in non-traditional<br />
places to meet communities where they are.<br />
Develop and implement automation initiatives (eg RFID) to improve customer<br />
service.<br />
Explore service delivery alternatives to replace Mobile Library service.<br />
J15
<strong>Halifax</strong> <strong>Regional</strong> <strong>Municipality</strong><br />
2010/11 Business Plans and Budget (Proposed) <strong>Halifax</strong> Public Libraries<br />
Goal 5:<br />
Staff exemplify the Library’s vision, mission and values.<br />
Corporate Strategy Linkage:<br />
EMT Priorities: Employer of Choice<br />
Description:<br />
To successfully achieve our goals, staff need to embrace and model our core values that support<br />
our vision and mission. As a result, our recruitment and selection program must be designed to<br />
attract and retain staff who share these core values. Professional development opportunities and<br />
succession planning will support long term growth and the retention of critical knowledge within<br />
the Library through alignment with our goals. Further, a staff rewards and recognition program<br />
will be designed that celebrates the success and achievements of those individuals who exemplify<br />
our mission, vision and values.<br />
Goal 5:<br />
Staff exemplify the Library’s vision, mission and values.<br />
Objectives for 2010/2011:<br />
LIB 5.1 Develop a recruitment and selection program to hire staff who demonstrate our<br />
core values and reflect our diverse communities.<br />
LIB 5.2 Create a fully integrated talent management and succession plan.<br />
LIB 5.3 Create a staff rewards and recognition program.<br />
Goal 6:<br />
Demonstrate accountability and stewardship to ensure<br />
sustainability while building our capacity.<br />
Corporate Strategy Linkage:<br />
EMT Priorities: Fiscal Responsibility<br />
Excellence in Service Delivery<br />
Description:<br />
In addition to facilities addressed in Goal 2, effective management of library resources includes<br />
the broad spectrum of collections, IT infrastructure and vehicles. The Library strives to employ<br />
cost effective, efficient and innovative methods to preserve, plan for and strengthen resources in<br />
support of library service delivery.<br />
Goal 6:<br />
Objectives for 2010/2011:<br />
LIB 6.1<br />
Demonstrate accountability and stewardship to ensure<br />
sustainability while building our capacity.<br />
Effectively manage and safeguard library resources and plan for, maintain, and<br />
replace assets as necessary.<br />
J16
<strong>Halifax</strong> <strong>Regional</strong> <strong>Municipality</strong><br />
2010/11 Business Plans and Budget (Proposed) <strong>Halifax</strong> Public Libraries<br />
Goal 7:<br />
Develop and sustain aligned relationships and meaningful<br />
partnerships based on open communication and motivated<br />
participants.<br />
Corporate Strategy Linkage:<br />
EMT Priorities: Excellence in Service Delivery<br />
Community Outcome: Well-Planned and Engaged Community<br />
Description:<br />
The Library is committed to working collaboratively with numerous partners in service delivery.<br />
Programs co-sponsored with community partners are delivered at all branches and consultation<br />
with related organizations help shape the direction of library programs and services to meet<br />
community needs.<br />
Goal 7:<br />
Objectives for 2010/2011:<br />
LIB 7.1<br />
Develop and sustain aligned relationships and meaningful<br />
partnerships based on open communication and<br />
motivated participants.<br />
Review and implement results of pilot of shared access service with university,<br />
college and regional public libraries through the Libraries Nova Scotia<br />
consortium (BARA – Borrow Anywhere, Return Anywhere).<br />
J17
<strong>Halifax</strong> <strong>Regional</strong> <strong>Municipality</strong><br />
2010/11 Business Plans and Budget (Proposed) <strong>Halifax</strong> Public Libraries<br />
Service Level Changes<br />
Increases In Services / new initiatives:<br />
• Expanded Woodlawn Library opened to the public in April 2010.<br />
• Technology purchased in 2009/10 implemented, improving public access through a<br />
‘google-like’ discovery tool for one stroke searching of Library materials, databases, HRM<br />
community organizations and continuing education courses.<br />
• Public Consultation process as part of Central Library design development.<br />
• Fundraising campaign for Central Library.<br />
• Digitized collection pilot implemented in partnership with a community heritage<br />
organization..<br />
• Evaluate success of a shared access pilot project with all Nova Scotian public and<br />
academic libraries (BARA - Borrow Anywhere Return Anywhere)<br />
• Web payment solution for fines providing convenient customer service option<br />
• Consultation with service partners focusing on First Nations community<br />
Decreases In Services / Operational Pressures:<br />
• Reduction in library materials budget puts added pressure on existing collection, will<br />
increase wait times and move the Library further below the national per capita average of<br />
dollars spent for library materials.<br />
• Vacancy management reduction may impact public service response time and behind the<br />
scenes operations.<br />
• Deferred replacement of PCs will put operations at risk if equipment fails.<br />
Expected Services Not Being Delivered:<br />
• Expansion of library service hours of operation cannot be funded..<br />
• Unable to carry out update of Master Facility Plan<br />
• Additional requests for new facilities cannot be addressed.<br />
• Unable to carry out much needed renovations to the Sackville Public Library and Alderney<br />
gate Public Library.<br />
J18
<strong>Halifax</strong> <strong>Regional</strong> Library<br />
Summary of Gross Expenditures by Division<br />
2008-2009 2009-2010 2009-2010 2010-2011 Change over<br />
Actual Budget Projections Budget Budget Var as %<br />
Administration - Library<br />
B011 Administrative Services 1,650,228 1,831,500 1,831,500 2,683,989 852,489 46.5<br />
B012 Tech. Serv. & System 3,033,032 2,880,800 2,880,800 2,810,181 (70,619) (2.5)<br />
B013 Communications & Marketing 373,252 380,200 380,200 391,110 10,910 2.9<br />
B014 Information Services 711,664 767,600 767,600 783,320 15,720 2.0<br />
5,768,176 5,860,100 5,860,100 6,668,600 808,500 13.8<br />
Alderney Gate Library<br />
B021 Alderney Gate Adult 1,156,956 1,190,000 1,190,000 1,697,765 507,765 42.7<br />
B022 Alderney Gate Youth 475,132 479,100 479,100 (479,100) (100.0)<br />
1,632,088 1,669,100 1,669,100 1,697,765 28,665 1.7<br />
Spring Garden Rd. Mem. Library<br />
B031 Spr.Garden General 365,589 432,800 432,800 433,520 720 0.2<br />
B032 Spring Garden Road - Adult 989,721 1,030,900 1,030,900 1,508,251 477,351 46.3<br />
B033 Spring Garden Road - Youth 431,190 443,900 443,900 (443,900) (100.0)<br />
1,786,501 1,907,600 1,907,600 1,941,771 34,171 1.8<br />
Branch Libraries<br />
B041 Branch Library Services 794,289 847,200 847,200 880,710 33,510 4.0<br />
B042 Cole Harbour Library 889,385 909,900 909,900 930,203 20,303 2.2<br />
B043 Dartmouth North Library 403,204 436,400 436,400 443,566 7,166 1.6<br />
B044 Sackville Library 1,062,008 1,128,100 1,128,100 1,151,445 23,345 2.1<br />
B045 Woodlawn Library 668,741 752,100 752,100 852,984 100,884 13.4<br />
B046 Bedford Library 722,354 772,200 772,200 785,152 12,952 1.7<br />
B047 Cpt Wil.Spry Library 873,206 896,700 896,700 911,345 14,645 1.6<br />
B048 <strong>Halifax</strong> North Library 638,738 642,900 642,900 660,008 17,108 2.7<br />
B049 Keshen Goodman Library 1,819,467 1,897,900 1,897,900 1,945,459 47,559 2.5<br />
B050 Outreach Services 273,141 289,700 289,700 297,883 8,183 2.8<br />
B051 Musq. Harb. Library 259,113 277,200 277,200 280,034 2,834 1.0<br />
B052 Shatford Memorial Library 175,959 178,500 178,500 180,219 1,719 1.0<br />
B053 Sheet Harbour Library 205,305 217,100 217,100 220,559 3,459 1.6<br />
B054 Tantallon Library 933,699 991,200 991,200 1,004,848 13,648 1.4<br />
9,718,609 10,237,100 10,237,100 10,544,415 307,315 3.0<br />
Restricted Funds<br />
B061 Special Projects 104,272 0 0 0 0 -<br />
B062 Colpitts Donation 9,598 0 0 0 0 -<br />
B064 ESL 69,966 0 0 0 0 -<br />
B065 Literacy 45,779 0 0 0 0 -<br />
B066 HIRA 33,816 0 0 0 0 -<br />
B067 Justice Grant 102,287 0 0 0 0 -<br />
365,717 0 0 0 0 -<br />
Total $19,271,091 $19,673,900 $19,673,900 $20,852,551 $1,178,651 6.0<br />
J19
<strong>Halifax</strong> <strong>Regional</strong> Library<br />
Summary of Gross Revenue by Division<br />
2008-2009 2009-2010 2009-2010 2010-2011 Change over<br />
Actual Budget Projections Budget Budget Var as %<br />
Administration - Library<br />
B011 Administrative Services (3,863,718) (3,865,300) (3,865,300) (4,803,700) (938,400) 24.3<br />
(3,863,718) (3,865,300) (3,865,300) (4,803,700) (938,400) 24.3<br />
Alderney Gate Library<br />
B021 Alderney Gate Adult (73,340) (77,000) (77,000) (58,803) 18,197 (23.6)<br />
(73,340) (77,000) (77,000) (58,803) 18,197 (23.6)<br />
Spring Garden Rd. Mem. Library<br />
B032 Spring Garden Road - Adult (119,595) (125,200) (125,200) (95,649) 29,551 (23.6)<br />
(119,595) (125,200) (125,200) (95,649) 29,551 (23.6)<br />
Branch Libraries<br />
B042 Cole Harbour Library (51,250) (54,000) (54,000) (41,253) 12,747 (23.6)<br />
B043 Dartmouth North Library (7,909) (8,400) (8,400) (6,382) 2,018 (24.0)<br />
B044 Sackville Library (58,435) (61,000) (61,000) (46,691) 14,309 (23.5)<br />
B045 Woodlawn Library (46,474) (48,500) (48,500) (37,195) 11,305 (23.3)<br />
B046 Bedford Library (37,662) (39,700) (39,700) (30,794) 8,906 (22.4)<br />
B047 Cpt Wil.Spry Library (24,655) (26,700) (26,700) (20,361) 6,339 (23.7)<br />
B048 <strong>Halifax</strong> North Library (18,086) (19,100) (19,100) (14,635) 4,465 (23.4)<br />
B049 Keshen Goodman Library (131,193) (138,000) (138,000) (106,695) 31,305 (22.7)<br />
B051 Musq. Harb. Library (9,383) (9,700) (9,700) (7,445) 2,255 (23.2)<br />
B052 Shatford Memorial Library (7,481) (7,900) (7,900) (6,434) 1,466 (18.6)<br />
B053 Sheet Harbour Library (3,530) (3,700) (3,700) (2,811) 889 (24.0)<br />
B054 Tantallon Library (40,149) (41,700) (41,700) (31,953) 9,747 (23.4)<br />
(436,208) (458,400) (458,400) (352,649) 105,751 (23.1)<br />
Restricted Funds<br />
B061 Special Projects (100,999) 0 0 0 0 -<br />
B064 ESL (50,964) 0 0 0 0 -<br />
B065 Literacy (43,294) 0 0 0 0 -<br />
B066 HIRA (33,800) 0 0 0 0 -<br />
B067 Justice Grant (48,638) 0 0 0 0 -<br />
(277,696) 0 0 0 0 -<br />
Total (4,770,558) (4,525,900) (4,525,900) (5,310,801) (784,901) 17.3<br />
J20
<strong>Halifax</strong> <strong>Regional</strong> Library<br />
Summary of Net Expenditures by Division<br />
2008-2009 2009-2010 2009-2010 2010-2011 Change over<br />
Actual Budget Projections Budget Budget Var as %<br />
Administration - Library<br />
B011 Administrative Services (2,213,490) (2,033,800) (2,033,800) (2,119,711) (85,911) 4.2<br />
B012 Tech. Serv. & System 3,033,032 2,880,800 2,880,800 2,810,181 (70,619) (2.5)<br />
B013 Communications & Marketing 373,252 380,200 380,200 391,110 10,910 2.9<br />
B014 Information Services 711,664 767,600 767,600 783,320 15,720 2.0<br />
1,904,458 1,994,800 1,994,800 1,864,900 (129,900) (6.5)<br />
Alderney Gate Library<br />
B021 Alderney Gate Adult 1,083,616 1,113,000 1,113,000 1,638,962 525,962 47.3<br />
B022 Alderney Gate Youth 475,132 479,100 479,100 (479,100) (100.0)<br />
1,558,748 1,592,100 1,592,100 1,638,962 46,862 2.9<br />
Spring Garden Rd. Mem. Library<br />
B031 Spr.Garden General 365,589 432,800 432,800 433,520 720 0.2<br />
B032 Spring Garden Road - Adult 870,126 905,700 905,700 1,412,602 506,902 56.0<br />
B033 Spring Garden Road - Youth 431,190 443,900 443,900 (443,900) (100.0)<br />
1,666,906 1,782,400 1,782,400 1,846,122 63,722 3.6<br />
Branch Libraries<br />
B041 Branch Library Services 794,289 847,200 847,200 880,710 33,510 4.0<br />
B042 Cole Harbour Library 838,135 855,900 855,900 888,950 33,050 3.9<br />
B043 Dartmouth North Library 395,295 428,000 428,000 437,184 9,184 2.1<br />
B044 Sackville Library 1,003,573 1,067,100 1,067,100 1,104,754 37,654 3.5<br />
B045 Woodlawn Library 622,267 703,600 703,600 815,789 112,189 15.9<br />
B046 Bedford Library 684,691 732,500 732,500 754,358 21,858 3.0<br />
B047 Cpt Wil.Spry Library 848,551 870,000 870,000 890,984 20,984 2.4<br />
B048 <strong>Halifax</strong> North Library 620,652 623,800 623,800 645,373 21,573 3.5<br />
B049 Keshen Goodman Library 1,688,274 1,759,900 1,759,900 1,838,764 78,864 4.5<br />
B050 Outreach Services 273,141 289,700 289,700 297,883 8,183 2.8<br />
B051 Musq. Harb. Library 249,730 267,500 267,500 272,589 5,089 1.9<br />
B052 Shatford Memorial Library 168,478 170,600 170,600 173,785 3,185 1.9<br />
B053 Sheet Harbour Library 201,774 213,400 213,400 217,748 4,348 2.0<br />
B054 Tantallon Library 893,550 949,500 949,500 972,895 23,395 2.5<br />
9,282,401 9,778,700 9,778,700 10,191,766 413,066 4.2<br />
Restricted Funds<br />
B061 Special Projects 3,273 0 0 0 0 -<br />
B062 Colpitts Donation 9,598 0 0 0 0 -<br />
B064 ESL 19,002 0 0 0 0 -<br />
B065 Literacy 2,485 0 0 0 0 -<br />
B066 HIRA 16 0 0 0 0 -<br />
B067 Justice Grant 53,648 0 0 0 0 -<br />
88,021 0 0 0 0 -<br />
Total $14,500,533 $15,148,000 $15,148,000 $15,541,750 $393,750 2.6<br />
J21
<strong>Halifax</strong> <strong>Regional</strong> Library<br />
Summary by Expenditure & Revenue Types<br />
2008-2009 2009-2010 2009-2010 2010-2011 Change over<br />
Actual Budget Projections Budget Budget Var as %<br />
Expenditures<br />
Compensation & Benefits 13,930,691 14,571,600 14,571,600 15,193,266 621,666 4.3<br />
Office 500,357 484,400 484,400 503,430 19,030 3.9<br />
Professional Fees 26,801 12,000 12,000 12,000 0 -<br />
Legal & Consulting Fees 30,066 120,000 120,000 20,000 (100,000) (83.3)<br />
External Services 275,267 152,100 152,100 168,400 16,300 10.7<br />
Uniforms & Clothing 577 2,000 2,000 2,000 0 -<br />
Supplies & Materials 103,169 110,500 110,500 111,000 500 0.5<br />
Utilities 308,542 380,400 380,400 364,500 (15,900) (4.2)<br />
Building Costs 275,264 344,900 344,900 372,800 27,900 8.1<br />
Equipment & Communications 766,447 497,700 497,700 322,700 (175,000) (35.2)<br />
Vehicle Expense 89,793 92,200 92,200 83,000 (9,200) (10.0)<br />
Travel 106,348 38,000 38,000 34,200 (3,800) (10.0)<br />
Training & Education 66,157 90,000 90,000 90,000 0 -<br />
Facilities Rental 946,860 975,000 975,000 995,000 20,000 2.1<br />
Advertising & Promotion 34,130 31,300 31,300 31,300 0 -<br />
Other Goods & Services 1,807,374 1,871,800 1,871,800 1,788,155 (83,645) (4.5)<br />
Interdepartmental 3,247 0 0 0 0 -<br />
Transfer to/from Reserves 0 (100,000) (100,000) 760,800 860,800 (860.8)<br />
Expenditures 19,271,091 19,673,900 19,673,900 20,852,551 1,178,651 6.0<br />
Total 19,271,091 19,673,900 19,673,900 20,852,551 1,178,651 6.0<br />
Revenues<br />
Transfers from other Gov'ts (3,840,401) (3,840,400) (3,840,400) (4,785,800) (945,400) 24.6<br />
Fines and Fees (606,796) (649,600) (649,600) (496,101) 153,499 (23.6)<br />
Rental & Leasing (16,431) (17,100) (17,100) (17,100) 0 -<br />
Sales Revenue (1,785) 0 0 0 0 -<br />
Other Revenue (305,145) (18,800) (18,800) (11,800) 7,000 (37.2)<br />
Revenues (4,770,558) (4,525,900) (4,525,900) (5,310,801) (784,901) 17.3<br />
Total (4,770,558) (4,525,900) (4,525,900) (5,310,801) (784,901) 17.3<br />
Net Cost $14,500,533 $15,148,000 $15,148,000 $15,541,750 $393,750 2.6<br />
J22
<strong>Halifax</strong> <strong>Regional</strong> <strong>Municipality</strong><br />
2010/11 Business Plans and Budget (Proposed) Human Resources<br />
Human Resources<br />
Business Plan - 2010/11
<strong>Halifax</strong> <strong>Regional</strong> <strong>Municipality</strong><br />
2010/11 Business Plans and Budget (Proposed) Human Resources<br />
Mission:<br />
Human Resources provides leadership, strategic direction and technical expertise<br />
in the management of human resources to support the organization in the delivery<br />
of programs and services to HRM citizens now and into the future.<br />
Business Unit Overview:<br />
Human Resources (HR) has responsibility for providing a framework to guide the application of<br />
all aspects of HRM’s human resource practices to support organizational effectiveness.<br />
In order to achieve this effectiveness, HR recognizes the value of a workplace where employee<br />
actions are directly aligned with organizational goals. Employees experience a supportive,<br />
respectful environment that offers challenging, interesting work. The efforts of our employees<br />
and their contributions to public service are appreciated, recognized and fairly rewarded.<br />
Director:<br />
Catherine Mullally<br />
Client Services<br />
Gail Isles<br />
Labour Relations<br />
Andrea Gillis<br />
Organizational<br />
Development &<br />
Health<br />
Tatjana Zatezalo<br />
Total Compensation<br />
Britt Wilson<br />
Provides leadership and strategic direction in human resource<br />
management. Ensures HR structure and resources are aligned to<br />
support organizational and human resource effectiveness.<br />
Responsible for the provision of human resources expertise to<br />
Business Units. Senior HR Consultants and HR Consultants work in<br />
a decentralized setting to ensure efficiency and consistency in the<br />
delivery of service and the integration of human resource principles<br />
and practices in day to day operations across the organization.<br />
Responsible for the labour relations strategy – collective bargaining,<br />
labour and collective agreement administration, grievance expertise,<br />
arbitration and labour dispute resolution expertise, ensuring<br />
efficiency and consistency in delivery of labour service and the<br />
integration of labour relations considerations in respect of the<br />
organized workforces across <strong>Halifax</strong> <strong>Regional</strong> <strong>Municipality</strong>.<br />
Responsible for the following functional areas: Human Resource<br />
Planning/Organizational Development, Corporate Training and<br />
Leadership Development, Corporate Diversity, Business Transition,<br />
Conflict Resolution, and Workplace Health Services<br />
Responsible for Total Compensation Strategy - Design &<br />
Administration, Benefits Plan Consulting & Administration, Human<br />
Resource Policy related to Compensation, Human Resource<br />
Information/Reporting (SAP/HR), Labour Market Research, Job<br />
Evaluation design and administration, and HR Business Process<br />
Consulting.<br />
K2
<strong>Halifax</strong> <strong>Regional</strong> <strong>Municipality</strong><br />
2010/11 Business Plans and Budget (Proposed) Human Resources<br />
Summary of<br />
Business Unit<br />
Structure Changes:<br />
N/A<br />
Core Operations and Services provided:<br />
· Labour Relations Expertise, Collective Bargaining, and Grievance Management involving six<br />
(6) unions representing approximately 82% of HRM’s workforce<br />
· Human Resource Management expertise<br />
· Staffing/Recruitment/Retention activities<br />
· HR Policy Development; Corporate Policy support<br />
· Human Rights/Workplace Rights expertise and programs<br />
· Corporate Diversity Leadership, Strategy, Training<br />
· Change Management Consulting<br />
· Corporate Training Programs/ Leadership Development<br />
· Succession Planning program, tools and support<br />
· Corporate Employee Rewards & Recognition Program<br />
· Compensation/Benefits Strategy, Plan Design, Consulting & Administration<br />
· Job Classification/Job Rating services<br />
· Pension Plan Support; Retirement Administration, Consulting, & Educational Seminars<br />
· Workplace Health Services, Short & Long Term Disability Case Management, Duty to<br />
Accommodate, Return to Work, & Workers Compensation Benefits (WCB)<br />
· Healthy Workplace programs and expertise<br />
· Employee & Family Assistance Program (EFAP)<br />
· Organizational Design consulting<br />
· Conflict Resolution support & expertise<br />
Funded Full Time Equivalents (FTEs):<br />
Funded FTEs (includes full and<br />
part time permanent positions)<br />
2008/09 2009/10 2010/11<br />
(Approved) (Approved) (Proposed)<br />
44 48 48<br />
K3
<strong>Halifax</strong> <strong>Regional</strong> <strong>Municipality</strong><br />
2010/11 Business Plans and Budget (Proposed) Human Resources<br />
Analysis of <strong>Operating</strong> Budget Changes:<br />
<strong>Operating</strong> Budget Change Details<br />
($000's)<br />
2009/10 Budget $4,772<br />
1. Increase in compensation budget 145<br />
2. Decrease in consulting budget (30)<br />
3. Decrease in corporate training budget (25)<br />
4. Cancellation of transfer from reserves 105<br />
5. Increased recruiting budget 20<br />
6. Other Decreases (12)<br />
7. New compensation recovery (external funding) (80)<br />
2010/11 Budget $4,895<br />
Key Challenges and Opportunities<br />
The following challenges and opportunities will have an impact on the Business Unit between<br />
the 2010-2015 time frame.<br />
Challenges with Organization-Wide Impact:<br />
As an internal service provider, the challenges and opportunities that impact service delivery<br />
affect most business units.<br />
· Labour Market: Canada’s birth rate is below replacement levels. Our population is aging,<br />
and the age at which people are taking retirement has fallen. People are staying in school<br />
longer (or returning) and there is an increasing level of skills required for employment.<br />
The decline in the Canadian economy temporarily impacted the labour market challenges<br />
facing HRM. As a result there may have been an increase in available unskilled or semiskilled<br />
labour but there remained a need to compete for skilled workers. Employment results<br />
for late 2009 indicate that unemployment levels are only slightly higher than the levels in<br />
2008 and remain among the lowest in Canada. In addition, the economic decline did not<br />
improve the continued retirement challenge facing HRM. The nature of the defined benefit<br />
pension programs at HRM serve to protect employees from the impact of falling equity<br />
markets. Employees will continue to retire secure in the knowledge that their benefits are not<br />
reduced by the falling stock market. Finally, the need for fiscal restraint will require HRM to<br />
do more with less and that will necessitate HRM aggressively attracting and retaining high<br />
performing talent.<br />
K4
<strong>Halifax</strong> <strong>Regional</strong> <strong>Municipality</strong><br />
2010/11 Business Plans and Budget (Proposed) Human Resources<br />
· Employee Engagement: To achieve organizational goals both now and into the future,<br />
leaders need to maximize employee engagement. The 2008 HRM Employee Engagement<br />
Survey identified a significant opportunity to increase employee engagement. Some of the<br />
reasons for the lack of engagement include:<br />
• Lack of recognition and total rewards package for employee contribution (Compensation)<br />
• Lack of opportunity for growth and advancement<br />
• Level of effectiveness of managers and supervisors<br />
• Capacity of employees to effectively perform the work required<br />
• Other factors included trust in senior leadership, senior leaders consideration for<br />
employee needs and an incongruence between values/goals of the employees and the<br />
organization.<br />
· Leadership Development: Leadership practices play a critical role with respect to<br />
organizational success and organizations need to move from the traditional “command and<br />
control model” to one of “relationship management.” This is a significant shift for our<br />
organization as past practice often contributes to how we define our present role as leaders.<br />
It is also critical for HRM to invest in the development of our future leaders as pending<br />
retirements will not only impact at the executive level, but will cross other leadership levels<br />
which would normally house our “bench strength”.<br />
· Healthy Workplace: <strong>Halifax</strong> <strong>Regional</strong> <strong>Municipality</strong> is committed to providing a healthy<br />
workplace culture for its employees. The organization recognizes that a healthy workplace<br />
positively influences an individual sense of worth, motivation and productivity, as well as<br />
provides additional means to achieve personal and professional satisfaction from work. A<br />
healthy work environment has a positive impact on the morale of employees and studies have<br />
shown that it can contribute to greater employee engagement and improved performance. In<br />
the long run, a health-oriented organizational culture develops healthy employees; healthy<br />
and engaged individuals work better, remain professionally active longer and are happier<br />
about it. Also, openly supporting work-life balance, helping employees to mitigate the<br />
negative effects of stress, expanding fitness and healthy lifestyle options and promoting<br />
recognition for individual life circumstances often provides an employer with an advantage in<br />
attracting and retaining talent.<br />
· Workforce Planning: Workforce planning continues to be a major risk for the organization.<br />
HRM needs to ensure suitable access to talent for future business success. This means<br />
attracting and developing the critical talent that if not obtained can adversely impact business<br />
success. Succession planning and talent management are elements of workforce planning<br />
that is already taking place. Given the significance of impending retirements, labour<br />
shortages and HRM’s aging workforce, workforce planning is critical in assisting business<br />
units with knowledge transfer and identifying what HR programs/practices are appropriate to<br />
close the gaps to deliver service in the future.<br />
K5
<strong>Halifax</strong> <strong>Regional</strong> <strong>Municipality</strong><br />
2010/11 Business Plans and Budget (Proposed) Human Resources<br />
Opportunities with Organization-Wide Impact:<br />
· Diversity: Valuing diversity continues to be an opportunity for increasing organization<br />
capability and effectiveness. Human Resources will continue to build a workforce that is<br />
representative of our community and reflects a variety of talents, skills and perspectives.<br />
· Attendance Support Program - In 2007/2008 absenteeism cost HRM $5.5 million. In<br />
2008/2009 the costs were in excess of $6 million. These costs only represent the<br />
compensation paid to employees who were absent due to illness and do not include additional<br />
costs for overtime wages, temporary replacements, etc. In work groups where the attendance<br />
support program has been applied consistently, absenteeism costs are much lower than in<br />
work groups where consistency has not been achieved. Absenteeism has dropped steadily<br />
over the past year and is currently at its lowest level since 2007/08. With a more focused<br />
approach, HRM will continue to realize decreased absenteeism rates and increased savings.<br />
· WCB Program - Over the past two years, Human Resources has applied a consistent effort<br />
to more effectively manage HRM’s use of Workers Compensation Benefits (WCB). This has<br />
been expressed in standardizing the WCB incident reporting protocol, analyzing the<br />
environmental circumstances to minimize recurrence and actively providing early<br />
intervention to support timely recovery and return to employment. At the same time, efforts<br />
have been made to develop closer relationships with WCB service team to ensure proper<br />
understanding of HRM diverse needs as a client.<br />
This coordinated approach has produced tangible results which are reflected in the following<br />
performance indicators. Between 2008-2009, despite a relatively steady claims volume:<br />
- HRM WCB premium decreased by $657,397 .00<br />
- Total value of paid wage-replacement benefits decreased by $254,541.00<br />
- Average duration of time-loss claims decreased from 56 to 13 weeks<br />
- Total number of benefit weeks paid fell from 878 to 569 annually<br />
- HRM WCB premium rates remained below the average industry: -$0.10 per $100 of the<br />
assessable payroll when compared with the industry rate.<br />
- HRM has been regularly and professionally represented during appeal proceedings<br />
In addition, diligent efforts to emphasize the importance of WCB liabilities on a corporate<br />
level accounts for the growing recognition of the personal and financial value of early<br />
intervention and return to work support provided to individual employee.<br />
K6
<strong>Halifax</strong> <strong>Regional</strong> <strong>Municipality</strong><br />
2010/11 Business Plans and Budget (Proposed) Human Resources<br />
Challenges with Service Delivery / Business Unit Impact<br />
· Capacity Planning: Human Resources is currently challenged with increasing service<br />
requirements from business units particularly in the area of labour relations. New collective<br />
agreements concurrently negotiated, require training and administration advice from the<br />
Labour Relations Division to support consistent and effective administration of revised<br />
provisions. Also, business units are seeking training to develop managers’ confidence and<br />
competence in managing within a unionised environment. Human Resources is also facing<br />
capacity challenges within our Organizational Development division as a result of HRM’s<br />
commitment to transform our culture and create a respectful work environment that values<br />
individual contributions and demonstrates commitment to employees.<br />
· Total Compensation: Labour market shortages particularly in the professional/technical<br />
areas have also created compensation issues at HRM. HR has undertaken a review of HRM’s<br />
Total Compensation program based on market forecasting for public sector positions;<br />
however an ongoing financial commitment by HRM is required to support implementation. If<br />
the required improvements to the program are not able to be supported, HRM will continue to<br />
risk losing talent and/or not being able to recruit quality candidates.<br />
· Implementation of Human Resource Strategy: HRM must create an “employer of choice”<br />
workplace to recruit and retain a skilled, effective, multi-generational workforce. HR is<br />
leading this initiative but requires corporate and council engagement. Without this<br />
environment, HRM risks losing current staff and/or not being able to recruit quality<br />
candidates.<br />
K7
<strong>Halifax</strong> <strong>Regional</strong> <strong>Municipality</strong><br />
2010/11 Business Plans and Budget (Proposed) Human Resources<br />
The goals for Human Resources are:<br />
Business Unit Goals<br />
Goal 1:<br />
Goal 2:<br />
Goal 3:<br />
Goal 4:<br />
Goal 5:<br />
Goal 6:<br />
Goal 7:<br />
Goal 8:<br />
Shaping Organizational Culture<br />
Supporting a Healthy Work Environment<br />
Implementation of Human Resources Strategy<br />
Valuing Diversity and Inclusion<br />
Managing Organizational Change<br />
Provision of Strategic Direction and Technical Expertise in the<br />
Management of Human Resources<br />
HR Support for Internal Service Expectations<br />
HR Internal Partnership / Collaboration Requirements<br />
Goal 1:<br />
Shaping Organizational Culture<br />
Corporate Strategy Linkage:<br />
EMT Priority: Employer of Choice<br />
Description:<br />
Human Resources is committed to supporting the development of a respectful, constructive<br />
organizational culture that supports high performance, fosters collaboration and demonstrates<br />
HRM’s commitment to service excellence.<br />
Goal 1:<br />
Objectives for 2010/2011:<br />
HR 1.1<br />
HR 1.2<br />
HR 1.3<br />
HR 1.4<br />
HR 1.5<br />
HR 1.6<br />
Shaping Organizational Culture<br />
Promote, facilitate and support HRM’s core organizational values, ethics and<br />
principles as the cornerstones to HRM’s organizational culture through<br />
workplace education programs, behavioral competencies and performance<br />
reviews<br />
Develop, promote and roll out Conflict Resolution Toolkit for leaders and<br />
employees to support the development and maintenance of positive work<br />
relationships<br />
Improve employee orientation program in partnership with Business Units<br />
Review and revise leadership training opportunities, programs, or activities, to<br />
further align with HRM competencies, culture and required business outcomes<br />
Complete the development of leadership performance indicators for inclusion in<br />
PDP’s for all leadership levels<br />
Continue to review and revise HR policies and practices to support HRM in<br />
becoming an employer of choice<br />
K8
<strong>Halifax</strong> <strong>Regional</strong> <strong>Municipality</strong><br />
2010/11 Business Plans and Budget (Proposed) Human Resources<br />
Objectives for the next 3-5 years:<br />
HR 1.7<br />
HR 1.8<br />
Support and promote HRM’s core organizational ethics and values<br />
Support and promote cultural transformation to improve organizational<br />
performance and employee engagement<br />
Goal 2:<br />
Supporting a Healthy Work Environment<br />
Corporate Strategy Linkage:<br />
EMT Priority: Employer of Choice<br />
Description:<br />
Human Resources is committed to supporting a healthy, safe and harassment-free workplace to<br />
empower employees to live and work to their full potential. Highly effective organizations learn<br />
to shift their paradigm from health management to one of health promotion. Since there is a<br />
strong connection between the health and well being of people and their work environments,<br />
employees health is viewed as a foundation for sustained high performance and viability. When<br />
individuals feel valued, respected and satisfied in their jobs and work in safe and healthy<br />
environments, they are more likely to be productive and committed to their work. Ultimately,<br />
both the organization and the employees are positively impacted by focusing on healthy living<br />
and healthy working practices.<br />
Goal 2:<br />
Objectives for 2010/2011:<br />
HR 2.1<br />
HR 2.2<br />
HR 2.3<br />
HR 2.4<br />
Supporting a Healthy Work Environment<br />
Promote functional abilities as the baseline for managing health-related absences<br />
Facilitate additional learning and the use of Employee Family Assistance<br />
Program by managers/supervisors when dealing with staff-related challenges<br />
Promote prevention and education as optimal corporate health and safety<br />
strategies<br />
Complete duty to accommodate policy & protocol roll out (best practice)<br />
Objectives for the next 3-5 years:<br />
HR 2.5<br />
HR 2.6<br />
HR 2.7<br />
Promote “sick-leave” credits (health recovery benefit) as an employee benefit,<br />
not an entitlement<br />
Research options to reduce utilization of “sick-leave” credits for non healthrelated<br />
absences based on best practices<br />
Enhance and promote opportunities for flexibility of work environment (e.g.<br />
schedule and/or workload) as a way to support individual responsibility for<br />
maintaining good health and work-life balance<br />
K9
<strong>Halifax</strong> <strong>Regional</strong> <strong>Municipality</strong><br />
2010/11 Business Plans and Budget (Proposed) Human Resources<br />
Goal 3:<br />
Implementation of Human Resources Strategy<br />
Corporate Strategy Linkage:<br />
EMT Priority: Employer of Choice<br />
Description:<br />
Planning for HRM’s workforce and our ability to meet the needs of our citizens go hand in hand.<br />
Human Resources is committed to developing a Human Resources Strategy to guide the<br />
organization with identifying human resource requirements to meet business needs as well as<br />
assessing and developing HRM’s capability to attract and retain an effective workforce now and<br />
into the future. Key elements of the strategy include forecasting and planning human resource<br />
requirements, training and development, career planning, total compensation, internal<br />
communications, labour relations, organizational culture and job satisfaction.<br />
Goal 3:<br />
Objectives for 2010/2011:<br />
HR 3.1<br />
HR 3.2<br />
HR 3.3<br />
HR 3.4<br />
HR 3.5<br />
HR 3.6<br />
HR 3.7<br />
HR 3.8<br />
HR 3.9<br />
HR 3.10<br />
Implementation of Human Resources Strategy<br />
Complete the development of a Workforce Plan to support the forecasting and<br />
planning of human resource requirements to meet service needs. Begin<br />
implementation across the organization<br />
Support EMT with the development of a strategic, long term approach to<br />
improve employee engagement throughout the organization<br />
Complete the development of an HRM People Plan to act as a blue print for the<br />
recruitment and retention of employees committed to excellence in public<br />
service. (Exemplary people practices to support HRM in becoming an employer<br />
of choice and improve organizational capability)<br />
Review and make recommendations for improvement to the total compensation<br />
program to enhance our ability to attract and retain a skilled, motivated<br />
workforce<br />
Review and make recommendations for improvement to the performance-based<br />
pay program for non union staff<br />
Develop an effective communications strategy to promote a Total Compensation<br />
value for employees including pay, compensation and benefits<br />
Review HRM’s pension and benefits programs to ensure the organization obtains<br />
value for the significant investment made annually<br />
Continue to implement Corporate Labour Relations strategy and protocols<br />
through collective bargaining activities scheduled for 2010/11<br />
Facilitate and deliver labour relations training for HRM leaders working in a<br />
unionized environment<br />
Complete attendance support program revisions for approval and support<br />
implementation<br />
K10
<strong>Halifax</strong> <strong>Regional</strong> <strong>Municipality</strong><br />
2010/11 Business Plans and Budget (Proposed) Human Resources<br />
HR 3.11 Continue to enhance the performance development program (PDP) for leadership<br />
positions ensuring alignment with competencies, Council and Corporate<br />
priorities<br />
HR 3.12 In partnership with BPIM, finalize the project plan for the implementation of the<br />
SAP HR Training & Events module to house corporate training data. (Legislative<br />
compliance)<br />
HR 3.13 Establish three key indicators to measure HR performance across the<br />
organization<br />
Objectives for the next 3-5 years:<br />
HR 3.14<br />
HR 3.15<br />
HR 3.16<br />
HR 3.17<br />
HR 3.18<br />
HR 3.19<br />
HR 3.20<br />
HR 3.21<br />
Explore opportunities for improving the delivery of HR services through the use<br />
of technology<br />
Research tools and partnership opportunities available to support career planning<br />
Implement the Workforce Planning framework in partnership with business units<br />
to align with short and long term business needs<br />
Implement the HRM People plan based on priorities and best practices to support<br />
HRM in becoming an Employer of Choice<br />
Continue to review learning and development program to ensure alignment with<br />
business needs<br />
Continue to implement the corporate labour relations strategy based on business<br />
needs and best practices<br />
Provide support to the CAO with measuring employee engagement to improve<br />
organizational effectiveness<br />
Conduct an HR audit to review HRM’s HR policies, practices and procedures in<br />
relation to legislative compliance, business strategy and best practices with the<br />
goal of identifying areas for improvement<br />
Goal 4:<br />
Valuing Diversity and Inclusion<br />
Corporate Strategy Linkage:<br />
EMT Priority: Employer of Choice<br />
Description:<br />
Diversity is an organizational strength and HR will continue to focus resources on supporting the<br />
building of a workforce that is representative of our community and reflects a variety of talents,<br />
skills and perspectives.<br />
K11
<strong>Halifax</strong> <strong>Regional</strong> <strong>Municipality</strong><br />
2010/11 Business Plans and Budget (Proposed) Human Resources<br />
Goal 4:<br />
Objectives for 2010/2011:<br />
HR 4.1<br />
HR 4.2<br />
HR 4.3<br />
HR 4.4<br />
Valuing Diversity and Inclusion<br />
Provide support and expertise to business units with the implementation of<br />
diversity strategy and initiatives.<br />
Develop community partnerships to further HRM’s diversity goals<br />
Continue to increase and update training programs in the area of diversity<br />
including human rights, cultural competence, disability awareness and respect in<br />
the workplace<br />
Complete the development of an M.O.U with Human Rights Commission<br />
Objectives for the next 3-5 years:<br />
HR 4.5<br />
HR 4.6<br />
Review and update corporate diversity strategy/plan in partnership with Business<br />
Units as required to meet business and community needs<br />
Conduct an employment equity survey<br />
Goal 5:<br />
Managing Organizational Change<br />
Corporate Strategy Linkage:<br />
EMT Priority: Employer of Choice<br />
Description:<br />
Today’s business environment produces change in the workplace more suddenly and frequently<br />
than ever before. New technology, restructuring and downsizing are all factors that contribute to<br />
a growing climate of uncertainty. People have deep attachments to their organization, work<br />
group, and way of working. The ability to adapt to changing work conditions is key for individual<br />
and organizational survival. Change will be ever present and learning to manage and lead change<br />
includes not only understanding human factors but also the skills required to manage and lead<br />
change effectively.<br />
Goal 5:<br />
Objectives for 2010/2011:<br />
HR 5.1<br />
HR 5.2<br />
HR 5.3<br />
HR 5.4<br />
Managing Organizational Change<br />
Develop and pilot a model/framework to support organization/Business Units<br />
with change/transition planning and implementation<br />
Develop and deliver change management training to HRM leaders<br />
Develop and deliver Employee Transition Toolkit for Managers to support<br />
changes to the workforce<br />
Support the corporate communications team with the development of an internal<br />
communications plan<br />
Objectives for the next 3-5 years:<br />
K12
<strong>Halifax</strong> <strong>Regional</strong> <strong>Municipality</strong><br />
2010/11 Business Plans and Budget (Proposed) Human Resources<br />
HR 5.5<br />
Support business units with the implementation of change and transition<br />
planning activities which have an employee impact<br />
Goal 6:<br />
Provision of Strategic Direction and Technical Expertise in the<br />
Management of Human Resources<br />
Corporate Strategy Linkage:<br />
EMT Priority: Employer of Choice<br />
Description:<br />
Build and retain a dynamic, diverse and motivated team of skilled Human Resource professionals<br />
that are adaptable, flexible and able to respond to changing requirements and demands.<br />
Goal 6: Provision of Strategic Direction and Technical Expertise in the<br />
Management of Human Resources<br />
Objectives for 2010/2011:<br />
HR 6.1 Review HR’s structure and resources to ensure alignment to meet organizational<br />
needs (effective service)<br />
HR 6.2 Implement any required change to HR service delivery as a result of the Client<br />
Satisfaction Survey - September 2010<br />
HR 6.3 Support ongoing staff development through the provision of training<br />
opportunities and stretch assignments for HR staff to enhance service delivery<br />
and support the Business Units in retaining a highly skilled and engaged team<br />
Objectives for the next 3-5 years:<br />
HR 6.4<br />
HR 6.5<br />
HR 6.6<br />
HR 6.7<br />
Continue to update and and implement HR Succession Plan<br />
Continue documentation of HR business processes to improve service delivery,<br />
support business transition and enable knowledge retention<br />
Create and strengthen partnerships in the delivery of Human Resource Services<br />
both internally and externally<br />
Update action plan and continue with implementation of the corporate Employee<br />
Engagement Survey as it relates to HR staff<br />
K13
<strong>Halifax</strong> <strong>Regional</strong> <strong>Municipality</strong><br />
2010/11 Business Plans and Budget (Proposed) Human Resources<br />
Goal 7:<br />
HR Support for Internal Service Expectations<br />
Corporate Strategy Linkage:<br />
EMT Priority: Employer of Choice<br />
Excellence in Service Delivery<br />
Fiscal Responsibility<br />
Description:<br />
Often, HRM business units depend on the expertise of staff in other business units to support<br />
their operations and/or contribute to specific initiatives, committees and projects. As a corporate<br />
service provider the primary areas of expertise sought from Human Resources include leadership,<br />
strategic direction and technical expertise in the management of human resources. These internal<br />
service requests and requirements for the upcoming year that have not been captured under the<br />
previous goals listed in the plan include the following.<br />
Goal 7:<br />
HR Support for Internal Service Expectations<br />
Objectives for 2010/2011:<br />
HR 7.1<br />
HR 7.2<br />
HR 7.3<br />
HR 7.4<br />
Participate and provide input on corporate-wide initiatives such as the roll out of<br />
new desktop applications and operating system, review of the Multi-Year<br />
Financial Strategy, total compensation advice with respect to the Employee<br />
Engagement results; project support for Security Management System (badging),<br />
and participation in the implementation of corporate communications strategy<br />
Provide significant HR leadership, input, advice and support to Business Unit’s<br />
faced with various staffing challenges: including but not limited to realignments,<br />
hiring of community boards, facility closures, service review, position<br />
management and training support<br />
Participate on corporate committees as required: Employee Recognition;<br />
Corporate Awards; Labour Management; Information, Communication and<br />
Technology; United Way; and Corporate Accommodations<br />
Provide support for 2011 Canada Games staff volunteer strategy<br />
K14
<strong>Halifax</strong> <strong>Regional</strong> <strong>Municipality</strong><br />
2010/11 Business Plans and Budget (Proposed) Human Resources<br />
Goal 8:<br />
HR Internal Partnership / Collaboration Requirements<br />
Corporate Strategy Linkage:<br />
EMT Priority: Employer of Choice<br />
Excellence in Service Delivery<br />
Fiscal Responsibility<br />
Description:<br />
The provision of quality programs and services depends on business units and stakeholders<br />
working together. This is especially true in developing and implementing initiatives that have an<br />
effect throughout the organization. The internal partnership and collaboration requirements for<br />
the upcoming year that have not been captured under the previous goals listed in the plan include<br />
the following.<br />
Goal 8:<br />
HR Internal Partnership / Collaboration Requirements<br />
Objectives for 2010/2011:<br />
HR 8.1 HR to be collaborative partner with Business Unit’s requiring business process<br />
and/or policy change<br />
Objectives for the next 3-5 years:<br />
HR 8.2<br />
HR 8.3<br />
Develop and implement a Workforce Plan to address Business Unit’s concerns<br />
with recruitment, retirements, internal movement, and career planning<br />
Develop and implement a People Plan to promote exemplary people practices in<br />
supporting HRM in becoming an employer of choice and improve organizational<br />
capability<br />
K15
<strong>Halifax</strong> <strong>Regional</strong> <strong>Municipality</strong><br />
2010/11 Business Plans and Budget (Proposed) Human Resources<br />
Service Level Changes<br />
Increases In Services / new initiatives:<br />
• The development of a Workforce Planning tool to support the forecasting and planning of<br />
human resource requirements to meet service needs.<br />
• Increase in the support for diversity/inclusion programs and initiatives in partnership with<br />
Fire and Emergency Services.<br />
Decreases In Services / Operational Pressures:<br />
• Tight fiscal capacity increases pressure to manage position vacancies against service<br />
delivery requirements.<br />
• Succession planning program activities will be reduced as a result of a reduction in funds<br />
available for training, development and stretch assignments.<br />
• The requirement for workforce planning is critical to support business needs and resources<br />
to support this initiative are limited.<br />
• Increased workload for HR staff may effect service time.<br />
Expected Services Not Being Delivered:<br />
• None at this time.<br />
K16
Human Resources<br />
Summary of Gross Expenditures by Division<br />
2008-2009 2009-2010 2009-2010 2010-2011 Change over<br />
Actual Budget Projections Budget Budget Var as %<br />
A205 Administration 378,457 407,100 435,200 409,315 2,215 0.5<br />
A210 Org.Develop.& Health 1,579,172 1,742,890 1,672,790 1,790,480 47,590 2.7<br />
A220 Client Services 1,292,233 1,434,390 1,306,200 1,390,940 (43,450) (3.0)<br />
A221 WCB 5,842 25,000 25,000 105,470 80,470 321.9<br />
A230 Total Compensation 673,124 718,890 686,490 708,774 (10,116) (1.4)<br />
A240 Labour Relations 339,497 443,890 539,193 570,050 126,160 28.4<br />
Total $4,268,325 $4,772,160 $4,664,873 $4,975,029 $202,869 4.3<br />
Summary of Gross Revenue by Division<br />
2008-2009 2009-2010 2009-2010 2010-2011 Change over<br />
Actual Budget Projections Budget Budget Var as %<br />
A210 Org.Develop.& Health (3,045) 0 0 0 0 -<br />
A220 Client Services (3,706) 0 (600) 0 0 -<br />
A230 Total Compensation (750) 0 (32,150) (80,000) (80,000) -<br />
Total (7,501) 0 (32,750) (80,000) (80,000) -<br />
Summary of Net Expenditures by Division<br />
2008-2009 2009-2010 2009-2010 2010-2011 Change over<br />
Actual Budget Projections Budget Budget Var as %<br />
A205 Administration 378,457 407,100 435,200 409,315 2,215 0.5<br />
A210 Org.Develop.& Health 1,576,127 1,742,890 1,672,790 1,790,480 47,590 2.7<br />
A220 Client Services 1,288,527 1,434,390 1,305,600 1,390,940 (43,450) (3.0)<br />
A221 WCB 5,842 25,000 25,000 105,470 80,470 321.9<br />
A230 Total Compensation 672,374 718,890 654,340 628,774 (90,116) (12.5)<br />
A240 Labour Relations 339,497 443,890 539,193 570,050 126,160 28.4<br />
Total $4,260,824 $4,772,160 $4,632,123 $4,895,029 $122,869 2.6<br />
Summary by Expenditure & Revenue Types<br />
2008-2009 2009-2010 2009-2010 2010-2011 Change over<br />
Actual Budget Projections Budget Budget Var as %<br />
Expenditures<br />
Compensation & Benefits 3,349,841 3,872,600 3,682,108 4,017,800 145,200 3.7<br />
Office 86,071 67,900 88,570 56,410 (11,490) (16.9)<br />
Professional Fees 156,915 145,000 155,950 162,300 17,300 11.9<br />
Legal & Consulting Fees 80,837 86,000 38,000 56,204 (29,796) (34.6)<br />
External Services 54,727 15,600 45,300 15,700 100 0.6<br />
Supplies & Materials 6,588 7,000 7,000 7,000 0 -<br />
Utilities 56 0 0 0 0 -<br />
Building Costs 898 0 1,200 0 0 -<br />
Equipment & Communications 393 2,000 2,000 2,000 0 -<br />
Travel 57,153 23,900 40,500 19,995 (3,905) (16.3)<br />
Training & Education 348,163 392,800 367,500 368,300 (24,500) (6.2)<br />
Advertising & Promotion 20,202 1,000 2,000 (1,000) (100.0)<br />
Other Goods & Services 191,688 263,360 272,045 269,320 5,960 2.3<br />
Interdepartmental 75 0 500 0 0 -<br />
Transfer to/from Reserves (85,281) (105,000) (37,800) 0 105,000 (100.0)<br />
Expenditures 4,268,325 4,772,160 4,664,873 4,975,029 202,869 4.3<br />
Total $4,268,325 $4,772,160 $4,664,873 $4,975,029 $202,869 4.3<br />
Revenues<br />
Other Revenue (7,501) 0 (32,750) (80,000) (80,000) -<br />
Revenues (7,501) 0 (32,750) (80,000) (80,000) -<br />
Total (7,501) 0 (32,750) (80,000) (80,000) -<br />
Net Cost $4,260,824 $4,772,160 $4,632,123 $4,895,029 $122,869 2.6<br />
K17
<strong>Halifax</strong> <strong>Regional</strong> <strong>Municipality</strong><br />
2010/11 Business Plans and Budget (Proposed) HRM Police<br />
HRM Police<br />
Combined Business Plan of<br />
<strong>Halifax</strong> <strong>Regional</strong> Police & RCMP <strong>Halifax</strong> District<br />
Business Plan - 2010/11
<strong>Halifax</strong> <strong>Regional</strong> <strong>Municipality</strong><br />
2010/11 Business Plans and Budget (Proposed) HRM Police<br />
Business Unit Overview:<br />
The <strong>Halifax</strong> <strong>Regional</strong> Police (HRP) and <strong>Halifax</strong> District of the Royal Canadian Mounted Police<br />
(RCMP), as policing partners, are responsible for providing policing across all of the <strong>Halifax</strong><br />
<strong>Regional</strong> <strong>Municipality</strong> (HRM). These two agencies strive to provide safety, peace and order in<br />
the community.<br />
Director: HRP: Chief Frank Beazley RCMP: Supt. Darrell Beaton<br />
Administration<br />
Patrol / RCMP<br />
Offices<br />
Criminal<br />
Investigation<br />
(Integrated Units)<br />
Shared Services/<br />
Community Projects<br />
Support Operations<br />
Provides Financial, Human Resources, Fleet, Employee Family<br />
Assistance, accident reporting services and summary offence ticket<br />
processing.<br />
Provides 24/7 uniformed patrol and response by HRP and RCMP for<br />
all of HRM to emergency and non-emergency calls. Also includes<br />
the Quick Response Unit - Street Crime Enforcement Unit and the<br />
Integrated K-9 Unit (Police Service Dog) for all of HRM.<br />
This Division is integrated, with HRP and RCMP members working<br />
together as one team providing service across all of HRM. It provides<br />
specialized investigative services such as General Investigation<br />
Section, Major Crime, Financial Crime, Vice, HRP Forensic<br />
Identification, Drugs, and Cold Case.<br />
Provides Audit/Policy, Bylaw, Animal Services, Taxi & Limousine.<br />
Youth Live, Exhibits/Property, School Crossing Guards Program,<br />
<strong>Book</strong>ing , Commissionaires, Quartermasters/Lost/Found property and<br />
Integrated Emergency Services (911 Dispatch)<br />
Provides records services, court file services and Training.<br />
Public Safety Office<br />
Responsible for addressing the recommendations of the Mayor’s<br />
Roundtable Report, this office is comprised of a Public Safety<br />
Officer; Community Relations/Crime Prevention office (including<br />
School Officers, Volunteer Services and Victim Services); Traffic<br />
Section; Mobile Mental Health Team; Parks Patrol, Community<br />
Response Team and City Watch.<br />
L2
<strong>Halifax</strong> <strong>Regional</strong> <strong>Municipality</strong><br />
2010/11 Business Plans and Budget (Proposed) HRM Police<br />
Core Operations and Services provided:<br />
• The <strong>Halifax</strong> <strong>Regional</strong> Police and the <strong>Halifax</strong> District RCMP provide HRM with crime<br />
prevention, law enforcement, assistance to victims of crime, emergency and enhanced<br />
services, and Public Order maintenance services<br />
• Combined HRP/RCMP human resources of 980 full time equivalents (FTE) sworn and<br />
civilian positions<br />
• HRP vehicle fleet of 282 marked and unmarked vehicles (272 owned + 10 rental)<br />
• RCMP vehicle fleet of 91 marked and unmarked vehicles (83 owned + 8 rental)<br />
• HRP and RCMP responded to a total of 152,687 dispatched calls for service in 2009<br />
• Integrated Emergency Services (IES) answered 89,658 Emergency 911calls and 259,969 nonemergency<br />
calls in 2009, an average of 236 emergency calls and 712 non-emergency calls per<br />
day<br />
• HRM Police had an average response time of 7.6 minutes to Priority 1 Calls for Service.<br />
HRP Funded Full Time Equivalents (FTEs):<br />
Funded FTEs (includes<br />
permanent and temporary)<br />
2008/09<br />
(Approved)<br />
753 FTEs<br />
469 Police<br />
Officers Funded<br />
by HRM<br />
2009/10<br />
(Approved)<br />
769 FTEs<br />
470 Police<br />
Officers Funded<br />
by HRM<br />
2010/11<br />
(Proposed)<br />
749.5 FTEs<br />
471 Police<br />
Officers Funded<br />
by HRM *<br />
22 Police Officers<br />
Funded by the<br />
Province of NS<br />
39 Police Officers<br />
Funded by the<br />
Province of NS<br />
39 Police Officers<br />
Funded by the<br />
Province of NS<br />
17 Police Officers<br />
Funded by<br />
Secondments<br />
15 Police Officers<br />
Funded by<br />
Secondment<br />
13 Police Officers<br />
Funded by<br />
Secondment<br />
245 civilians 245 Civilians 226.5 Civilians **<br />
* Note: Two Community Response Team positions were moved from Civilian to Sworn,<br />
One sworn position in Computer Forensics changed to civilian.<br />
**Note The civilian count of 2009/10 included part time positions counted as FTE. The<br />
new civilian FTE reflects the FTE counting guidelines of HRM.<br />
L3
<strong>Halifax</strong> <strong>Regional</strong> <strong>Municipality</strong><br />
2010/11 Business Plans and Budget (Proposed) HRM Police<br />
RCMP Full Time Equivalents (FTEs):<br />
RCMP FTEs managed by<br />
<strong>Halifax</strong> District<br />
2008/09<br />
(Approved)<br />
228 FTEs<br />
2009/10<br />
(Approved)<br />
228 FTEs<br />
2010/11<br />
(Proposed)<br />
230.5 FTEs<br />
RCMP <strong>Halifax</strong> District Budget<br />
(as billed to HRM by NS DOJ<br />
under the PPSA*)<br />
178 Police<br />
Officers and 28<br />
support staff<br />
funded by HRM<br />
178 Police<br />
Officers and 28<br />
support staff<br />
funded by HRM<br />
178 Police<br />
Officers and 29.5<br />
support staff<br />
funded by HRM<br />
Province of NS funded Police<br />
Officers and support staff under<br />
the PPSA<br />
6 Police Officers<br />
and 1 support<br />
staff<br />
6 Police Officers<br />
and 1 support<br />
staff<br />
6 Police Officers<br />
and 1 support<br />
staff<br />
12 Police Officers<br />
funded under the<br />
Safer Streets<br />
initiative.<br />
12 Police Officers<br />
funded under the<br />
Safer Streets<br />
initiative.<br />
11 Police Officers<br />
and 1 Crime<br />
Analyst funded<br />
under the Safer<br />
Streets initiative.<br />
RCMP Corporate funded support<br />
for HRM Versaterm CAD/RMS<br />
and corporate communications<br />
activities<br />
Versaterm<br />
Sustainment<br />
FTEs 2<br />
Communications<br />
FTE 1<br />
Versaterm<br />
Sustainment<br />
FTEs 2<br />
Communications<br />
FTE 1<br />
Versaterm<br />
Sustainment **<br />
FTEs 3<br />
Communications<br />
FTE 1***<br />
Note:<br />
* Note Provincial Police Service Agreement<br />
**Note Two RCMP positions (STIU Analyst and ORMS Coordinator) no longer<br />
corporately funded; however, funding for three Versadex support positions<br />
provided.<br />
***Note One Communications Strategist position funded corporately by the RCMP<br />
L4
<strong>Halifax</strong> <strong>Regional</strong> <strong>Municipality</strong><br />
2010/11 Business Plans and Budget (Proposed) HRM Police<br />
Analysis of <strong>Operating</strong> Budget Changes (HRP):<br />
<strong>Operating</strong> Budget Change Details<br />
($000’s)<br />
2009/10 Budget $66,382<br />
1 Compensation & Benefits – costing changes driven by union contracts, 3,545.4<br />
increased staffing for full year and employee benefits<br />
2 Community Projects – reduction of 2 vacant positions (105.1)<br />
3 HRM Corporate wide reductions (110.6)<br />
4 Increased revenue for external secondments (300)<br />
5 Increased revenues for Fees (82)<br />
6 Facilities rent 48.2<br />
7. Reduction in interdepartmental charges (246.1)<br />
8. Increase in cost of TMR contract 46.2<br />
9. Miscellaneous decrease in various items (22.8)<br />
2010/11 Budget $69,155<br />
Analysis of <strong>Operating</strong> Budget Changes (RCMP):<br />
<strong>Operating</strong> Budget Change Details<br />
($000's)<br />
2009/10 Budget $20,353.1<br />
1 Increased cost of contract reflects an increased per officer cost of 1.6%,<br />
272.6<br />
$114,050 to $115,875<br />
2010/11 Budget $20,625.7<br />
L5
<strong>Halifax</strong> <strong>Regional</strong> <strong>Municipality</strong><br />
2010/11 Business Plans and Budget (Proposed) HRM Police<br />
Key Challenges and Opportunities<br />
The following challenges and opportunities will have an impact on HRP and RCMP in the 2010-<br />
2015 timeframe.<br />
Challenges with Community-wide Impact:<br />
These are challenges or opportunities which affect the entire HRM Region, and which the<br />
Business Unit plays a role in influencing or addressing the outcome. Multiple business units may<br />
be involved in addressing the issue.<br />
• Public Safety Office and the Response to the Mayors Roundtable: The work on the<br />
Mayors Roundtable Report and the creation of the Public Safety Office has laid the<br />
groundwork for significant progress in several key areas and will continue in 2010/2011.<br />
Numerous initiatives are underway and planned within the following five themes:<br />
• Sustainability Initiatives,<br />
• Diversity<br />
• Police Community Response<br />
• Community Engagement<br />
• Partnerships<br />
• Community Response/ Crime Reduction: HRM Police will continue to employ the HRP<br />
Community Response Model and the RCMP Crime Reduction Strategy to increase police<br />
visibility, reduce crime and the fear of crime, and increase public safety.<br />
• Major Event Preparation: HRM Police will continue to prepare for major events coming to<br />
HRM in 2010/2011, including the two day concert on the Commons and the 2011 Canada<br />
Winter Games. These preparations will include the use of video surveillance.<br />
Challenges with Service Delivery / Business Unit Impact:<br />
These are issues which affect the business unit’s ability to deliver services (both internally and<br />
externally).<br />
• Leveraging Information Technology: HRM Police will continue to move forward with<br />
significant IT projects including a major upgrade to the records management system,<br />
expansion of digital imaging, electronic disclosure and crime analysis.<br />
• Contract Negotiations: HRP - One contract is to be negotiated in 2010, the MAPP Collective<br />
Agreement.<br />
• Succession Management: HRM Police will continue to develop the large number of new<br />
officers hired over the previous years with targeted training initiatives. Succession<br />
management for specialized positions and senior officers will continue through training and<br />
L6
<strong>Halifax</strong> <strong>Regional</strong> <strong>Municipality</strong><br />
2010/11 Business Plans and Budget (Proposed) HRM Police<br />
development to ensure that there is sufficient expertise available to meet the challenges faced<br />
by both agencies.<br />
The goals for both HRM police services are:<br />
Business Unit Goals<br />
1. Practise Fiscal stewardship and responsibility.<br />
2. Provide excellence in Service Delivery.<br />
3. By April 1, 2011 reduce the Center for Canadian Justice Statistics Reported Crime from<br />
2009/10 levels by the following:<br />
Category HRP RCMP<br />
Crimes against persons - 2 % - 2 %<br />
Crimes against property - 2 % - 2 %<br />
Drug Charges laid + 5 % + 5 %<br />
4. Increase from the 2009/10 total number of volunteers involved with HRM Policing by 5%<br />
by end of fiscal year 2011.<br />
The above will be accomplished through the achievement of the following goals for HRM Police<br />
services:<br />
Goal 1:<br />
Goal 2:<br />
Goal 3:<br />
Goal 4:<br />
Goal 5:<br />
Goal 6:<br />
Mayor’s Roundtable Report<br />
Community Response/Crime Reduction<br />
Major Event Preparation<br />
Leveraging Information Technology<br />
Contract Negotiation<br />
Succession Management<br />
Goal 1:<br />
Mayors Roundtable Report<br />
Corporate Strategy Linkage:<br />
Outcome Area: Safe and Welcoming Communities<br />
Council Focus Area: Public Safety<br />
Description:<br />
The work on the Mayors Roundtable Report and creation of the Public Safety Office has been<br />
laying the groundwork for significant progress in several key areas. The numerous initiatives<br />
have been organized within the following five themes:<br />
1. Sustainability Initiatives: HRM as an organization must undertake a variety of initiatives<br />
to improve public safety.<br />
L7
<strong>Halifax</strong> <strong>Regional</strong> <strong>Municipality</strong><br />
2010/11 Business Plans and Budget (Proposed) HRM Police<br />
2. Diversity: Strengthen HRM’s connection with our diverse communities while at the same<br />
time addressing quality-of-life issues within those communities.<br />
3. Police Community Response: <strong>Halifax</strong> <strong>Regional</strong> Police and the RCMP <strong>Halifax</strong> District<br />
must continue to implement policing strategies which reduce crime and enhance public<br />
safety.<br />
4. Community Engagement: Engage citizens and community groups in playing an active<br />
role in public safety in HRM.<br />
5. Partnerships: Align with all levels of government, social agencies and community<br />
partners to realize efficiencies and improve public safety programs and services in HRM.<br />
A detailed report was submitted to Chair and Members of the <strong>Halifax</strong> <strong>Regional</strong> Board of Police<br />
Commissioners on December 14, 2009.<br />
Goal 1:<br />
Mayors Roundtable Report<br />
Objectives for 2010/2011:<br />
HRMP 1.1 Continue to implement, track progress, and refine the action plan for the Mayor’s<br />
Roundtable<br />
HRMP 1.2 Implement a Public Safety communications plan.<br />
HRMP 1.3 Implement, track progress and refine the HRM Public Safety Logic Model.<br />
Objectives for the next 3-5 years:<br />
HRMP 1.4 Continue to implement, track progress and refine the action plan for the Mayor’s<br />
Roundtable.<br />
HRMP 1.5 Continue to implement, track progress and refine the Public Safety<br />
Communications plan.<br />
HRMP 1.6 Track the progress of the action plans of the ad-hoc Race Relations Working<br />
Group, the ad-hoc Housing Working Group and the Safer and Stronger<br />
Communities initiative.<br />
L8
<strong>Halifax</strong> <strong>Regional</strong> <strong>Municipality</strong><br />
2010/11 Business Plans and Budget (Proposed) HRM Police<br />
Goal 2:<br />
Community Response/ Crime Reduction<br />
Corporate Strategy Linkage:<br />
Outcome Area: Safe and Welcoming Communities<br />
Council Focus Area: Public Safety<br />
Description:<br />
<strong>Halifax</strong> <strong>Regional</strong> Police and <strong>Halifax</strong> District RCMP recognize that there is a continuing fear of<br />
crime and youth violence in the community and increasing the sense of safety in HRM is vital to<br />
the <strong>Municipality</strong>’s growth and development. Police also recognize that there are other issues in<br />
local neighbourhoods and communities, such as noise, youth, graffiti and traffic, which are not as<br />
high profile in nature but are issues that are vital to quality of life and sense of safety within<br />
HRM; and that HRM has many unique and diverse communities with different needs. These<br />
issues have been identified as areas for priority by HRM Council in the Public Safety Focus<br />
Area. Dealing with the fear of crime and youth violence and local neighbourhood and<br />
community issues requires full commitment from the police, as well as support from other HRM<br />
Business Units, all levels of government, and cooperation and partnerships with businesses and<br />
citizens in all communities within HRM.<br />
The public continues to demand a high level of service and visibility from the police. With<br />
growth in HRM and changes in technology, forensic identification, and Internet crimes, there is a<br />
continued increase in demand for services. Demands for disclosure and changes in government<br />
legislation and court decisions result in changes in processes which necessitate police officers<br />
spending more time on calls and preparing court files. The amount of time and resources required<br />
to process calls for service continues to increase; thereby decreasing the amount of pro-active<br />
time police officers can spend on local public disorder issues such as noise, graffiti and youth<br />
complaints. Police continue to examine technology processes and resource needs to determine<br />
the most efficient and effective way to meet the demands for service and visibility and to<br />
determine if new resources are required in the future.<br />
As noted, HRM Police are committed to reducing crime as outlined in the following table:<br />
Category HRP RCMP<br />
Crimes against persons - 2 % - 2 %<br />
Crimes against property - 2 % - 2 %<br />
Drug Charges laid + 5 % + 5 %<br />
L9
<strong>Halifax</strong> <strong>Regional</strong> <strong>Municipality</strong><br />
2010/11 Business Plans and Budget (Proposed) HRM Police<br />
Goal 2:<br />
Community Response/ Crime Reduction<br />
Objectives for 2010/2011:<br />
HRMP 2.1<br />
Achieve the Crime Reduction Goals<br />
HRMP 2.2 RCMP – Implement the next stages of its Crime Reduction strategy through<br />
expanded use of Crime Analysis techniques, including the use of the CompStat<br />
model.<br />
HRMP 2.3 Evaluate current RCMP Crime Prevention/Community Policing programs to<br />
ensure alignment with community priorities ( underway )<br />
HRMP 2.4 Enhance the capacity to provide crime analysis products to front line policing to<br />
deal with emerging trends and hotspots.<br />
Objectives for the next 3-5 years:<br />
HRMP 2.5 Enhance the economic viability of HRM through reduction in crime and increase<br />
the sense of safety felt by citizens of HRM<br />
Goal 3:<br />
Major Event Preparation<br />
Corporate Strategy Linkage:<br />
Outcome Area: Safe and Welcoming Communities<br />
Council Focus Area: Public Safety<br />
Description:<br />
HRM has and will continue to host national and international events that draw large crowds to<br />
our area. The HRP and the RCMP are actively working to strengthen our incident command<br />
system and expand our ability to provide a safe and welcoming environment for the citizens and<br />
guest of HRM. In the coming year, HRM will host the Queen’s Visit, the Navy’s 100 th<br />
Anniversary, at least two major concerts on the Commons and the 2011 Canada Winter Games.<br />
Goal 3:<br />
Major Event Preparation<br />
Objectives for 2010/2011:<br />
HRMP 3.1 Expand the capability to deploy closed circuit video for large scale events.<br />
HRMP 3.2 Further develop the expertise of incident commanders to manage large scale<br />
events through training and mentorship.<br />
HRMP 3.3 Provide a safe and positive experience for all attendees to major events in HRM.<br />
Objectives for the next 3-5 years:<br />
L10
<strong>Halifax</strong> <strong>Regional</strong> <strong>Municipality</strong><br />
2010/11 Business Plans and Budget (Proposed) HRM Police<br />
HRMP 3.4<br />
HRMP 3.5<br />
Develop the infrastructure and experience to support multiple large scale events<br />
in HRM.<br />
Research, procure and deploy Major Event/Emergency Management software.<br />
Goal 4:<br />
Leveraging Information Technology<br />
Corporate Strategy Linkage:<br />
Outcome Area: Safe and Welcoming Communities<br />
Council Focus Area: Public Safety<br />
Description:<br />
The HRP and RCMP continue to explore and develop new technological initiatives that leverage<br />
the investments made in infrastructure and information management. The goal of these initiatives<br />
is to improve the effectiveness of police personnel, to reduce crime and to improve public safety.<br />
Goal 4:<br />
Leveraging Information Technology<br />
Objectives for 2010/2011:<br />
HRMP 4.1 Implement new Records Management System (RMS) servers and upgrade RMS<br />
to meet the Canadian Police Information Center (CPIC) Phase III and provide<br />
training to all HRP/RCMP members (sworn and civilian) on the upgraded RMS<br />
system .<br />
HRMP 4.2 Re-platform Computer Aided Dispatch (CAD) onto new servers and upgrade<br />
CAD from V6.3 to V7.2 and ensure HRP and RCMP personnel are trained on its<br />
use.<br />
HRMP 4.3 Implement E-File management solution (HRM electronic document storage).<br />
HRMP 4.4 Implementation of Electronic Summary Offence Ticket (E-SOT) solution in<br />
collaboration with the Province of Nova Scotia<br />
Objectives for the next 3-5 years:<br />
HRMP 4.5 Ensure HRM Police is positioned to quickly and efficiently respond to changes in<br />
the security architecture and IT infrastructure of national systems as they<br />
interface with HRM’s CAD and RMS.<br />
L11
<strong>Halifax</strong> <strong>Regional</strong> <strong>Municipality</strong><br />
2010/11 Business Plans and Budget (Proposed) HRM Police<br />
Goal 5:<br />
Contract Negotiations<br />
Corporate Strategy Linkage:<br />
Outcome Area: Safe and Welcoming Communities<br />
Council Focus Area: Public Safety<br />
Description:<br />
One Collective Agreement is coming up for negotiation in the 2010-2011 Fiscal Year:<br />
1. Municipal Association of Police Personnel (MAPP) who represent the 511sworn<br />
officers and 106 civilian personnel within HRP<br />
Goal 5:<br />
Contract Negotiations<br />
Objectives for 2010/2011:<br />
HRMP 5.1<br />
Successfully negotiate an equitable collective agreement with MAPP.<br />
Objectives for the next 3-5 years:<br />
HRMP 5.2 Maintain a stable workforce with no impacts on service delivery due to contract<br />
issues.<br />
Goal 6:<br />
Succession Management<br />
Corporate Strategy Linkage:<br />
Outcome Area: Safe and Welcoming Communities<br />
Council Focus Area: Public Safety<br />
Description:<br />
HRP retirements rates have slowed since 2009, however HRP is still continuing to deal with the<br />
loss of experience and expertise at all levels of the organization, and is especially prevalent in the<br />
specialized investigative sections (e.g. CID) and the mid and senior management levels. It is<br />
forecasted that 52 HRP officers will be eligible for retirement by the end of 2011. Historically,<br />
one third of officers eligible to retire will retire at their earliest date. At that rate, HRP is<br />
anticipating hiring at least 17 police officers over the next two years to replace retirees.<br />
The internal focus of HRP has moved to training and staff development to gain expertise and the<br />
experience necessary to provide the professional level of service demanded by the public in<br />
policing a diverse society. The action plan continues to be implemented to deal with this<br />
challenge.<br />
At a national level, the RCMP predicts that approximately 4% of their members will leave the<br />
organization in 2010-2011. The RCMP (nationally) has initiated a program to recruit and train<br />
approximately 770 cadets in 2010-2011 to pro-actively deal with expected attrition. The<br />
significant turnover of resources experienced by <strong>Halifax</strong> District RCMP over the last 2-3 years is<br />
L12
<strong>Halifax</strong> <strong>Regional</strong> <strong>Municipality</strong><br />
2010/11 Business Plans and Budget (Proposed) HRM Police<br />
starting to slow. The Officer in Charge and the management team have, and will continue, to<br />
aggressively manage the training and succession planning of resources with RCMP Human<br />
Resources Branch to ensure the correct mix of service and experience is maintained within the<br />
District.<br />
The overarching goal is for all HRP and the RCMP personnel to have the specialized skill sets<br />
required to support excellence in police service delivery.<br />
Goal 6:<br />
Succession Management<br />
Objectives for 2010/2011:<br />
HRMP 6.1 Provide ongoing operational and investigative training to the large number of<br />
HRP and RCMP Patrol Officers hired over recent years<br />
HRMP 6.2 Ensure middle managers are provided with appropriate professional development<br />
opportunities to prepare them for future leadership roles within the organization.<br />
Objectives for the next 3-5 years:<br />
HRMP 6.3 Continue to deliver and improve on the HRP Block Training Module and Online<br />
Video Training<br />
HRMP 6.4 For <strong>Halifax</strong> District RCMP to continue to develop and expand its District-level<br />
training program; and to maximize its use of training opportunities offered by the<br />
RCMP at the Division, Region and National levels.<br />
Service Level Changes<br />
Increases In Services / New Initiatives:<br />
There are no forecasted service level changes for HRM Police<br />
Decreases In Services / Operational Pressures (OP):<br />
There are no forecasted service level changes for HRM Police<br />
Expected Services Not Being Delivered:<br />
None<br />
L13
<strong>Halifax</strong> <strong>Regional</strong> <strong>Municipality</strong> Police Services<br />
Summary of Gross Expenditures by Division<br />
2008-2009 2009-2010 2009-2010 2010-2011 Change over<br />
Actual Budget Projections Budget Budget Var as %<br />
Executive Office<br />
P125 Audit & Planning 301,446 340,300 381,868 349,900 9,600 2.8<br />
P130 Facilities & Prop. 242,203 147,800 191,990 81,000 (66,800) (45.2)<br />
P255 Exhibits & Property 440,724 351,000 479,522 347,770 (3,230) (0.9)<br />
P270 Commissionaires 1,429,343 1,301,300 1,309,162 1,329,200 27,900 2.1<br />
P310 R.A.P.I.D. 15,954 71,800 28,763 71,600 (200) (0.3)<br />
P311 Projects Unit 186,720 268,600 334,202 434,800 166,200 61.9<br />
P315 Inves. Call BackUnit 260,621 230,700 213,072 255,000 24,300 10.5<br />
P370 <strong>Book</strong>ing 567,426 578,100 600,207 624,900 46,800 8.1<br />
3,444,436 3,289,600 3,538,786 3,494,170 204,570 6.2<br />
Chief's Division<br />
P105 Chief's Office 1,072,315 1,228,040 928,001 1,235,800 7,760 0.6<br />
P110 Professional Stds 130,354 119,500 121,531 119,400 (100) (0.1)<br />
P120 Public Affairs 390,116 381,300 440,224 351,390 (29,910) (7.8)<br />
P135 Board Of Police Comm 9,720 7,000 9,037 7,000 0 -<br />
1,602,505 1,735,840 1,498,793 1,713,590 (22,250) (1.3)<br />
Chief's Office 5,046,940 5,025,440 5,037,579 5,207,760 182,320 3.6<br />
Deputy Operational Support<br />
P115 Legal 122,406 135,000 290,243 135,000 0 -<br />
P205 Superintendent's Off 402,002 483,400 435,166 490,000 6,600 1.4<br />
P208 Back Check 145,541 308,400 387,554 306,400 (2,000) (0.6)<br />
669,949 926,800 1,112,963 931,400 4,600 0.5<br />
Support Division<br />
P225 Training 909,944 909,300 1,072,235 743,288 (166,012) (18.3)<br />
P245 Court Officers 1,020,943 997,600 1,108,269 1,024,800 27,200 2.7<br />
P265 Records 498,762 583,800 624,698 611,200 27,400 4.7<br />
2,429,649 2,490,700 2,805,202 2,379,288 (111,412) (4.5)<br />
General Administration<br />
S110 General Manager's Of 107,493 118,800 138,850 136,030 17,230 14.5<br />
S120 Comm. Proj. Admin. 176,946 289,800 204,200 245,100 (44,700) (15.4)<br />
284,438 408,600 343,050 381,130 (27,470) (6.7)<br />
Facilities/Buildings<br />
S231 947 Mitchell 34,660 31,600 51,250 38,000 6,400 20.3<br />
S232 1300 St Margaret's B 11,936 17,600 17,750 18,900 1,300 7.4<br />
S233 3790 MacKintosh 1,151 0 0 0 0 -<br />
47,747 49,200 69,000 56,900 7,700 15.7<br />
Initiatives<br />
S241 Paper Recycling 217,318 236,100 221,700 210,363 (25,737) (10.9)<br />
S242 Enviro Depot 575,048 613,900 637,900 796,400 182,500 29.7<br />
S243 By Law Remedies 245,390 333,700 275,220 93,400 (240,300) (72.0)<br />
S244 Organic Carts 68,200 75,700 78,050 151,900 76,200 100.7<br />
1,105,955 1,259,400 1,212,870 1,252,063 (7,337) (0.6)<br />
Operations<br />
S210 Operation's Adm 285,232 280,700 296,650 286,810 6,110 2.2<br />
S220 Trucking/Fleet serv 93,442 114,600 100,100 104,900 (9,700) (8.5)<br />
1,532,377 1,703,900 1,678,620 1,700,673 (3,227) (0.2)<br />
Contractual Services<br />
S310 Contractual Serv Adm 201,383 287,800 253,500 296,900 9,100 3.2<br />
S320 Animal control 847,036 958,900 935,950 990,300 31,400 3.3<br />
S330 Taxi & Limousine 181,569 185,300 192,150 185,000 (300) (0.2)<br />
1,229,988 1,432,000 1,381,600 1,472,200 40,200 2.8<br />
Community Standards<br />
S410 By-Law Services Adm 343,157 410,500 328,350 449,700 39,200 9.5<br />
S420 By-Law Serv.Enforce. 647,429 698,200 672,560 731,700 33,500 4.8<br />
990,586 1,108,700 1,000,910 1,181,400 72,700 6.6<br />
Contracted Services<br />
P460 Sch. Crossing Guard 1,269,843 1,551,600 1,455,550 1,509,000 (42,600) (2.7)<br />
P463 Park Patrol 108 0 0 0 0 -<br />
1,269,951 1,551,600 1,455,550 1,509,000 (42,600) (2.7)<br />
Community Projects & Bylaw 5,307,339 6,204,800 5,859,730 6,244,403 39,603 0.6<br />
L14
<strong>Halifax</strong> <strong>Regional</strong> <strong>Municipality</strong> Police Services<br />
Summary of Gross Expenditures by Division (continued)<br />
2008-2009 2009-2010 2009-2010 2010-2011 Change over<br />
Actual Budget Projections Budget Budget Var as %<br />
P210 EAP 89,027 95,100 109,661 114,700 19,600 20.6<br />
P220 Human Resources 465,185 272,400 521,321 538,500 266,100 97.7<br />
P230 Finance 508,116 478,700 531,558 492,800 14,100 2.9<br />
P235 Extra Duty 294,335 448,000 458,341 450,700 2,700 0.6<br />
P240 SOTS 474,404 510,300 548,566 463,100 (47,200) (9.2)<br />
P250 Fleet Maintenance 1,875,481 1,859,900 1,815,100 1,701,264 (158,636) (8.5)<br />
3,706,547 3,664,400 3,984,547 3,761,064 96,664 2.6<br />
Emergency 911 Communications<br />
A450 Integrated Emerg Srv 5,821,480 6,420,540 6,054,568 6,617,200 196,660 3.1<br />
A452 Eric Spicer-Operatio 177,362 193,400 183,511 193,400 0 -<br />
5,998,842 6,613,940 6,238,079 6,810,600 196,660 3.0<br />
Dispatch<br />
N711 Dispatch Centre 36,173 77,800 43,678 77,800 0 -<br />
36,173 77,800 43,678 77,800 0 -<br />
Police<br />
N721 HRP 362,858 366,700 301,794 412,944 46,244 12.6<br />
362,858 366,700 301,794 412,944 46,244 12.6<br />
Fire<br />
N731 Core Fire & EMO 157,600 157,600 654 157,600 0 -<br />
N732 Rural Fire 458,600 458,600 544,746 458,600 0 -<br />
616,200 616,200 545,400 616,200 0 -<br />
Non-Emergency<br />
N742 Transit 0 0 1,745 0 0 -<br />
0 0 1,745 0 0 -<br />
Integrated Dispatch Communic 1,015,230 1,060,700 892,617 1,106,944 46,244 4.4<br />
Integrated Emergency Service 7,014,072 7,674,640 7,130,696 7,917,544 242,904 3.2<br />
Operational Support 19,127,557 20,961,340 20,893,138 21,233,699 272,359 1.3<br />
Deputy Operations<br />
P405 Deputy Operations 1,084,252 988,100 902,736 1,053,500 65,400 6.6<br />
1,084,252 988,100 902,736 1,053,500 65,400 6.6<br />
Criminal Investigations Divi<br />
P312 SES Technical Unit 294,589 214,500 297,150 224,600 10,100 4.7<br />
P313 VICLAS 103,592 111,700 113,633 115,000 3,300 3.0<br />
P314 Computer Forensics 186,587 181,000 206,924 191,100 10,100 5.6<br />
P316 CID 3,184,651 3,052,700 3,406,987 3,950,030 897,330 29.4<br />
P317 CATS Clearing Account 1,361,935 (268,700) (268,700) (5,100) 263,600 (98.1)<br />
P320 Polygraph 767 169,200 183,140 188,000 18,800 11.1<br />
P325 Identification 1,512,226 1,517,600 1,532,072 1,500,490 (17,110) (1.1)<br />
P330 Fraud Unit 1,057,392 1,041,000 1,075,539 1,070,800 29,800 2.9<br />
P335 Special Enforcement 1,253,680 1,209,700 1,536,174 1,182,200 (27,500) (2.3)<br />
P340 Criminal Intel Unit 947,072 814,200 1,016,476 857,300 43,100 5.3<br />
P345 Vice 959,811 432,200 725,551 406,500 (25,700) (5.9)<br />
P355 Crime Stoppers 33 0 0 0 0 -<br />
P360 GIS 4,142,140 3,332,700 4,322,640 3,237,600 (95,100) (2.9)<br />
P375 Major Crime 3,021,738 2,567,100 2,899,308 2,802,810 235,710 9.2<br />
P380 Crime Analysis 216,987 268,200 277,388 275,400 7,200 2.7<br />
18,243,201 14,643,100 17,324,282 15,996,730 1,353,630 9.2<br />
Operations Central<br />
P410 Shared Resources 1,580,035 1,174,600 1,747,253 1,206,500 31,900 2.7<br />
P415 Central 7,561,777 9,608,100 8,122,212 10,190,700 582,600 6.1<br />
P435 Canine 5,968 20,600 30,238 20,600 0 -<br />
P445 Marine 66,726 53,300 67,677 53,300 0 -<br />
P455 Bike Patrol 14,106 6,000 4,212 6,000 0 -<br />
P465 Mounted 19,949 8,200 12,678 8,200 0 -<br />
P470 Port's Policing 295,013 332,800 400,449 333,400 600 0.2<br />
P475 QRU 2,094,752 2,021,100 2,358,885 1,961,400 (59,700) (3.0)<br />
11,638,326 13,224,700 12,743,604 13,780,100 555,400 4.2<br />
L15
<strong>Halifax</strong> <strong>Regional</strong> <strong>Municipality</strong> Police Services<br />
Summary of Gross Expenditures by Division (continued)<br />
2008-2009 2009-2010 2009-2010 2010-2011 Change over<br />
Actual Budget Projections Budget Budget Var as %<br />
Operations East<br />
P425 East 7,323,590 9,652,600 8,655,354 10,052,400 399,800 4.1<br />
P450 Public Safety Unit 12,823 10,200 5,131 10,200 0 -<br />
7,336,412 9,662,800 8,660,485 10,062,600 399,800 4.1<br />
Operations West<br />
P420 West 7,068,845 7,985,500 7,767,891 8,297,100 311,600 3.9<br />
P440 ERT 13,024 16,100 11,989 16,100 0 -<br />
7,081,869 8,001,600 7,779,880 8,313,200 311,600 3.9<br />
City Watch<br />
A551 City Watch 131,608 121,760 88,452 124,800 3,040 2.5<br />
131,608 121,760 88,452 124,800 3,040 2.5<br />
Public Safety<br />
E123 Comm. Response 244,090 261,700 142,106 342,400 80,700 30.8<br />
E126 Grant Funded Projects 791 0 0 0 0 -<br />
P365 Accidents 186,404 194,400 145,955 163,600 (30,800) (15.8)<br />
P430 Victim Service 143,317 188,300 199,561 206,400 18,100 9.6<br />
P480 CR/CP 1,031,102 824,600 1,629,127 860,000 35,400 4.3<br />
P485 Traffic 676,676 851,300 733,150 829,100 (22,200) (2.6)<br />
2,413,987 2,442,060 2,938,351 2,526,300 84,240 3.4<br />
Operations Division 47,798,048 48,962,360 50,349,338 51,732,430 2,770,070 5.7<br />
Locked Police Services<br />
P510 LockSuperintendent's 73 0 0 0 0 -<br />
P305 LockSuperintendent's 793 0 0 0 0 -<br />
P260 Locked Warrants Exec 234 0 0 0 0 -<br />
P215 Locked Secondments 349 0 0 0 0 -<br />
1,448 0 0 0 0 -<br />
Total $71,973,994 $74,949,140 $76,280,055 $78,173,889 $3,224,749 4.3<br />
L16
<strong>Halifax</strong> <strong>Regional</strong> <strong>Municipality</strong> Police Services<br />
Summary of Gross Revenue by Division<br />
2008-2009 2009-2010 2009-2010 2010-2011 Change over<br />
Actual Budget Projections Budget Budget Var as %<br />
Executive Office<br />
P130 Facilities & Prop. 270 0 (268) 0 0 -<br />
P255 Exhibits & Property (284) 0 (1,094) 0 0 -<br />
P270 Commissionaires (36,702) (30,700) (30,700) (30,700) 0 -<br />
P370 <strong>Book</strong>ing (102,647) (103,000) (103,000) (103,000) 0 -<br />
(139,363) (133,700) (135,062) (133,700) 0 -<br />
Chief's Division<br />
P105 Chief's Office (67,254) 0 (301,039) 0 0 -<br />
P110 Professional Stds (1,037) (60,000) 0 60,000 (100.0)<br />
P120 Public Affairs (2,049) 0 0 0 0 -<br />
(70,339) (60,000) (301,039) 0 60,000 (100.0)<br />
Chief's Office (209,702) (193,700) (436,101) (133,700) 60,000 (31.0)<br />
Deputy Operational Support<br />
P205 Superintendent's Off (155,008) (167,200) (176,997) (167,200) 0 -<br />
P208 Back Check (160,997) (308,400) (496,107) (308,400) 0 -<br />
(316,005) (475,600) (673,104) (475,600) 0 -<br />
Support Division<br />
P225 Training (32,355) 0 (16,431) 0 0 -<br />
P245 Court Officers (1,850) 0 (1,804) 0 0 -<br />
P265 Records (288,246) (234,000) (225,608) (271,000) (37,000) 15.8<br />
(322,451) (234,000) (243,843) (271,000) (37,000) 15.8<br />
Initiatives<br />
S110 General Manager's Of 30 0 0 0 0 -<br />
S120 Comm. Proj. Admin. (30) 0 0 0 0 -<br />
S241 Paper Recycling (234,092) (235,000) (228,600) (235,000) 0 -<br />
S242 Enviro Depot (578,018) (570,000) (575,000) (575,000) (5,000) 0.9<br />
S243 By Law Remedies (693) (500) 0 (500) 0 -<br />
S244 Organic Carts (73,771) (80,000) (65,000) (70,000) 10,000 (12.5)<br />
(886,574) (885,500) (868,600) (880,500) 5,000 (0.6)<br />
Operations<br />
S210 Operation's Adm (13,661) (12,000) (14,250) (15,000) (3,000) 25.0<br />
(900,234) (897,500) (882,850) (895,500) 2,000 (0.2)<br />
Contractual Services<br />
S320 Animal control (147,931) (150,000) (167,900) (150,000) 0 -<br />
S330 Taxi & Limousine (181,784) (165,000) (162,500) (165,000) 0 -<br />
(329,715) (315,000) (330,400) (315,000) 0 -<br />
Community Standards<br />
S410 By-Law Services Adm (22) 0 0 0 0 -<br />
(22) 0 0 0 0 -<br />
Contracted Services<br />
P460 Sch. Crossing Guard (24,204) (27,700) (27,700) (27,700) 0 -<br />
(24,204) (27,700) (27,700) (27,700) 0 -<br />
Community Projects & Bylaw (1,254,176) (1,240,200) (1,240,950) (1,238,200) 2,000 (0.2)<br />
Administration<br />
P220 Human Resources (6,342) 0 (250) 0 0 -<br />
P230 Finance (149) 0 0 0 0 -<br />
P235 Extra Duty (400,263) (412,400) (409,369) (412,400) 0 -<br />
P240 SOTS (116,387) (94,500) (99,642) (139,500) (45,000) 47.6<br />
(523,141) (506,900) (509,261) (551,900) (45,000) 8.9<br />
Emergency 911 Communications<br />
A450 Integrated Emerg Srv (100,950) 0 (30,042) 0 0 -<br />
(100,950) 0 (30,042) 0 0 -<br />
L17
<strong>Halifax</strong> <strong>Regional</strong> <strong>Municipality</strong> Police Services<br />
Summary of Gross Revenue by Division (continued)<br />
2008-2009 2009-2010 2009-2010 2010-2011 Change over<br />
Actual Budget Projections Budget Budget Var as %<br />
Integrated Emergency Service (100,950) 0 (30,042) 0 0 -<br />
Operational Support (2,516,723) (2,456,700) (2,697,200) (2,536,700) (80,000) 3.3<br />
Deputy Operations<br />
P405 Deputy Operations (76,353) 0 (6,197) 0 0 -<br />
(76,353) 0 (6,197) 0 0 -<br />
Criminal Investigations Divi<br />
P316 CID (3,280,767) (3,903,900) (3,919,117) (3,956,300) (52,400) 1.3<br />
P325 Identification (30,526) 0 (89,994) (90,000) (90,000) -<br />
P335 Special Enforcement 0 (29,254) (162,800) (162,800) -<br />
P340 Criminal Intel Unit (124,111) 0 (45,547) (91,000) (91,000) -<br />
P360 GIS (123,443) 0 (69,321) (387,600) (387,600) -<br />
P375 Major Crime (3,770) 0 (1,016) (181,900) (181,900) -<br />
(3,562,617) (3,903,900) (4,154,249) (4,869,600) (965,700) 24.7<br />
Operations Central<br />
P410 Shared Resources 0 (45,900) (151,192) (151,200) (105,300) 229.4<br />
P415 Central (30,505) 0 (123,877) (352,200) (352,200) -<br />
P465 Mounted (60) 0 0 0 0 -<br />
P470 Port's Policing (1,908,921) (1,962,200) (2,307,096) (452,900) 1,509,300 (76.9)<br />
P475 QRU 0 0 0 (135,600) (135,600) -<br />
(1,939,486) (2,008,100) (2,582,165) (1,091,900) 916,200 (45.6)<br />
Operations East<br />
P425 East 0 0 (5,236) (61,300) (61,300) -<br />
0 0 (5,236) (61,300) (61,300) -<br />
Operations West<br />
P420 West (3,705) 0 0 (275,700) (275,700) -<br />
(3,705) 0 0 (275,700) (275,700) -<br />
City Watch<br />
A551 City Watch (10,000) (5,000) (10,065) (5,000) 0 -<br />
(10,000) (5,000) (10,065) (5,000) 0 -<br />
Public Safety<br />
E123 Comm. Response (788) 0 0 0 0 -<br />
E126 Grant Funded Projects (791) 0 0 0 0 -<br />
P430 Victim Service (33,750) 0 (6,833) (45,000) (45,000) -<br />
P480 CR/CP (7,750) 0 (10,943) 0 0 -<br />
(53,079) (5,000) (27,841) (50,000) (45,000) 900.0<br />
Operations Division (5,635,240) (5,917,000) (6,775,688) (6,348,500) (431,500) 7.3<br />
Total (8,361,665) (8,567,400) (9,908,989) (9,018,900) (451,500) 5.3<br />
L18
<strong>Halifax</strong> <strong>Regional</strong> <strong>Municipality</strong> Police Services<br />
Summary of Net Expenditures by Division<br />
2008-2009 2009-2010 2009-2010 2010-2011 Change over<br />
Actual Budget Projections Budget Budget Var as %<br />
Executive Office<br />
P125 Audit & Planning 301,446 340,300 381,868 349,900 9,600 2.8<br />
P130 Facilities & Prop. 242,473 147,800 191,722 81,000 (66,800) (45.2)<br />
P255 Exhibits & Property 440,440 351,000 478,428 347,770 (3,230) (0.9)<br />
P270 Commissionaires 1,392,640 1,270,600 1,278,462 1,298,500 27,900 2.2<br />
P310 R.A.P.I.D. 15,954 71,800 28,763 71,600 (200) (0.3)<br />
P311 Projects Unit 186,720 268,600 334,202 434,800 166,200 61.9<br />
P315 Inves. Call BackUnit 260,621 230,700 213,072 255,000 24,300 10.5<br />
P370 <strong>Book</strong>ing 464,779 475,100 497,207 521,900 46,800 9.9<br />
3,305,073 3,155,900 3,403,724 3,360,470 204,570 6.5<br />
Chief's Division<br />
P105 Chief's Office 1,005,061 1,228,040 626,962 1,235,800 7,760 0.6<br />
P110 Professional Stds 129,318 59,500 121,531 119,400 59,900 100.7<br />
P120 Public Affairs 388,067 381,300 440,224 351,390 (29,910) (7.8)<br />
P135 Board Of Police Comm 9,720 7,000 9,037 7,000 0 -<br />
1,532,165 1,675,840 1,197,754 1,713,590 37,750 2.3<br />
Chief's Office 4,837,238 4,831,740 4,601,478 5,074,060 242,320 5.0<br />
Deputy Operational Support<br />
P115 Legal 122,406 135,000 290,243 135,000 0 -<br />
P205 Superintendent's Off 246,994 316,200 258,169 322,800 6,600 2.1<br />
P208 Back Check (15,456) (108,553) (2,000) (2,000) -<br />
353,944 451,200 439,859 455,800 4,600 1.0<br />
Support Division<br />
P225 Training 877,589 909,300 1,055,804 743,288 (166,012) (18.3)<br />
P245 Court Officers 1,019,093 997,600 1,106,465 1,024,800 27,200 2.7<br />
P265 Records 210,516 349,800 399,090 340,200 (9,600) (2.7)<br />
2,107,198 2,256,700 2,561,359 2,108,288 (148,412) (6.6)<br />
General Administration<br />
S110 General Manager's Of 107,523 118,800 138,850 136,030 17,230 14.5<br />
S120 Comm. Proj. Admin. 176,916 289,800 204,200 245,100 (44,700) (15.4)<br />
284,438 408,600 343,050 381,130 (27,470) (6.7)<br />
Facilities/Buildings<br />
S231 947 Mitchell 34,660 31,600 51,250 38,000 6,400 20.3<br />
S232 1300 St Margaret's B 11,936 17,600 17,750 18,900 1,300 7.4<br />
S233 3790 MacKintosh 1,151 0 0 0 0 -<br />
47,747 49,200 69,000 56,900 7,700 15.7<br />
Initiatives<br />
S241 Paper Recycling (16,774) 1,100 (6,900) (24,637) (25,737) (2,339.7)<br />
S242 Enviro Depot (2,970) 43,900 62,900 221,400 177,500 404.3<br />
S243 By Law Remedies 244,697 333,200 275,220 92,900 (240,300) (72.1)<br />
S244 Organic Carts (5,572) (4,300) 13,050 81,900 86,200 (2,004.7)<br />
219,381 373,900 344,270 371,563 (2,337) (0.6)<br />
Operations<br />
S210 Operation's Adm 271,571 268,700 282,400 271,810 3,110 1.2<br />
S220 Trucking/Fleet serv 93,442 114,600 100,100 104,900 (9,700) (8.5)<br />
632,142 806,400 795,770 805,173 (1,227) (0.2)<br />
Contractual Services<br />
S310 Contractual Serv Adm 201,383 287,800 253,500 296,900 9,100 3.2<br />
S320 Animal control 699,105 808,900 768,050 840,300 31,400 3.9<br />
S330 Taxi & Limousine (215) 20,300 29,650 20,000 (300) (1.5)<br />
L19
<strong>Halifax</strong> <strong>Regional</strong> <strong>Municipality</strong> Police Services<br />
Summary of Net Expenditures by Division (continued)<br />
2008-2009 2009-2010 2009-2010 2010-2011 Change over<br />
Actual Budget Projections Budget Budget Var as %<br />
900,273 1,117,000 1,051,200 1,157,200 40,200 3.6<br />
Community Standards<br />
S410 By-Law Services Adm 343,134 410,500 328,350 449,700 39,200 9.5<br />
S420 By-Law Serv.Enforce. 647,429 698,200 672,560 731,700 33,500 4.8<br />
990,563 1,108,700 1,000,910 1,181,400 72,700 6.6<br />
Contracted Services<br />
P460 Sch. Crossing Guard 1,245,639 1,523,900 1,427,850 1,481,300 (42,600) (2.8)<br />
P463 Park Patrol 108 0 0 0 0 -<br />
1,245,747 1,523,900 1,427,850 1,481,300 (42,600) (2.8)<br />
Community Projects & Bylaw 4,053,163 4,964,600 4,618,780 5,006,203 41,603 0.8<br />
Administration<br />
P210 EAP 89,027 95,100 109,661 114,700 19,600 20.6<br />
P220 Human Resources 458,843 272,400 521,071 538,500 266,100 97.7<br />
P230 Finance 507,967 478,700 531,558 492,800 14,100 2.9<br />
P235 Extra Duty (105,928) 35,600 48,972 38,300 2,700 7.6<br />
P240 SOTS 358,017 415,800 448,924 323,600 (92,200) (22.2)<br />
P250 Fleet Maintenance 1,875,481 1,859,900 1,815,100 1,701,264 (158,636) (8.5)<br />
3,183,406 3,157,500 3,475,286 3,209,164 51,664 1.6<br />
Emergency 911 Communications<br />
A450 Integrated Emerg Srv 5,720,530 6,420,540 6,024,526 6,617,200 196,660 3.1<br />
A452 Eric Spicer-Operatio 177,362 193,400 183,511 193,400 0 -<br />
5,897,892 6,613,940 6,208,037 6,810,600 196,660 3.0<br />
Dispatch<br />
N711 Dispatch Centre 36,173 77,800 43,678 77,800 0 -<br />
36,173 77,800 43,678 77,800 0 -<br />
Police<br />
N721 HRP 362,858 366,700 301,794 412,944 46,244 12.6<br />
362,858 366,700 301,794 412,944 46,244 12.6<br />
Fire<br />
N731 Core Fire & EMO 157,600 157,600 654 157,600 0 -<br />
N732 Rural Fire 458,600 458,600 544,746 458,600 0 -<br />
616,200 616,200 545,400 616,200 0 -<br />
Non-Emergency<br />
N742 Transit 0 0 1,745 0 0 -<br />
0 0 1,745 0 0 -<br />
Integrated Dispatch Communic 1,015,230 1,060,700 892,617 1,106,944 46,244 4.4<br />
Integrated Emergency Service 6,913,122 7,674,640 7,100,654 7,917,544 242,904 3.2<br />
Operational Support 16,610,834 18,504,640 18,195,938 18,696,999 192,359 1.0<br />
Deputy Operations<br />
P405 Deputy Operations 1,007,900 988,100 896,539 1,053,500 65,400 6.6<br />
1,007,900 988,100 896,539 1,053,500 65,400 6.6<br />
L20
<strong>Halifax</strong> <strong>Regional</strong> <strong>Municipality</strong> Police Services<br />
Summary of Net Expenditures by Division (continued)<br />
2008-2009 2009-2010 2009-2010 2010-2011 Change over<br />
Actual Budget Projections Budget Budget Var as %<br />
Criminal Investigations Divi<br />
P312 SES Technical Unit 294,589 214,500 297,150 224,600 10,100 4.7<br />
P313 VICLAS 103,592 111,700 113,633 115,000 3,300 3.0<br />
P314 Computer Forensics 186,587 181,000 206,924 191,100 10,100 5.6<br />
P316 CID (96,116) (851,200) (512,130) (6,270) 844,930 (99.3)<br />
P317 CATS Clearing Account 1,361,935 (268,700) (268,700) (5,100) 263,600 (98.1)<br />
P320 Polygraph 767 169,200 183,140 188,000 18,800 11.1<br />
P325 Identification 1,481,700 1,517,600 1,442,078 1,410,490 (107,110) (7.1)<br />
P330 Fraud Unit 1,057,392 1,041,000 1,075,539 1,070,800 29,800 2.9<br />
P335 Special Enforcement 1,253,680 1,209,700 1,506,920 1,019,400 (190,300) (15.7)<br />
P340 Criminal Intel Unit 822,961 814,200 970,929 766,300 (47,900) (5.9)<br />
P345 Vice 959,811 432,200 725,551 406,500 (25,700) (5.9)<br />
P355 Crime Stoppers 33 0 0 0 0 -<br />
P360 GIS 4,018,696 3,332,700 4,253,319 2,850,000 (482,700) (14.5)<br />
P375 Major Crime 3,017,969 2,567,100 2,898,292 2,620,910 53,810 2.1<br />
P380 Crime Analysis 216,987 268,200 277,388 275,400 7,200 2.7<br />
14,680,584 10,739,200 13,170,033 11,127,130 387,930 3.6<br />
Operations Central<br />
P410 Shared Resources 1,580,035 1,128,700 1,596,061 1,055,300 (73,400) (6.5)<br />
P415 Central 7,531,272 9,608,100 7,998,335 9,838,500 230,400 2.4<br />
P435 Canine 5,968 20,600 30,238 20,600 0 -<br />
P445 Marine 66,726 53,300 67,677 53,300 0 -<br />
P455 Bike Patrol 14,106 6,000 4,212 6,000 0 -<br />
P465 Mounted 19,889 8,200 12,678 8,200 0 -<br />
P470 Port's Policing (1,613,908) (1,629,400) (1,906,647) (119,500) 1,509,900 (92.7)<br />
P475 QRU 2,094,752 2,021,100 2,358,885 1,825,800 (195,300) (9.7)<br />
9,698,840 11,216,600 10,161,439 12,688,200 1,471,600 13.1<br />
Operations East<br />
P425 East 7,323,590 9,652,600 8,650,118 9,991,100 338,500 3.5<br />
P450 Public Safety Unit 12,823 10,200 5,131 10,200 0 -<br />
7,336,412 9,662,800 8,655,249 10,001,300 338,500 3.5<br />
Operations West<br />
P420 West 7,065,140 7,985,500 7,767,891 8,021,400 35,900 0.4<br />
P440 ERT 13,024 16,100 11,989 16,100 0 -<br />
7,078,164 8,001,600 7,779,880 8,037,500 35,900 0.4<br />
City Watch<br />
A551 City Watch 121,608 116,760 78,387 119,800 3,040 2.6<br />
121,608 116,760 78,387 119,800 3,040 2.6<br />
Public Safety<br />
E123 Comm. Response 243,302 261,700 142,106 342,400 80,700 30.8<br />
P365 Accidents 186,404 194,400 145,955 163,600 (30,800) (15.8)<br />
P430 Victim Service 109,567 188,300 192,728 161,400 (26,900) (14.3)<br />
P480 CR/CP 1,023,351 824,600 1,618,184 860,000 35,400 4.3<br />
P485 Traffic 676,676 851,300 733,150 829,100 (22,200) (2.6)<br />
2,360,908 2,437,060 2,910,510 2,476,300 39,240 1.6<br />
Operations Division 42,162,808 43,045,360 43,573,650 45,383,930 2,338,570 5.4<br />
Locked Police Services<br />
P510 LockSuperintendent's 73 0 0 0 0 -<br />
P305 LockSuperintendent's 793 0 0 0 0 -<br />
P260 Locked Warrants Exec 234 0 0 0 0 -<br />
P215 Locked Secondments 349 0 0 0 0 -<br />
1,448 0 0 0 0 -<br />
Total $63,612,329 $66,381,740 $66,371,066 $69,154,989 $2,773,249 4.2<br />
L21
<strong>Halifax</strong> <strong>Regional</strong> <strong>Municipality</strong> Police Services<br />
Summary by Expenditure & Revenue Types<br />
2008-2009 2009-2010 2009-2010 2010-2011 Change over<br />
Actual Budget Projections Budget Budget Var as %<br />
Expenditures<br />
Compensation & Benefits 60,975,322 65,863,200 66,324,305 69,303,473 3,440,273 5.2<br />
Office 918,629 785,300 923,143 714,290 (71,010) (9.0)<br />
Professional Fees 658 0 0 0 0 -<br />
Legal & Consulting Fees 140,513 135,000 307,633 135,000 0 -<br />
External Services 2,498,311 2,277,400 2,494,268 1,947,200 (330,200) (14.5)<br />
Uniforms & Clothing 275,566 287,300 362,644 282,300 (5,000) (1.7)<br />
Supplies & Materials 332,526 239,100 323,212 231,070 (8,030) (3.4)<br />
Utilities 30,679 23,400 30,260 25,500 2,100 9.0<br />
Building Costs 343,773 69,400 180,954 76,700 7,300 10.5<br />
Equipment & Communications 1,452,665 1,391,600 1,120,243 1,438,644 47,044 3.4<br />
Vehicle Expense 247,777 205,900 286,796 204,200 (1,700) (0.8)<br />
Travel 314,865 177,500 263,670 133,598 (43,902) (24.7)<br />
Training & Education 212,574 258,400 165,989 256,400 (2,000) (0.8)<br />
Facilities Rental 581,642 488,300 624,868 673,130 184,830 37.9<br />
Advertising & Promotion 28,730 32,900 41,253 27,090 (5,810) (17.7)<br />
Other Goods & Services 605,939 312,640 329,208 578,430 265,790 85.0<br />
Interdepartmental 2,138,197 1,979,000 2,086,178 1,732,864 (246,136) (12.4)<br />
Insurance Costs 73,731 79,100 71,731 79,100 0 -<br />
Transfer to/from Reserves 801,897 343,700 343,700 343,700 0 -<br />
Other Fiscal 0 0 0 (8,800) (8,800) -<br />
Expenditures 71,973,994 74,949,140 76,280,055 78,173,889 3,224,749 4.3<br />
Total $71,973,994 $74,949,140 $76,280,055 $78,173,889 $3,224,749 4.3<br />
Revenues<br />
Tax Revenues (2,100) (2,600) (2,600) (2,600) 0 -<br />
Area Rate Revenue (21,947) (24,900) (24,900) (24,900) 0 -<br />
Fines and Fees (152,387) (164,900) (176,908) (164,900) 0 -<br />
Licenses & Permits (329,715) (315,000) (330,400) (315,000) 0 -<br />
Sales Revenue (1,215,002) (1,119,500) (1,120,417) (1,206,500) (87,000) 7.8<br />
Other Revenue (6,640,515) (6,940,500) (8,253,764) (7,305,000) (364,500) 5.3<br />
Revenues (8,361,665) (8,567,400) (9,908,989) (9,018,900) (451,500) 5.3<br />
Total (8,361,665) (8,567,400) (9,908,989) (9,018,900) (451,500) 5.3<br />
Net Cost $63,612,329 $66,381,740 $66,371,066 $69,154,989 $2,773,249 4.2<br />
L22
RCMP<br />
Summary of Gross Expenditures by Division<br />
2008-2009 2009-2010 2009-2010 2010-2011 Change over<br />
Actual Budget Projections Budget Budget Var as %<br />
RCMP<br />
P710 RCMP 19,282,520 20,353,100 20,300,900 20,625,700 272,600 1.3<br />
19,282,520 20,353,100 20,300,900 20,625,700 272,600 1.3<br />
Total $19,282,520 $20,353,100 $20,300,900 $20,625,700 $272,600 1.3<br />
Summary of Gross Revenue by Division<br />
2008-2009 2009-2010 2009-2010 2010-2011 Change over<br />
Actual Budget Projections Budget Budget Var as %<br />
RCMP<br />
P710 RCMP (771) 0 0 0 0 -<br />
(771) 0 0 0 0 -<br />
Total (771) 0 0 0 0 -<br />
Summary of Net Expenditures by Division<br />
2008-2009 2009-2010 2009-2010 2010-2011 Change over<br />
Actual Budget Projections Budget Budget Var as %<br />
RCMP<br />
P710 RCMP 19,281,749 20,353,100 20,300,900 20,625,700 272,600 1.3<br />
19,281,749 20,353,100 20,300,900 20,625,700 272,600 1.3<br />
Total $19,281,749 $20,353,100 $20,300,900 $20,625,700 $272,600 1.3<br />
Summary by Expenditure & Revenue Types<br />
2008-2009 2009-2010 2009-2010 2010-2011 Change over<br />
Actual Budget Projections Budget Budget Var as %<br />
Expenditures<br />
Office 750 0 0 0 0 -<br />
External Services 19,281,770 20,353,100 20,300,900 20,625,700 272,600 1.3<br />
Expenditures 19,282,520 20,353,100 20,300,900 20,625,700 272,600 1.3<br />
Total $19,282,520 $20,353,100 $20,300,900 $20,625,700 $272,600 1.3<br />
Revenues<br />
Fines and Fees (207) 0 0 0 0 -<br />
Other Revenue (564) 0 0 0 0 -<br />
Revenues (771) 0 0 0 0 -<br />
Total (771) 0 0 0 0 -<br />
Net Cost $19,281,749 $20,353,100 $20,300,900 $20,625,700 $272,600 1.3<br />
L23
<strong>Halifax</strong> <strong>Regional</strong> <strong>Municipality</strong><br />
2010/11 Business Plans and Budget (Proposed) Infrastructure and Asset Management<br />
Infrastructure and<br />
Asset Management<br />
Business Plan - 2010/11
<strong>Halifax</strong> <strong>Regional</strong> <strong>Municipality</strong><br />
2010/11 Business Plans and Budget (Proposed) Infrastructure and Asset Management<br />
Mission: To work with HRM’s citizens to plan and build sustainable infrastructure for a<br />
better tomorrow.<br />
Business Unit Overview:<br />
Infrastructure and Asset Management (IAM) plays the lead role in coordination of HRM’s<br />
infrastructure related services by providing a structured corporate focus on asset management.<br />
By working closely with Council, all business units and various external stakeholders, IAM<br />
develops policy and long range plans in support of financial and environmental sustainability of<br />
infrastructure and assets that support the delivery of municipal services to the residents of HRM.<br />
Director:<br />
Director’s Office<br />
Sustainable<br />
Environment<br />
Management Office<br />
(SEMO)<br />
Richard MacLellan –<br />
Manager<br />
Real Property Planning<br />
Peter Bigelow – Manager<br />
Facility Development<br />
Terry Gallagher -<br />
Manager<br />
Design and<br />
Construction<br />
David Hubley - Manager<br />
Phillip Townsend<br />
The Director’s Office provides oversight and coordinated<br />
management to ensure IAM functions in accordance with HRM<br />
business policies and in a manner consistent with approved<br />
Community Outcomes, Council Focus Areas and EMT Priorities<br />
This division delivers corporate strategic leadership, coordination,<br />
innovation and policy development promoting the environmental<br />
sustainability of HRM Infrastructure and HRM’s stewardship of<br />
the natural environment (clean air, land, water and energy)<br />
This division delivers land use policy, conceptual parks design,<br />
open space master planning and strategic support for land<br />
acquisition and disposal of HRM owned property. The division<br />
also coordinates the planning and development of community and<br />
regional trails throughout HRM<br />
This division plans and delivers capital projects for all HRM’s<br />
buildings, parks and parkland on behalf of client business units. In<br />
addition, this division provides building and park related design<br />
and construction services in support of HRM’s corporate and/or<br />
program initiatives<br />
This division delivers a range of professional and technical<br />
services including surveying, engineering design, construction<br />
inspection, infrastructure management and record management<br />
with respect to capital roadway asset projects<br />
M2
<strong>Halifax</strong> <strong>Regional</strong> <strong>Municipality</strong><br />
2010/11 Business Plans and Budget (Proposed) Infrastructure and Asset Management<br />
Infrastructure Planning<br />
Peter Duncan - Manager<br />
Summary of Business<br />
Unit Structure Changes:<br />
This division provides dedicated resources that will use Asset<br />
Management principles to develop five-year infrastructure<br />
recapitalization and capability plans. In addition, this division<br />
administers the Capital Cost Contribution Program<br />
During the 2009/10 business cycle, Strategic Transportation<br />
Planning was administered by IAM. However, the majority of this<br />
division’s services were closely inter-connected to transit and<br />
transportation functions delivered through Transportation and<br />
Public Works (TPW). As a result, the Strategic Transportation<br />
Planning division has been re-aligned with TPW. Some functions<br />
relating to transportation asset life cycle management,<br />
infrastructure renewal strategies and funding program<br />
management have been retained by IAM and will be delivered<br />
through the Infrastructure Planning Division<br />
Core Operations and Services provided:<br />
Policy development, strategic planning and design and construction services with respect to<br />
HRM Infrastructure and major corporate assets including, but not limited to:<br />
• 1,760 kms of public road and rights of way totalling 4900 hectares of property<br />
• 847 kms of sidewalk<br />
• 2090 kms of curb<br />
• 87 Bridges<br />
• 844 Public Parks<br />
• 1957 parcels of Public Open Space<br />
• 371 playgrounds, 190 ball fields, 113 general sports fields, 304 sport courts (sport court,<br />
basketball & tennis), 12 skateboard parks, 7 bike parks, 3 outdoor pools and 4 spray<br />
pools<br />
• Over 12,000 hectares of HRM owned property<br />
• 283 HRM owned buildings<br />
• 257 additional buildings containing a municipal interest<br />
Survey, civil engineering design, project management and inspection services in support of<br />
corporate infrastructure initiatives related to HRM owned and managed roads, parks,<br />
playgrounds, buildings and property<br />
Promotion of sustainable infrastructure planning and stewardship of the natural environment<br />
through a range of initiatives and programs such as HRM’s Pesticide By-Law, the nonrecreational<br />
Lake Water Monitoring Program, HRM facility environmental assessments,<br />
measurements of environmental impacts on HRM infrastructure and maintenance of greenhouse<br />
gas (GHG) inventories<br />
M3
<strong>Halifax</strong> <strong>Regional</strong> <strong>Municipality</strong><br />
2010/11 Business Plans and Budget (Proposed) Infrastructure and Asset Management<br />
Capital planning for new infrastructure development in accordance with Council’s approved<br />
Focus Areas, EMT Priorities and various approved community planning documents such as the<br />
<strong>Regional</strong> Plan<br />
Comprehensive asset management programs including oversight for the Corporate Asset<br />
Management Project and the Capital Cost Contribution (CCC) Project<br />
Development of recapitalization strategies to maximize the benefit and minimize risks associated<br />
with the ongoing use of existing HRM infrastructure and major capital assets<br />
Leveraging of funds available from other levels of government to ensure maximum levels of<br />
infrastructure related services with a minimum direct cost to residents<br />
Strategic advice and support for land acquisition and disposal of HRM owned property<br />
Policy and planning relative to the development and maintenance of outdoor facilities and trails<br />
systems throughout HRM<br />
Policy, planning, and project management relative to the development of new and/or expanded<br />
HRM owned buildings and facilities<br />
Funded Full Time Equivalents (FTEs):<br />
Funded FTEs (includes<br />
permanent and temporary)<br />
2008/09 2009/10 2010/11<br />
(Approved) (Approved) (Proposed)<br />
106 109 114<br />
Analysis of <strong>Operating</strong> Budget Changes:<br />
<strong>Operating</strong> Budget Change Details<br />
($000's)<br />
2009/10 Budget 8,116<br />
1 Increase in Compensation and Benefits 468.2<br />
2 Increase in <strong>Operating</strong> cost of capital projects 73<br />
3 Increase in funding from capital -226.1<br />
4 Decrease in ‘across the board reductions’ -78<br />
5 Decrease to Pesticide by-law enforcement education -60<br />
6 Decrease to vehicle use -10<br />
2010/11 Budget 8,283.1<br />
M4
<strong>Halifax</strong> <strong>Regional</strong> <strong>Municipality</strong><br />
2010/11 Business Plans and Budget (Proposed) Infrastructure and Asset Management<br />
Key Challenges and Opportunities<br />
The following challenges and opportunities will have an impact on the business unit in the 2010-<br />
2015 time frame.<br />
Challenges with Community-Wide Impact:<br />
• Aging Infrastructure: The condition of HRM’s infrastructure and major assets is<br />
deteriorating while at the same time, the organization’s ability to fund the upkeep of these<br />
capital assets is decreasing. This issue is not only a key challenge but it is also one of the<br />
organizations greatest risks. Developing an appropriate response is the principle component<br />
of the business unit’s first three goals. This is a multi-year issue and a successful response<br />
must include a fundamental change in corporate and community culture with respect to<br />
management and funding of public infrastructure.<br />
• General Economic Uncertainty: Uncertainty with respect to the global and local economy<br />
is a significant impediment to effective decision making for IAM, HRM and the community<br />
as a whole. Short term impacts such as fluctuations in construction costs have a substantial<br />
impact on the effectiveness of capital project delivery. In the longer term, the current<br />
situation could have effects on flexibility of capital plans and funding capabilities with<br />
respect to management of public infrastructure.<br />
• Promotion of the Concept of Sustainability of Infrastructure and Developing Corporate<br />
and Community Environmental Stewardship: Understanding and support for these<br />
concepts is a fundamental component of the overall health of the community. Without a<br />
broad based corporate and public understanding and support for these concepts as primary<br />
decision making tools, the chances of reversing the deterioration of HRM’s infrastructure are<br />
greatly reduced. Increased awareness of this important element will ultimately result in<br />
improved environmental conditions, and a less expensive, more liveable community.<br />
• Developing the Business Unit’s Corporate and Community Profile: Infrastructure and<br />
Asset Management must develop a strong presence and high profile both corporately and<br />
within the community at large. It is important for the business unit to take adequate steps to<br />
build sound working relationships within HRM, with all of the organization’s external<br />
business partners and with all residents of HRM.<br />
• Climate Change: Impacts from extreme weather events driven by climate change are a<br />
significant risk to the life cycle of new infrastructure and the re-capitalization of existing<br />
infrastructure in HRM. While this may not represent a significant impact during the time<br />
frame represented by this business plan, incorporating emerging knowledge of climate<br />
change impacts into infrastructure planning activities is of substantial importance and will be<br />
a key challenge in the future.<br />
M5
<strong>Halifax</strong> <strong>Regional</strong> <strong>Municipality</strong><br />
2010/11 Business Plans and Budget (Proposed) Infrastructure and Asset Management<br />
Challenges with Service Delivery / Business Unit Impact<br />
• Succession Planning: A significant number of key staff members are eligible for retirement<br />
within the time frame of this plan. In addition, the competitive nature of the marketplace is<br />
such that key personnel are at a higher risk of leaving the organization for other opportunities.<br />
The business unit’s ability to retain these people or find qualified replacements will have a<br />
substantial impact on service capability.<br />
• Balancing Resources and Service Expectations: There is a disparity between the public’s<br />
expectations and the capability of the organization to provide the expected service with<br />
existing resource levels. While this situation is not uncommon in public service, there are<br />
three significant elements that are contributing to a growing gap between service expectations<br />
and capability in IAM:<br />
a) During recent years, HRM has made great strides in developing a series of strategic plans<br />
that have received significant public support. Carrying out many of the initiatives in those<br />
plans is a significant challenge to HRM and particularly to IAM’s operational resources;<br />
b) Due to the recent availability of significant amounts of infrastructure related stimulus<br />
funding, IAM is charged with the delivery of capability capital projects at a volume that<br />
exceeds operational capacity given existing resources. It is anticipated this level of capability<br />
project work will remain constant in the short term but decrease in the medium to long term<br />
as stimulus projects are completed over the next few years. Providing short term resource<br />
capacity that meets demand without creating long term capacity that exceeds anticipated<br />
future demand is a significant challenge.<br />
c) The business unit’s capacity to meet service expectations based on current demand is<br />
already strained. This imbalance is increased when unplanned and unfunded project requests<br />
are received during the business cycle. Successfully integrating unplanned service requests<br />
into the department’s operational plan is becoming a greater challenge as capacity remains<br />
constant and demand increases.<br />
M6
<strong>Halifax</strong> <strong>Regional</strong> <strong>Municipality</strong><br />
2010/11 Business Plans and Budget (Proposed) Infrastructure and Asset Management<br />
Business Unit Goals<br />
The goals for Infrastructure and Asset Management are:<br />
Goal 1:<br />
Goal 2:<br />
Goal 3:<br />
Goal 4:<br />
Goal 5:<br />
Goal 6:<br />
Goal 7:<br />
Goal 8:<br />
Long Range Capital Planning<br />
Asset Management Program Development<br />
Infrastructure Related Policy Development<br />
Environmental Sustainability Promotion<br />
Establishment of HRM as an Employer of Choice<br />
Efficient Capital Project Delivery<br />
Effective External Communications<br />
Internal Partnership / Collaboration Requirements<br />
Goal 1:<br />
Long Range Capital Planning<br />
Corporate Strategy Linkage:<br />
Council Focus Area: Infrastructure<br />
EMT Priority: Fiscal Responsibility<br />
Description:<br />
The condition of HRM=s infrastructure and major capital assets is deteriorating while the ability<br />
to adequately fund upkeep and replacement is decreasing. This trend has been exacerbated<br />
during the 2009/10 business cycle with the addition of significant amounts of unexpected<br />
capability project work related to infrastructure stimulus funding. This has diverted short term<br />
capital budget resources toward capability projects at the expense of badly needed base recapitalization<br />
work. In order to achieve sustainability and reverse this trend, comprehensive long<br />
range capital plans with an increased focus on base re-capitalization are required. The business<br />
unit began the process of developing these plans during the 08/09 business cycle and that process<br />
will be continued and expanded during the 10/11 cycle.<br />
Goal 1:<br />
Long Range Capital Planning<br />
Objectives for 2010/2011:<br />
IAM 1.1<br />
IAM 1.2<br />
Develop strategies to re-align capital spending programs to provide a greater<br />
emphasis on re-capitalization and a reduced component of capability projects<br />
Develop a comprehensive long term capital needs assessment<br />
IAM 1.3 Ensure all individual HRM infrastructure projects funded through the gas tax<br />
program are in compliance with the approval criteria attached to the funds<br />
Objectives for the next 3-5 years:<br />
IAM 1.4 Complete development of a 20-year capital plan prior the end of the 2012<br />
business cycle identifying all major new capability project requirements<br />
M7
<strong>Halifax</strong> <strong>Regional</strong> <strong>Municipality</strong><br />
2010/11 Business Plans and Budget (Proposed) Infrastructure and Asset Management<br />
Goal 2:<br />
Asset Management Program Development<br />
Corporate Strategy Linkage:<br />
Council Focus Area: Infrastructure<br />
EMT Priorities: Fiscal Responsibility and Excellence in Service Delivery<br />
Description:<br />
Developing a strategic corporate Asset Management Program as opposed to simply accounting<br />
for consumption of goods and services, is crucial to the long term sustainability of HRM=s<br />
infrastructure and capital assets. New Public Sector Accounting Board of Canada (PSAB)<br />
requirements will be in place at the beginning of the 10/11 business cycle. IAM will utilize the<br />
comprehensive information collected in support of PSAB compliance as the foundation for<br />
corporate Asset Management planning to support the long term sustainability of HRM=s<br />
infrastructure and capital assets.<br />
Goal 2:<br />
Asset Management Program Development<br />
Objectives for 2010/2011:<br />
IAM 2.1 Configure the data collected for PSAB compliance so it can be used for Asset<br />
Management purposes.<br />
IAM 2.2 Develop a common asset condition scoring system that converts various complex<br />
asset class ratings into common reference terminology<br />
IAM 2.3 Continue condition reporting on roads, curbs, sidewalks and bridges and begin<br />
reporting on assets related to fleet and Waste Resources.<br />
IAM 2.4 Complete an initial condition screening assessment of facilities in conjunction<br />
with Risk and Insurance Services to determine priorities for more detailed<br />
assessment.<br />
IAM 2.5 Determine needs and specifications for Asset Management decision support<br />
software<br />
IAM 2.6 Improve street degradation management through cooperation with relevant<br />
stakeholders whose activities impact street conditions<br />
IAM 2.7 Work with <strong>Halifax</strong> Water and internal business units to develop a clear policy<br />
regarding ownership and management of the process to construct storm water<br />
systems in HRM<br />
IAM 2.8 Finalize bridge ownership and confirm the level of responsibilities on costshared<br />
components with the Province<br />
Objectives for the next 3-5 years:<br />
IAM 2.9<br />
IAM 2.10<br />
Continue the development of a systematic condition analysis/life cycle<br />
assessment program for infrastructure and major assets (including acquisition,<br />
maintenance and disposal of facilities).<br />
Continue the program to implement Asset Management based decision support<br />
software into the corporate capital planning process<br />
M8
<strong>Halifax</strong> <strong>Regional</strong> <strong>Municipality</strong><br />
2010/11 Business Plans and Budget (Proposed) Infrastructure and Asset Management<br />
IAM 2.11<br />
Develop a comprehensive draft Corporate Asset Management Plan for review<br />
and consideration by senior staff and Council<br />
Goal 3:<br />
Infrastructure Related Policy Development<br />
Corporate Strategy Linkage:<br />
Council Focus Area: Infrastructure<br />
EMT Priorities: Fiscal Responsibility and Excellence in Service Delivery<br />
Description:<br />
In addition to the medium and long term initiatives outlined in the first two goals, IAM is also<br />
closely involved in the development of infrastructure related policy and planning that supports<br />
on-going and short term initiatives. This includes a wide range of infrastructure related policy<br />
development, functional plans, and master planning exercises in support of approved Council<br />
objectives.<br />
Goal 3:<br />
Infrastructure Related Policy Development<br />
Objectives for 2010/2011:<br />
IAM 3.1<br />
IAM 3.2<br />
IAM 3.3<br />
IAM 3.4<br />
IAM 3.5<br />
IAM 3.6<br />
IAM 3.7<br />
IAM 3.8<br />
Advance the <strong>Regional</strong> Centre component of the Open Space Functional Plan<br />
Develop a secondary open space plan for the areas between Main St., Dartmouth,<br />
Cherry Brook, Cole Harbour and Cow Bay (Cole Harbour Marsh).<br />
Complete negotiations with the Province of Nova Scotia (PNS) for motorized<br />
and non-motorized trail use.<br />
In conjunction with Community Development (CD), complete an analysis in<br />
support of identification and protection of key view planes on the North West<br />
Arm<br />
Complete the Urban Forest Masterplan<br />
Participate in the five-year review of the <strong>Regional</strong> Plan<br />
Develop a recapitalization plan for HRM’s beaches<br />
Advance a rationalized infrastructure plan for the Capital District<br />
Objectives for the next 3-5 years:<br />
IAM 3.9<br />
Develop a policy around the level of capital investment and maintenance service<br />
levels that are to be applied to non-accepted streets and private roads<br />
M9
<strong>Halifax</strong> <strong>Regional</strong> <strong>Municipality</strong><br />
2010/11 Business Plans and Budget (Proposed) Infrastructure and Asset Management<br />
Goal 4:<br />
Environmental Sustainability Promotion<br />
Corporate Strategy Linkage:<br />
Council Focus Area: Infrastructure<br />
EMT Priorities: Fiscal Responsibility and Excellence in Service Delivery<br />
Description:<br />
While it is vital that the business unit develops practical long range capital plans and effective<br />
Asset Management strategies, it is equally important that environmental sustainability be a<br />
significant component of these initiatives. IAM will be focussed on the promotion of a culture of<br />
environmental sustainability corporately and within the community.<br />
Goal 4:<br />
Environmental Sustainability Promotion<br />
Objectives for 2010/2011:<br />
IAM 4.1<br />
IAM 4.2<br />
IAM 4.3<br />
IAM 4.4<br />
IAM 4.5<br />
IAM 4.6<br />
IAM 4.7<br />
IAM 4.8<br />
IAM 4.9<br />
IAM 4.10<br />
IAM 4.11<br />
IAM 4.12<br />
IAM 4.13<br />
IAM 4.14<br />
Reorganize the Corporate Sustainability Transition Team to a decentralized<br />
model for environmental sustainability and deliver an annual Corporate<br />
Sustainability Report<br />
Complete an update of the 2005 Corporate Sustainability Analysis<br />
Develop Strategic Partnership with Recreation Services and Planning Services<br />
for integration of environmental sustainability, urban design / <strong>Regional</strong> Centre,<br />
and Physical Activity Strategies<br />
Promote HRM’s position and engage with the Province of Nova Scotia regarding<br />
development of a provincial Water Strategy<br />
Develop a recommendation for 2020 and 2050 GHG reduction targets to the<br />
Energy and Underground Services Committee (EUGS) and <strong>Regional</strong> Council<br />
Continue engagement and education of <strong>Regional</strong> Council and organizational key<br />
influencers on issues related to sustainability<br />
Organize and chair the corporate climate change management steering committee<br />
Complete IAM contribution to the development of the environmentally based<br />
Hazard Management Functional Plan as set out in the <strong>Regional</strong> Plan<br />
Increase energy and fuel efficiency and reduce GHG for HRM facilities and fleet<br />
vehicles<br />
Promote and support legislative changes to require increased energy efficiency<br />
and reduced GHG emissions for all buildings and development in HRM<br />
Assist with the development of the HRM by Design Sustainability Plan<br />
Review potential budget capacity for climate change work by re-assessing the<br />
current contract provisions for delivery of Pesticide Bylaw related services<br />
Network and source other environmental funding opportunities<br />
Continue to review opportunities for implementation of alternative asphalt<br />
rehabilitation strategies with an emphasis on the feasibility of incorporating green<br />
recycling methodologies<br />
M10
<strong>Halifax</strong> <strong>Regional</strong> <strong>Municipality</strong><br />
2010/11 Business Plans and Budget (Proposed) Infrastructure and Asset Management<br />
Objectives for the next 3-5 years:<br />
IAM 4.15<br />
IAM 4.16<br />
IAM 4.18<br />
Build capacity for climate change adaptation work<br />
Provide project management support required to meet Environmental Goals and<br />
Sustainable Prosperity Act (EGSPA) and GHG Emission reduction commitments<br />
Revise HRM Water policy and strategy to complement the Provincial Water<br />
Strategy expected in late 2010<br />
Goal 5:<br />
Establishment of HRM as an Employer of Choice<br />
Corporate Strategy Linkage:<br />
Council Focus Area: Infrastructure<br />
EMT Priorities: Employer of Choice and Excellence in Service Delivery<br />
Description:<br />
Maintaining a well prepared, capable and professionally satisfied workforce is an essential<br />
element of successful service delivery. HRM has committed to the establishment of the<br />
organization as an A Employer of Choice@. IAM will be supporting this commitment by<br />
focussing on the continued development of the business unit as an attractive place for existing<br />
employees to remain and a desirable destination for new HRM employees.<br />
Goal 5:<br />
Establishment of HRM as an Employer of Choice<br />
Objectives for 2010/2011:<br />
IAM 5.1<br />
IAM 5.2<br />
IAM 5.3<br />
IAM 5.4<br />
IAM 5.5<br />
IAM 5.6<br />
IAM 5.7<br />
IAM 5.8<br />
Develop and implement a coordinated collaborative leadership approach to<br />
management of IAM<br />
Effectively communicate IAM=s Business Plan and <strong>Operating</strong> Plan to all<br />
impacted staff<br />
Complete IAM=s Professional Development Program (PDP) for employees in a<br />
timely manner and in a manner consistent with the department=s Business Plan<br />
and <strong>Operating</strong> Plan<br />
Hold staff meetings at the business unit, divisional and section level on a regular<br />
basis<br />
Ensure IAM management and supervisory staff are aware of, and make regular<br />
use of, a range of informal employee recognition methods<br />
Ensure IAM management and supervisory staff are aware of the full scope of the<br />
HRM Corporate Employee Recognition Program<br />
Ensure significant IAM achievements are communicated to all staff on a regular<br />
basis<br />
Ensure all IAM position evaluations are completed and compensation is provided<br />
at a fair and equitable rate within the corporate program of compensation review<br />
and the negotiation of collective agreements<br />
M11
<strong>Halifax</strong> <strong>Regional</strong> <strong>Municipality</strong><br />
2010/11 Business Plans and Budget (Proposed) Infrastructure and Asset Management<br />
IAM 5.9<br />
IAM 5.10<br />
IAM 5.11<br />
IAM 5.12<br />
Complete comprehensive succession plans for all senior positions at risk within<br />
the business unit<br />
Work with Human Resources respond to the results of the corporate Employee<br />
Engagement Survey, as it relates to IAM staff<br />
Work with Human Resources to implement an HRM corporate diversity strategy<br />
/ plan<br />
Promote corporate safety strategies for IAM employees<br />
Goal 6:<br />
Efficient Capital Project Delivery<br />
Corporate Strategy Linkage:<br />
Council Focus Area: Infrastructure<br />
EMT Priorities: Fiscal Responsibility and Excellence in Service Delivery<br />
Description:<br />
IAM will contribute to the successful delivery of this goal with a series of procedural<br />
improvements and operational objectives intended to maintain or enhance existing service levels<br />
while responding to the strategic goals set out in this plan.<br />
Goal 6:<br />
Efficient Capital Project Delivery<br />
Objectives for 2010/2011:<br />
IAM 6.1 Tender 90% of road-related capital projects no later than Fall 2010<br />
IAM 6.2<br />
IAM 6.3<br />
IAM 6.4<br />
IAM 6.5<br />
IAM 6.6<br />
IAM 6.7<br />
IAM 6.8<br />
IAM 6.9<br />
Continue collaboration among IAM staff, other business units and external<br />
agencies on coordination of the delivery of capital projects<br />
Develop an asphalt design manual that will assist in designing optimum road<br />
pavement and granular structures<br />
Start or complete 80% of building and park-related capital projects within the<br />
business cycle<br />
Close out the following significant major building projects:<br />
• Ragged Lake Transit Facility<br />
• Canada Games Centre<br />
• Prospect Community Centre<br />
• 4-Pad arena<br />
• Alderney 5<br />
Provide project management support and assistance for delivery of facilityrelated<br />
improvements associated with the Canada Winter Games in 2011<br />
Expand and enhance communications strategies regarding capital project<br />
delivery<br />
Provide ongoing support for development of Transit Park and Ride facilities<br />
Support the HRM Central Library Project<br />
M12
<strong>Halifax</strong> <strong>Regional</strong> <strong>Municipality</strong><br />
2010/11 Business Plans and Budget (Proposed) Infrastructure and Asset Management<br />
IAM 6.10<br />
IAM 6.11<br />
IAM 6.12<br />
IAM 6.13<br />
IAM 6.14<br />
IAM 6.15<br />
IAM 6.16<br />
IAM 6.17<br />
IAM 6.18<br />
IAM 6.19<br />
IAM 6.20<br />
Advance Bloomfield project implementation to the RFP stage.<br />
Deliver on all HRM Infrastructure Projects tied to cost sharing contracts with<br />
dates ending March 31/11 including<br />
Support those Non-HRM Infrastructure Projects which are tied to cost sharing<br />
contracts with dates ending March 31/11 including the construction of the Larry<br />
Uteck and Margeson Drive interchanges<br />
Support the Public Art Installations program with technical advice as required<br />
Work with Real Estate, Community Development and the community to<br />
facilitate the sale of HRM owned lands in the Spring Garden Road area for<br />
redevelopment and revitalization<br />
Advance the purchase of lands for strategic municipal purposes<br />
Continue to work with CD for park and open space acquisitions for new<br />
communities under the master planning, subdivision and development agreement<br />
process<br />
Increase short term resource support for delivery of approved capital projects<br />
without creating redundant long term capacity that exceeds projected future<br />
demand<br />
Work with the Traffic Services Division of the Transportation and Public Works<br />
business unit to construct bike lanes in accordance with the Active<br />
Transportation Plan<br />
Advance the Chain of Lakes Trail development through federal/provincial cost<br />
sharing. This includes eight kilometers of trail from Beechville to Joseph Howe<br />
Drive<br />
Upgrade the six kilometers of existing trails connecting Portland Estates and<br />
Portland Hills to the Metro Link Terminal Station and the Mount Hope<br />
Interchange, to meet active transportation standards<br />
Goal 7:<br />
Effective External Communications<br />
Corporate Strategy Linkage:<br />
Council Focus Area: Infrastructure<br />
EMT Priorities: Fiscal Responsibility and Excellence in Service Delivery<br />
Description:<br />
IAM is a business unit that primarily provides internal services to other business units that<br />
provide more direct services to the residents of HRM. As a result, direct external relationships<br />
between IAM and the community are relatively limited. Despite this indirect connection to the<br />
public, IAM delivers a number of important services that would substantially benefit from a<br />
higher level of interaction and an increased level of effective communication with the public.<br />
During the coming business cycle, IAM will be carrying out a number of communications based<br />
initiatives designed to increase public awareness of the business unit’s programs.<br />
M13
<strong>Halifax</strong> <strong>Regional</strong> <strong>Municipality</strong><br />
2010/11 Business Plans and Budget (Proposed) Infrastructure and Asset Management<br />
Goal 7:<br />
Effective External Communications<br />
Objectives for 2010/2011:<br />
IAM 7.1<br />
IAM 7.2<br />
IAM 7.3<br />
IAM 7.4<br />
IAM 7.5<br />
IAM 7.6<br />
IAM 7.7<br />
Develop a communications plan for the SEMO to foster better public knowledge<br />
of corporate and business unit initiatives related to sustainability and<br />
environmental issues<br />
Develop a strategic partnership with Adventure Earth Centre for delivery of<br />
community education regarding environmental sustainability<br />
Utilize the team of Environmental Performance Officers for delivery of<br />
community education on sustainability and environmental related issues<br />
Develop a close working relationship with the Green Municipal Fund (GMF)<br />
and the Federation of Canadian Municipalities (FCM)<br />
Develop a close working relationships with educational institutions that offer<br />
programs complementary to IAM=s employment needs<br />
Develop a public and stakeholder communications plan and package to explain<br />
and promote the role of Active Transportation in HRM<br />
Support the Community Visioning effort led by Community Development<br />
Goal 8:<br />
Internal Partnership / Collaboration Requirements<br />
Corporate Strategy Linkage:<br />
Council Focus Area: Infrastructure<br />
EMT Priorities: Fiscal Responsibility and Excellence in Service Delivery<br />
Description:<br />
IAM=s mandate is weighted toward long range planning, strategic initiatives, and capital project<br />
management. However, despite the focus on these more strategic outcomes, IAM also supports<br />
the delivery of baseline municipal services from other business units across the organization.<br />
Goal 8:<br />
Internal Partnership / Collaboration Requirements<br />
Objectives for 2010/2011:<br />
IAM 8.1<br />
Support other HRM business unit-led service initiatives by accommodating<br />
Internal Service Requests (ISE’s) throughout the business cycle. All ISE’s to<br />
IAM have been reviewed and are accommodated within the business and<br />
operating plans for the department<br />
M14
<strong>Halifax</strong> <strong>Regional</strong> <strong>Municipality</strong><br />
2010/11 Business Plans and Budget (Proposed) Infrastructure and Asset Management<br />
Service Level Changes<br />
Increases In Services / new initiatives:<br />
• Increase in climate change education programs<br />
• Increase in GHG inventory reporting<br />
Decreases In Services / Operational Pressures:<br />
• The public education component of the Pesticide Bylaw program will be eliminated.<br />
Bylaw services and permitting will continue as expected<br />
• Corporate Accommodation services will be primarily focussed on delivery of a number of<br />
significant corporate relocations during the 2010/11 business cycle. As a result, there is no<br />
capacity for delivery of unplanned or unexpected Corporate Accommodations related<br />
activity<br />
• Streetscape infrastructure improvements and recapitalization will be substantially reduced<br />
during this business cycle in order to offset operational budget challenges. The<br />
underground wiring program for Morris Street will be delivered as approved by Council.<br />
In addition, gateway improvements on Lower Water Street and Waterfront Development<br />
Corporation cooperative projects will also proceed subject to finalization of the relevant<br />
cost sharing programs. All other streetscape improvement and recapitalization activities<br />
will be deferred to future years<br />
Expected Services Not Being Delivered:<br />
• Construction of new pedestrian trails will not take place during this business cycle in order<br />
to offset operational budget challenges. Cost shared trail construction referred to in<br />
sections IAM 6.19 and IAM 6.20 will be delivered as planned<br />
M15
Infrastructure & Asset Management<br />
Summary of Gross Expenditures by Division<br />
2008-2009 2009-2010 2009-2010 2010-2011 Change over<br />
Actual Budget Projections Budget Budget Var as %<br />
IAM Admin<br />
I101 IAM Admin 387,025 386,120 350,900 406,373 20,253 5.2<br />
387,025 386,120 350,900 406,373 20,253 5.2<br />
Facility Development<br />
W953 Capital Admin 1,187,953 1,183,600 1,196,975 1,213,459 29,859 2.5<br />
W955 Corporate Accommodation 88,292 99,000 67,987 97,510 (1,490) (1.5)<br />
C727 New Facility Development 157,645 161,500 161,485 258,310 96,810 59.9<br />
1,433,890 1,444,100 1,426,447 1,569,279 125,179 8.7<br />
Design & Construction<br />
R110 Design Admin. 308,193 322,180 343,154 356,976 34,796 10.8<br />
R111 Design 1,096,528 1,131,400 1,122,661 1,184,337 52,937 4.7<br />
R120 Construction Ser 1,008,960 1,049,300 1,041,628 1,090,687 41,387 3.9<br />
R130 Infrastr MgmtServ. 284,272 268,000 262,201 284,255 16,255 6.1<br />
R140 Surveying 821,367 951,800 942,800 997,482 45,682 4.8<br />
R150 Record Management 361,364 384,200 327,247 335,632 (48,568) (12.6)<br />
3,880,684 4,106,880 4,039,691 4,249,369 142,489 3.5<br />
CCC Implementation Project<br />
C460 Infra Plan Office 155,817 304,400 180,600 314,872 10,472 3.4<br />
155,817 304,400 180,600 314,872 10,472 3.4<br />
Parks Planning<br />
C781 Streetscape Coordinator (1,260) 0 0 0 0 -<br />
W943 Parks Planning 1,100,405 1,219,100 1,205,291 1,219,775 675 0.1<br />
1,099,146 1,219,100 1,205,291 1,219,775 675 0.1<br />
Sustainable Environment<br />
D935 SEMO Administration 183,951 212,400 216,305 614,559 402,159 189.3<br />
D940 SEMO Programs 143,727 169,100 148,950 0 (169,100) (100.0)<br />
D945 SEMO Projects 39,484 92,100 44,900 0 (92,100) (100.0)<br />
D947 SEMOEnvir.Water Qlty 129,928 252,100 178,690 0 (252,100) (100.0)<br />
D948 SEMOSust. Comm Proj (0) (300) 0 (300) 0 -<br />
497,090 725,400 588,845 614,259 (111,141) (15.3)<br />
Total $7,453,651 $8,186,000 $7,791,774 $8,373,927 $187,927 2.3<br />
M16
Infrastructure & Asset Management<br />
Summary of Gross Revenue by Division<br />
2008-2009 2009-2010 2009-2010 2010-2011 Change over<br />
Actual Budget Projections Budget Budget Var as %<br />
IAM Admin<br />
I101 IAM Admin (6,725) 0 0 0 0 -<br />
(6,725) 0 0 0 0 -<br />
Facility Development<br />
W953 Capital Admin (99) 0 0 0 0 -<br />
(99) 0 0 0 0 -<br />
Design & Construction<br />
R110 Design Admin. (58,916) (70,000) (207,480) (90,800) (20,800) 29.7<br />
R150 Record Management (1,157) 0 (1,500) 0 0 -<br />
(60,073) (70,000) (208,980) (90,800) (20,800) 29.7<br />
Parks Planning<br />
W943 Parks Planning (19,582) 0 (5,000) 0 0 -<br />
(19,582) 0 (5,000) 0 0 -<br />
Sustainable Environment<br />
D935 SEMO Administration (509) 0 0 0 0 -<br />
D945 SEMO Projects 0 0 (1,318) 0 0 -<br />
D948 SEMOSust. Comm Proj 0 0 (3,338) 0 0 -<br />
(509) 0 (4,656) 0 0 -<br />
Total (86,988) (70,000) (218,636) (90,800) (20,800) 29.7<br />
M17
Infrastructure & Asset Management<br />
Summary of Net Expenditures by Division<br />
2008-2009 2009-2010 2009-2010 2010-2011 Change over<br />
Actual Budget Projections Budget Budget Var as %<br />
IAM Admin<br />
I101 IAM Admin 380,300 386,120 350,900 406,373 20,253 5.2<br />
380,300 386,120 350,900 406,373 20,253 5.2<br />
Facility Development<br />
W953 Capital Admin 1,187,854 1,183,600 1,196,975 1,213,459 29,859 2.5<br />
W955 Corporate Accommodatio 88,292 99,000 67,987 97,510 (1,490) (1.5)<br />
C727 New Facility Development 157,645 161,500 161,485 258,310 96,810 59.9<br />
1,433,791 1,444,100 1,426,447 1,569,279 125,179 8.7<br />
Design & Construction<br />
R110 Design Admin. 249,277 252,180 135,674 266,176 13,996 5.6<br />
R111 Design 1,096,528 1,131,400 1,122,661 1,184,337 52,937 4.7<br />
R120 Construction Ser 1,008,960 1,049,300 1,041,628 1,090,687 41,387 3.9<br />
R130 Infrastr MgmtServ. 284,272 268,000 262,201 284,255 16,255 6.1<br />
R140 Surveying 821,367 951,800 942,800 997,482 45,682 4.8<br />
R150 Record Management 360,207 384,200 325,747 335,632 (48,568) (12.6)<br />
3,820,611 4,036,880 3,830,711 4,158,569 121,689 3.0<br />
CCC Implementation Project<br />
C460 Infra Plan Office 155,817 304,400 180,600 314,872 10,472 3.4<br />
155,817 304,400 180,600 314,872 10,472 3.4<br />
Parks Planning<br />
C781 Streetscape Coordinator (1,260) 0 0 0 0 -<br />
W943 Parks Planning 1,080,823 1,219,100 1,200,291 1,219,775 675 0.1<br />
1,079,563 1,219,100 1,200,291 1,219,775 675 0.1<br />
Sustainable Environment<br />
D935 SEMO Administration 183,442 212,400 216,305 614,559 402,159 189.3<br />
D940 SEMO Programs 143,727 169,100 148,950 0 (169,100) (100.0)<br />
D945 SEMO Projects 39,484 92,100 43,582 0 (92,100) (100.0)<br />
D947 SEMOEnvir.Water Qlty 129,928 252,100 178,690 0 (252,100) (100.0)<br />
D948 SEMOSust. Comm Proj (0) (300) (3,338) (300) 0 -<br />
496,581 725,400 584,189 614,259 (111,141) (15.3)<br />
Total $7,366,663 $8,116,000 $7,573,138 $8,283,127 $167,127 2.1<br />
M18
Infrastructure & Asset Management<br />
Summary by Expenditure & Revenue Types<br />
2008-2009 2009-2010 2009-2010 2010-2011 Change over<br />
Actual Budget Projections Budget Budget Var as %<br />
Expenditures<br />
Compensation & Benefits 6,352,962 7,126,100 7,023,151 7,594,315 468,215 6.6<br />
Office 248,615 209,100 184,632 187,408 (21,692) (10.4)<br />
Professional Fees 52,245 3,000 5,000 3,000 0 -<br />
Legal & Consulting Fees 66,464 83,300 156,213 63,601 (19,699) (23.6)<br />
External Services 134,483 627,800 406,273 516,927 (110,873) (17.7)<br />
Uniforms & Clothing 7,260 6,500 5,974 6,600 100 1.5<br />
Supplies & Materials 6,740 7,000 5,183 6,610 (390) (5.6)<br />
Building Costs 7,030 13,100 8,391 13,200 100 0.8<br />
Equipment & Communications 49,561 45,600 21,459 42,298 (3,302) (7.2)<br />
Vehicle Expense 9,750 4,800 4,400 4,800 0 -<br />
Travel 194,768 181,500 181,704 165,209 (16,291) (9.0)<br />
Training & Education 30,720 45,900 41,890 46,479 579 1.3<br />
Facilities Rental 21,048 37,600 45,200 37,799 199 0.5<br />
Advertising & Promotion 47,734 19,900 13,683 14,359 (5,541) (27.8)<br />
Other Goods & Services 363,815 380,300 146,006 474,392 94,092 24.7<br />
Interdepartmental 34,918 28,000 (67,970) 22,587 (5,413) (19.3)<br />
Transfer to/from Reserves (184,463) (409,000) (91,800) (374,968) 34,032 (8.3)<br />
Other Fiscal 10,000 (224,500) (297,615) (450,689) (226,189) 100.8<br />
Expenditures 7,453,651 8,186,000 7,791,774 8,373,927 187,927 2.3<br />
Total $7,453,651 $8,186,000 $7,791,774 $8,373,927 $187,927 2.3<br />
Revenues<br />
Sales Revenue (58,916) (70,000) (207,480) (90,800) (20,800) 29.7<br />
Other Revenue (28,073) 0 (11,156) 0 0 -<br />
Revenues (86,988) (70,000) (218,636) (90,800) (20,800) 29.7<br />
Total (86,988) (70,000) (218,636) (90,800) (20,800) 29.7<br />
Net Cost $7,366,663 $8,116,000 $7,573,138 $8,283,127 $167,127 2.1<br />
M19
<strong>Halifax</strong> <strong>Regional</strong> <strong>Municipality</strong><br />
2010/11 Business Plans and Budget (Proposed) Legal Services & Risk Management<br />
Legal Services<br />
& Risk Management<br />
Business Plan - 2010/11
<strong>Halifax</strong> <strong>Regional</strong> <strong>Municipality</strong><br />
2010/11 Business Plans and Budget (Proposed) Legal Services & Risk Management<br />
Mission: To provide legal and risk management services, support and counsel in a timely and<br />
effective manner to the Community, Council and Staff, to enable clients to comply with the law,<br />
make legally supportable decisions and to protect the assets of the municipality.<br />
Business Unit Overview:<br />
This business unit has two main sections - Legal Services, and Risk and Insurance Services<br />
which provide support to the HRM initiatives and operations.<br />
Director:<br />
Legal Services<br />
M. E. Donovan, QC<br />
B.Sc., Dip. Engr.,<br />
LL.B.<br />
Insurance & Risk<br />
Management<br />
Peter Ross, B.<br />
Comm., MBA, CRM<br />
Summary of<br />
Business Unit<br />
Structure Changes:<br />
Mary Ellen Donovan<br />
Legal Services (LS) functions to support <strong>Regional</strong> Council, its<br />
Boards and Committees and the Business Units, to provide general<br />
legal services including to undertake all litigation on behalf of the<br />
municipality; to provide contract drafting and review; to undertake<br />
property transactions, enforcement /prosecute municipal bylaws and<br />
provincial regulatory provisions, and general advice.<br />
Apply sound risk management processes to the identification,<br />
analysis, and mitigation of loss exposures to the HRM, with the<br />
understanding that acceptance of risk is required to operate<br />
effectively and efficiently. The goal of this group avoid undue risk<br />
where possible, assigning risks to others where practical, diversify<br />
the risk where able, and for those risks retained by the HRM to work<br />
to reduce the frequency and the severity of any loss.<br />
No changes<br />
Core Operations and Services provided:<br />
Legal Services performs legal services including:<br />
• Litigation including personal injury, property damage, construction claims, and general<br />
litigation;<br />
• Planning appeals, hearings, agreements and advice;<br />
• General contract negotiations and contract preparation;<br />
• Labour and employment matters: arbitrations, labour relation board hearings, human rights<br />
appeals, Police Review Board hearings, policy advice, and general advice;<br />
• Prosecutions of provincial offences and bylaw offences;<br />
• A wide array of solicitor services including property transactions;<br />
• Advice to Council, Boards and Commissions & staff;<br />
• Drafting of By-laws;<br />
• Regulatory matters including power, telecommunications and natural gas hearings.<br />
Risk Management manages the risk portfolio including:<br />
N2
<strong>Halifax</strong> <strong>Regional</strong> <strong>Municipality</strong><br />
2010/11 Business Plans and Budget (Proposed) Legal Services & Risk Management<br />
• The design and management of a program of self insurance, reserve funds and insurance<br />
coverage to fit the needs of HRM operations;<br />
• Ongoing review and procurement and maintenance of optimum insurance coverage suitable<br />
to the needs of HRM;<br />
• Determination of appropriate coverage limits, and self insurance levels;<br />
• Ongoing review of contracts, leases, special events, to address risk exposures, administration<br />
of claims to achieve a reasonable resolution;<br />
• Providing risk management advice, training and monitoring, particularly in the area of loss<br />
control, to all business units; and Claims management. (responding to more than 1300 claims<br />
annually)<br />
Funded Full Time Equivalents (FTEs):<br />
Funded FTEs (includes<br />
permanent and temporary)<br />
2008/09 2009/10 2010/11<br />
(Approved) (Approved) (Proposed)<br />
25 25 25<br />
Analysis of <strong>Operating</strong> Budget Changes:<br />
<strong>Operating</strong> Budget Change Details<br />
2009/10 Budget $2,194<br />
1 Transfer to Reserves (18)<br />
2 Miscellaneous accounts (4)<br />
3 Salaries and Benefits 56<br />
2010/11 Budget $2,228<br />
N3
<strong>Halifax</strong> <strong>Regional</strong> <strong>Municipality</strong><br />
2010/11 Business Plans and Budget (Proposed) Legal Services & Risk Management<br />
Key Challenges and Opportunities<br />
The following challenges and opportunities will have an impact on the Business Unit between<br />
the 2010-2015 timeframe.<br />
Challenges with Community-wide Impact:<br />
These are challenges or opportunities which affect the entire HRM Region, and which the<br />
Business Unit plays a role in influencing or addressing the outcome. Multiple business units may<br />
be involved in addressing the issue.<br />
1. Summary Proceedings Issues: The number of summary offence matters has grown<br />
significantly in recent years, demanding more effective delivery of prosecution services.<br />
In the absence of a municipal court several initiatives have begun in cooperation with the<br />
provincial Department of Justice, HRP and RCMP to adjust the adjudicative systems to<br />
meet the need for additional judicial resources. It is anticipated that the first of the system<br />
improvements will be approved with legislative changes in the spring 2010 session of the<br />
Legislature, with implementation before the end of 2010.<br />
2. Electronic Summary Offence Tickets (ESOT) Project: HRM is currently participating<br />
in the provincial Department of Justice (DOJ) ESOT project, which will allow the<br />
issuance of electronic SOTs, thereby finally achieving a “write once” approach to SOTs<br />
with the attendant administrative savings. Additionally, this system will significantly<br />
reduce the opportunity for human error in the issuance of SOTs, thereby reducing<br />
associated administrative and prosecution costs. It will also virtually eliminate the delay<br />
in transmission of data from policing services to the DOJ, facilitating prompt payment of<br />
tickets, thereby improving customer service. Implementation should commence spring<br />
2011.<br />
Challenges with Service Delivery / Business Unit Impact<br />
These are issues which affect the business unit’s ability to deliver services (both internally and<br />
externally).<br />
1. Challenge: Complex Commercial Matters: The increase in the infrastructure budget has<br />
led to an increase in the need for commercial contracts. Legal Services is working to increase<br />
the internal expertise in this practice area to respond to this growth.<br />
2. Challenge: Increased Prosecution Services: The creation of the Traffic Unit for the <strong>Halifax</strong><br />
<strong>Regional</strong> Police has increased the number of summary offence tickets for motor vehicle<br />
offences from 35,000 to approximately 53,000. To respond to this workload, in 2008 the<br />
Provincial Court doubled the number of court sittings each week. In 2008 Legal Services had<br />
additional staff approved to manage the increased demands for prosecution services. Police<br />
and Legal Services are working collaboratively with the Province on innovative ways to<br />
N4
<strong>Halifax</strong> <strong>Regional</strong> <strong>Municipality</strong><br />
2010/11 Business Plans and Budget (Proposed) Legal Services & Risk Management<br />
provide prosecution services in a more cost effective manner. Research is currently underway<br />
to identify alternate ways of service delivery. Any service delivery changes will require<br />
collaboration and support of external agencies. Existing staff is inadequate to address the<br />
service needs. In addition the requirement to provide trials in French is creating a budget<br />
pressure. LS is working with the Public Prosecution Service to develop cost effective service<br />
delivery models that will respond to this new cost.<br />
3. Challenge: Increasing Insurance Cost: The increase in HRM’s activities have an impact on<br />
insurance cost and workload. For example, the increase in the number of routes and ridership<br />
on our transit system may increase claims and general liability insurance cost. The new waste<br />
water treatment system, buses, and improvements and additions to new facilities will increase<br />
asset value and may have an effect on property and automobile insurance. There is an<br />
indication of a “hard” market starting, a time when insurance costs increase due to the<br />
economic downturn throughout the world. Even a minor increase in insurance cost would be<br />
a significant cost. Last year the initial cost of insurance proposed an increase of<br />
approximately 37% for property insurance and 18% in general liability. We were able to<br />
reduce this impact and generate some savings by changing insurers. HRM may have to<br />
accept more risk through a higher deductible to reduce this cost or increase the budget for<br />
insurance. The insurance budget has remained constant for the last five years despite<br />
increased risk.<br />
Business Unit Goals<br />
The goals for Legal Services and Risk Management are:<br />
Goal 1: Summary proceedings issues- improving efficiency by reducing staff time<br />
Goal 2: Electronic summary offence tickets – improving efficiency and accuracy<br />
Goal 3: Increasing use of risk management tools within organization<br />
Goal 4: Managing insurance cost to maintain or reduce cost<br />
Goal 5 : Legal services file management system installation<br />
Goal 6: Workforce planning<br />
Goal 1:<br />
Summary Proceedings Issues<br />
Corporate Strategy Linkage:<br />
Council Focus Area: Public Safety<br />
EMT Priority: Providing Excellence in Service Delivery<br />
Description:<br />
More effective policing and more effective by-law enforcement in recent years have resulted in<br />
the need for additional legal resources to support these enforcement efforts. New court capacity<br />
was developed in 2008 to respond to this demand and LS added one FTE to respond to the<br />
additional capacity requirements. This has not proved adequate and therefore is creating staffing<br />
N5
<strong>Halifax</strong> <strong>Regional</strong> <strong>Municipality</strong><br />
2010/11 Business Plans and Budget (Proposed) Legal Services & Risk Management<br />
pressures. LS will be working to address this issue through various means. As part of this<br />
initiative, staff is currently engaged in a number of initiatives with the Department of Justice<br />
(NS), HRP, RCMP and BPIM to adopt improved administrative judicial practices.<br />
Goal 1:<br />
Summary Proceedings Issues<br />
Objectives for 2010/2011:<br />
LEG 1.1. Continue exploring with the Province the creation of a municipal court.<br />
LEG 1.2<br />
LEG 1.3<br />
LEG 1.4<br />
LEG 1.5<br />
LEG 1.6<br />
Continue to work with the DOJ to reduce costs, improve access, and improve<br />
efficiency of the current court system.<br />
Review with Police/RCMP/DOJ ideas to streamline prosecution services<br />
Subject to legislative change, implement new application and arraignment<br />
process<br />
Identify additional legislative/regulatory changes required for adoption of<br />
evidentiary certificates<br />
Continue review of efficacy of current court processes.<br />
Objectives for the next 3-5 years:<br />
LEG 1.7<br />
LEG 1.8<br />
Increase use of Police Certificate Evidence<br />
Improved disclosure system<br />
Goal 2:<br />
Electronic Summary Offence Tickets Project<br />
Corporate Strategy Linkage:<br />
EMT Priorities: Practising Fiscal Responsibility, Providing Excellence in Service Delivery<br />
Description:<br />
HRM is working with the Province to develop and implement an electronic summary offence<br />
ticket. This work will require changes to regulations. The Province has assigned project staff to<br />
work on this initiative and it is proceeding well. HRM will continue to provide input and<br />
resources as necessary.<br />
Goal 2:<br />
Electronic Summary Offence Tickets Project<br />
Objectives for 2010/2011:<br />
LEG 2.1<br />
LEG 2.2<br />
Increase accuracy in SOTS resulting in fewer cases lost due to clerical errors.<br />
Elimination of duplication of effort with respect to entering of SOT data by both<br />
police officers and support staff.<br />
N6
<strong>Halifax</strong> <strong>Regional</strong> <strong>Municipality</strong><br />
2010/11 Business Plans and Budget (Proposed) Legal Services & Risk Management<br />
LEG 2.3<br />
LEG 2.4<br />
Significant reduction in time to issue SOTS with attendant improvement in<br />
utilization of policing resources.<br />
Reduction in time delay between issuance of ticket and delivery of data to<br />
provincial court thereby improving service delivery and facilitating payment.<br />
Goal 3:<br />
Risk Management<br />
Corporate Strategy Linkage:<br />
EMT Priority: Practicing Fiscal Responsibility.<br />
Description:<br />
As part of their business operations, staff has recognized and treated risk without a framework or<br />
tool to assist. To evaluate HRM’s risk portfolio, HRM needs to measure these risks against each<br />
other using a common measure. As resources are limited, the use of risk management can allow<br />
management to make decisions and assign resources effectively. The framework to do this is<br />
enterprise risk management. Staff will work with other partners to establish an enterprise risk<br />
management tool.<br />
Goal 3:<br />
Increased Risk Management<br />
Objectives for 2010/2011:<br />
LEG 3.1 Work with other partners to identify an enterprise risk management tool for<br />
HRM<br />
LEG 3.2 Identify major risks to HRM and a method to rank risks against HRM risk<br />
criteria.<br />
Objectives for the next 3-5 years:<br />
LEG 3.3<br />
Complete a framework with which to identify and manage risk within the<br />
organization and a process to review its effectiveness<br />
Goal 4:<br />
Managing Insurance Cost<br />
Corporate Strategy Linkage:<br />
EMT Priority: Practicing Fiscal Responsibility, Providing Excellence in Service Delivery<br />
Description:<br />
One of the Legal and Risk Management’s challenge areas is increasing insurance cost. Staff is<br />
investigating a new information system to better manage claims information and partnering with<br />
other HRM departments at gathering and recording property information details. This will<br />
improve the ability of staff to control risk and manage the cost of risk. To determine if HRM has<br />
N7
<strong>Halifax</strong> <strong>Regional</strong> <strong>Municipality</strong><br />
2010/11 Business Plans and Budget (Proposed) Legal Services & Risk Management<br />
retained the correct level of risk (deductible), staff will evaluate increasing self insurance vs.<br />
increased risk to determine if higher limits are prudent.<br />
Goal 4:<br />
Manage Increasing Insurance Cost<br />
Objectives for 2010/2011:<br />
LEG 4.1 Implement an improved system to manage insurance and risk management<br />
information<br />
LEG 4.2 Partner with other business units to improve information on risk especially<br />
related to assets.<br />
LEG 4.3 Action a study to determine the cost of risk at present retention levels and at<br />
higher deductibles<br />
Objectives for the next 3-5 years:<br />
LEG 4.4<br />
Review costs programs at other amounts to determine cost savings.<br />
Goal 5:<br />
Legal Services File Management System<br />
Corporate Strategy Linkage:<br />
EMT Priority: Providing Excellence in Service Delivery<br />
Description:<br />
Electronic file management systems facilitate more efficient delivery of legal services, improve<br />
efficiency of collaboration on litigation files, and improve the efficiency in the drafting of larger<br />
contracts in particular. The implementation of Livelink has begun with project completion<br />
expected in February 2011.<br />
Goal 5:<br />
Legal Services File Management System<br />
Objectives for 2010/2011:<br />
LEG 5.1 Work with BPIM on installation of Open Office scheduled to start September<br />
2010. Preparatory system investigative work has commenced.<br />
LEG 5.2 Installation of a Legal Services file management system and training<br />
Objectives for the next 3-5 years:<br />
LEG 5.3<br />
Review installation for effectiveness and adequacy.<br />
N8
<strong>Halifax</strong> <strong>Regional</strong> <strong>Municipality</strong><br />
2010/11 Business Plans and Budget (Proposed) Legal Services & Risk Management<br />
Goal 6:<br />
Workforce Planning<br />
Corporate Strategy Linkage:<br />
EMT Priorities: Employer of Choice<br />
Description:<br />
The goal is to maintain the highly productive work environment and positive workplace presently<br />
in Legal and Risk Management and to create opportunities for development and growth though<br />
training opportunities and assignments.<br />
Goal 6:<br />
Workforce Planning<br />
Objectives for 2010/2011:<br />
LEG 6.1 Develop business case to address need for junior solicitor to undertake solicitor<br />
work.<br />
Service Level Changes<br />
Increases In Services / New Initiatives:<br />
• Increased work with regards to Harbour Solutions Project<br />
• Increased work in HR deemed significant because of collective bargaining, human rights,<br />
attendance management and policy review projects.<br />
• Governance Review and boundary realignment<br />
Decreases In Services / Operational Pressures (OP):<br />
None<br />
Expected Services Not Being Delivered:<br />
None<br />
N9
Legal Services & Risk Management<br />
Summary of Gross Expenditures by Division<br />
2008-2009 2009-2010 2009-2010 2010-2011 Change over<br />
Actual Budget Projections Budget Budget Var as %<br />
Legal Services<br />
A110 Legal Services 2,193,303 2,338,490 2,306,159 2,456,105 117,615 5.0<br />
A303 Insurance & Risk Mgm 45,700 (100) (100) 0 100 (100.0)<br />
2,239,003 2,338,390 2,306,059 2,456,105 117,715 5.0<br />
Total $2,239,003 $2,338,390 $2,306,059 $2,456,105 $117,715 5.0<br />
Summary of Gross Revenue by Division<br />
2008-2009 2009-2010 2009-2010 2010-2011 Change over<br />
Actual Budget Projections Budget Budget Var as %<br />
Legal Services<br />
A110 Legal Services (108,799) (144,000) (193,500) (228,000) (84,000) 58.3<br />
(108,799) (144,000) (193,500) (228,000) (84,000) 58.3<br />
Total (108,799) (144,000) (193,500) (228,000) (84,000) 58.3<br />
Summary of Net Expenditures by Division<br />
2008-2009 2009-2010 2009-2010 2010-2011 Change over<br />
Actual Budget Projections Budget Budget Var as %<br />
Legal Services<br />
A110 Legal Services 2,084,504 2,194,490 2,112,659 2,228,105 33,615 1.5<br />
A303 Insurance & Risk Mgm 45,700 (100) (100) 0 100 (100.0)<br />
2,130,205 2,194,390 2,112,559 2,228,105 33,715 1.5<br />
Total $2,130,205 $2,194,390 $2,112,559 $2,228,105 $33,715 1.5<br />
Summary by Expenditure & Revenue Types<br />
2008-2009 2009-2010 2009-2010 2010-2011 Change over<br />
Actual Budget Projections Budget Budget Var as %<br />
Expenditures<br />
Compensation & Benefits 2,009,839 2,139,780 2,110,400 2,275,450 135,670 6.3<br />
Office 66,898 73,800 67,397 71,880 (1,920) (2.6)<br />
Professional Fees 5,474 0 0 0 0 -<br />
Legal & Consulting Fees 209,688 270,000 302,600 296,700 26,700 9.9<br />
External Services 80,800 59,970 45,000 35,000 (24,970) (41.6)<br />
Supplies & Materials 497 0 0 0 0 -<br />
Building Costs 26,761 10,000 1,500 10,000 0 -<br />
Equipment & Communications 245 0 0 0 0 -<br />
Travel 16,180 14,500 12,712 11,435 (3,065) (21.1)<br />
Training & Education 5,099 17,000 10,000 17,100 100 0.6<br />
Advertising & Promotion 172 0 0 0 0 -<br />
Other Goods & Services 88,340 88,840 91,950 91,740 2,900 3.3<br />
Transfer to/from Reserves (270,990) (335,500) (335,500) (353,200) (17,700) 5.3<br />
Expenditures 2,239,003 2,338,390 2,306,059 2,456,105 117,715 5.0<br />
Total $2,239,003 $2,338,390 $2,306,059 $2,456,105 $117,715 5.0<br />
Revenues<br />
Fines and Fees 0 0 (9,500) 0 0 -<br />
Sales Revenue (106,098) (144,000) (144,000) (144,000) 0 -<br />
Other Revenue (2,701) 0 (40,000) (84,000) (84,000) -<br />
Revenues (108,799) (144,000) (193,500) (228,000) (84,000) 58.3<br />
Total (108,799) (144,000) (193,500) (228,000) (84,000) 58.3<br />
Net Cost $2,130,205 $2,194,390 $2,112,559 $2,228,105 $33,715 1.5<br />
N10
<strong>Halifax</strong> <strong>Regional</strong> <strong>Municipality</strong><br />
2010/11 Business Plans and Budget (Proposed) Transportation and Public Works<br />
Transportation and<br />
Public Works<br />
Business Plan - 2010/11
<strong>Halifax</strong> <strong>Regional</strong> <strong>Municipality</strong><br />
2010/11 Business Plans and Budget (Proposed) Transportation and Public Works<br />
Mission: Transportation and Public Works plans, operates and maintains the <strong>Halifax</strong><br />
<strong>Regional</strong> <strong>Municipality</strong>’s transportation network and infrastructure including parks, buildings,<br />
structures, vehicles, streets, equipment, and solid waste management through education, quality<br />
customer service and support for a safe and sustainable environment within our Community.<br />
Business Unit Overview:<br />
Transportation and Public Works (TPW) consolidates both the critical and operational-based<br />
services that contribute to sustainable public infrastructure and transportation networks.<br />
The Director, TPW acts as Municipal/City Engineer on the behalf of <strong>Halifax</strong> <strong>Regional</strong><br />
<strong>Municipality</strong> (HRM) as per the Municipal Government Act. The Director represents HRM<br />
interests with the provincial and federal governments as well as with other outside organizations<br />
and agencies.<br />
Through dedicated teamwork and responsible leadership TPW will continue to balance economic<br />
growth, environmental concerns, and fiscal responsibility to provide quality of life to all HRM<br />
citizens.<br />
Acting Director:<br />
Corporate Fleet and<br />
Equipment<br />
Paul Beauchamp -<br />
Manager<br />
Metro Transit<br />
Pat Soanes – General<br />
Manager<br />
Municipal<br />
Operations<br />
Peter Verge - Manager<br />
Real Estate and<br />
Facility Services<br />
Peter Stickings -<br />
Manager<br />
Ken Reashor, P. Eng. (Traffic Authority)<br />
Central service delivery organization responsible for the maintenance<br />
and repair for Municipal Fleet, Police and Fire, as well as for the<br />
replacement of HRM’s vehicle and equipment assets in support of<br />
Municipal Fleet, Police, Fire and Metro Transit.<br />
Provides public transit services throughout HRM through<br />
conventional urban and rural transit, premium branded MetroLink<br />
and MetroX service, passenger ferry service and specialized Access-<br />
A-Bus services.<br />
Proactively maintains and improves a safe, efficient, aesthetic and<br />
clean street, sidewalk, walkway, trail, park, playground, athletic field,<br />
cemetery and open space system for use by HRM residents and<br />
visitors.<br />
Responsible for the operation and property maintenance of HRM<br />
owned and leased corporate properties and buildings, delivery of<br />
acquisition and disposal services on behalf of the organization for<br />
municipal purposes, real estate advisory services, and the<br />
development and sale of HRM’s Business Parks lots.<br />
O2
<strong>Halifax</strong> <strong>Regional</strong> <strong>Municipality</strong><br />
2010/11 Business Plans and Budget (Proposed) Transportation and Public Works<br />
Service Delivery and<br />
Quality<br />
Improvement<br />
Wayne Legere -<br />
Manager<br />
Traffic and<br />
Right of Way<br />
Services<br />
Taso Koutroulakis –<br />
Acting Manager<br />
Solid Waste<br />
Resources<br />
Gord Helm- Manager<br />
Strategic<br />
Transportation<br />
Planning<br />
David McCusker -<br />
Manager<br />
Summary of<br />
Business<br />
Unit Structure<br />
Changes:<br />
Central service section that coordinates training and quality<br />
improvement initiatives for the business unit including organizational<br />
performance tools, citizen feedback systems, performance<br />
management and liaising with external agencies.<br />
Provides for the safe and efficient management of HRM’s<br />
transportation system network including traffic flow, signal/light<br />
maintenance, signage, and traffic markings. Coordinates and<br />
manages HRM rights of way balancing competing demands for<br />
space.<br />
Manages the execution of the municipal solid waste source separated<br />
collection and diversion program for HRM residential properties and<br />
the facilities for processing, recycling, composting, marketing and<br />
disposal of solid waste resource materials for both residential and<br />
non-residential customers; delivers the communication, education<br />
and compliance programs, and administers the Construction &<br />
Demolition Waste Management Strategy.<br />
Delivers long-term strategic planning with respect to new demands<br />
on HRM’s transportation infrastructure. This program includes the<br />
measurement and monitoring of demands and modeling of future<br />
growth impacts, as well as the development of policy and plans<br />
aimed at making regional travel more sustainable.<br />
• Management Unit for Strategic Transportation Planning was<br />
added as part of a realignment in December 2009.<br />
• Fleet Services was divided so that all transit fleet functions<br />
realign under Metro Transit. The remaining Fleet Services<br />
functions were renamed Corporate Fleet and Equipment Services.<br />
Core Operations and Services provided:<br />
• 1,600 km of roads, 1,925 km of curbs, 765 km of sidewalks, 60 km of gravel roads and 75<br />
bridges maintained<br />
• 270 traffic signals with the addition of 3 on average per year by HRM plus others by<br />
developers<br />
• 170 of the signalized intersections are fully installed with LED’s<br />
• In excess of 1,735 km of white and yellow centrelines painted<br />
• More than 16,000 signs manufactured and 2,000 sign posts installed or repaired<br />
• 39,400 street lights maintained by HRM, of which approximately 13,100 are owned by HRM<br />
• 62,200 metres crosswalks, 13,800 metres stopbars, 4200 arrows painted<br />
• 10 street sweepers; 5 sidewalk sweepers; 2 graffiti trucks; 73 snow and ice vehicles<br />
O3
<strong>Halifax</strong> <strong>Regional</strong> <strong>Municipality</strong><br />
2010/11 Business Plans and Budget (Proposed) Transportation and Public Works<br />
• 6 major parks and the Public Gardens<br />
• 25 million customers carried annually on all of Metro Transit’s 56 fixed transit routes and 2<br />
ferry routes<br />
• 13 park and ride locations with over 1,340 parking spaces<br />
• A modern, diverse fleet of 298 vehicles and 3 ferries<br />
• 24 Access-A-Buses, a shared ride public transit service for persons who are unable to use the<br />
conventional (Non Low Floor) transit system due to a physical or cognitive disability serving<br />
17,000 Access-a-Bus passengers per month<br />
• Processes over 20,000 work orders annually to maintain over 2.5 million square feet of<br />
building space<br />
• Own and maintain 260 buildings, 825 park properties, 325 playgrounds, 174 ball diamonds,<br />
130 sport fields, and 180 Sport courts<br />
• Development and sales operations for 5 municipal business/industrial parks<br />
• Operate and maintain 7 municipally owned cemeteries<br />
• Service and maintain operational vehicles, 400 pieces of small equipment, 220 police<br />
vehicles, and 300 fire vehicles<br />
• Consume 11,000,000 litres of vehicle fuel<br />
• 1 mixed solid waste processing and disposal facility at Otter Lake<br />
• 1 Materials Recovery Facility (Recyclables)<br />
• 2 Compost Plants (New Era Technologies, Miller Composting)<br />
• 1 Household Hazardous Waste Depot<br />
• 2 rural waste transfer depots<br />
• 16 private sector solid waste providers (collection & processing)<br />
• Average annual (2009) solid waste tonnage (approx): 22,000 recyclables, 51,000 organics,<br />
150,000 refuse, 90,000 construction and demolition material<br />
• Approximately 152,000 tonnes of total waste received at Otter Lake (2008/9)<br />
• Generation and sale of 2 Mega Watts electricity at closed landfill in Upper Sackville<br />
• Strategic transportation planning to effectively manage the demands on HRM’s network of<br />
roadways, and active transportation networks in accordance with the various approved<br />
community planning documents such as the <strong>Regional</strong> Plan and Active Transportation Plan<br />
• Strategic property acquisition and disposal to support municipal infrastructure and programs<br />
O4
<strong>Halifax</strong> <strong>Regional</strong> <strong>Municipality</strong><br />
2010/11 Business Plans and Budget (Proposed) Transportation and Public Works<br />
Funded Full Time Equivalents (FTEs):<br />
2008/09<br />
(Approved)<br />
2009/10<br />
(Approved)<br />
2010/11<br />
(Proposed)<br />
Funded FTEs (includes<br />
permanent and temporary) 1210 1284 1284<br />
Analysis of <strong>Operating</strong> Budget Changes:<br />
<strong>Operating</strong> Budget Change Details<br />
($000's)<br />
2009/10 Budget $ 98,485<br />
1 Salaries & benefits - net changes resulting from merit increases,<br />
4,550<br />
classification reviews, employer benefit costs, collective agreements.<br />
2 Other External Services 921<br />
3 Vehicle Fuel (diesel & gas) with contribution to Variable <strong>Operating</strong><br />
(2,826)<br />
Stabilization reserve.<br />
4 Vehicle Fuel (diesel & gas) adjustment for volume 1,316<br />
5 <strong>Regional</strong> Transportation Planning 480<br />
6 Office costs, supplies, materials, vehicle expenses, equipment and<br />
1,125<br />
communications and other goods & services<br />
7 External Services - Contract increases Solid Waste 3,198<br />
8 Transit Revenue (Buses and Ferries) (1,014)<br />
9 External Services - Contract increase Traffic Maintenance 68<br />
10 Debt (Interest & Principal) 1,038<br />
11 Other Fiscal-Trans to/from Capital & Prior Year surplus/deficit (767)<br />
12 Fleet and other interdepartmental 265<br />
13 Area rate, rental/lease and other revenue (6,279)<br />
14 Corporate reductions (343)<br />
15 Business Unit reductions (3,135)<br />
2010/11 Budget 97,082<br />
O5
<strong>Halifax</strong> <strong>Regional</strong> <strong>Municipality</strong><br />
2010/11 Business Plans and Budget (Proposed) Transportation and Public Works<br />
Key Challenges and Opportunities<br />
The following challenges and opportunities will have an impact on the Business Unit between<br />
the 2010-2015 time frame.<br />
Challenges with Community-wide Impact:<br />
These are challenges or opportunities which affect the entire HRM Region, and which the<br />
Business Unit plays a role in influencing or addressing the outcome. Multiple business units may<br />
be involved in addressing the issue.<br />
Challenges:<br />
• Growing demand for provision of services: There is a significant gap between citizen<br />
expectations and the services that can and should be reasonably provided. TPW must<br />
continue to focus on improving communication with the public about its services and the<br />
standard to which they are provided. Responding to the citizen in a timely manner remains a<br />
challenge due to the high volume of requests that are received, particularly during times when<br />
staff are focussed on providing the service (i.e. during a snow storm response). Being able to<br />
better manage expectations and respond to the citizen based requests in a timely and reliable<br />
manner is crucial to successful service delivery.<br />
• Attraction and retention of required workforce: HRM, as well as other public and private<br />
organizations, is facing significant challenges in attracting and retaining the qualified<br />
workforce needed for service delivery. This is an issue that will only further degenerate as<br />
more and more employees retire and organizations compete for the same limited pool of<br />
human resources. Currently there are key professional and trade designations that are already<br />
significantly depleted. In the absence of effective workforce attraction and retention<br />
strategies the ability to deliver timely, quality services will be diminished over time.<br />
• Global economic uncertainty: HRM has a number of key commodities that can be affected<br />
by the current economic uncertainty, such as fuel, business lot sales, and sale of recyclable<br />
materials.<br />
Opportunities:<br />
• Strategic Transportation Funding and The New Deal for Cities: The additional funding<br />
provided by these two federal programs to Metro Transit and for transportation<br />
improvements will help to integrate HRM’s transit and transportation systems making them<br />
safer and more efficient while focussing on being more environmentally responsible.<br />
• Strategic External Partnerships: TPW will continue to develop and foster partnerships<br />
with external groups such as: Nova Scotia Community College (NSCC), Dartmouth<br />
Crossing, Community Fields, community trails groups, business park associations, Business<br />
Improvement Districts (BID’s), universities, Heritage Gas, and Conserve Nova Scotia to<br />
O6
<strong>Halifax</strong> <strong>Regional</strong> <strong>Municipality</strong><br />
2010/11 Business Plans and Budget (Proposed) Transportation and Public Works<br />
name a few. Through these partnerships TPW can leverage their services to enhance delivery<br />
to the general public.<br />
• Business Park Operations: TPW will continue to work collaboratively with Community<br />
Development to implement the Business Park Functional Plan recommendations approved in<br />
principle by <strong>Regional</strong> Council. The various elements of plan implementation will create a<br />
more predictable and comprehensively planned business park program necessary to support<br />
the <strong>Municipality</strong>’s regional plan and economic strategies.<br />
Challenges with Service Delivery / Business Unit Impact<br />
These are issues which affect the business unit’s ability to deliver services (both internally and<br />
externally).<br />
Challenges:<br />
• Succession Planning: Over 47% of TPW’s workforce is able to retire in the next 5 to 6<br />
years. Combined, these employees have substantial operational and corporate knowledge<br />
which could be lost if steps are not taken to develop and train new and existing staff to<br />
replace the retiring staff. The potential drain of information must be recognized as a potential<br />
critical loss to the organization; however, it is one which can be managed with appropriate<br />
planning and employee development in advance of retirements.<br />
• Balancing Resources and Service Expectations: There is a growing imbalance between the<br />
public service expectations and the capacity to provide the expected service with existing<br />
resources and funds. Successful management of this situation remains a significant challenge<br />
to TPW’s ability to provide excellent customer service.<br />
• Expectations of modern workplace: With succession planning, greater performance<br />
measurement expectations, and the requirements of the attendance support program, there are<br />
greater expectations now placed on our front line leaders. Training, process development, and<br />
the establishment of a series of standard operating practices will be required to help manage<br />
through this time. Alternative workforce opportunities need to be evaluated to meet the needs<br />
of today’s increasingly diverse workforce.<br />
• Improvement in security of Non-Inventoried Assets: TPW is responsible for the safe and<br />
secure operation of HRM owned buildings and facilities. TPW, as the largest operational<br />
unit, requires the utilization of a significant amount of non-inventoried assets. Despite some<br />
improvements in building control initiatives and safeguarding assets, HRM continues to be at<br />
risk in these areas. TPW must manage its resources with due diligence and take appropriate<br />
measures to safeguard the assets according to baseline security requirements and continuous<br />
security risk management.<br />
O7
<strong>Halifax</strong> <strong>Regional</strong> <strong>Municipality</strong><br />
2010/11 Business Plans and Budget (Proposed) Transportation and Public Works<br />
• Sustainable Environment Initiatives and Policy: TPW operations encompass a significant<br />
number of activities that are included in the Provincial Environmental Goals and Sustainable<br />
Prosperity Act which will require development and implementation of policy and programs to<br />
meet legislative requirements. TPW must engage industry and stakeholders to establish a<br />
strategic framework for meeting those targets.<br />
Opportunities:<br />
• Improved Utilization of Municipal Operations Staff: There is a current initiative<br />
underway whereby Municipal Operations staff will better utilize their developed skills<br />
through the completion of specific capital project work. Municipal Operations staff will be<br />
engaged to construct several sidewalk renewal projects and playground installation work.<br />
This initiative is a continuation from 2007/08, which was very successful and is proving to be<br />
a rewarding experience for staff while improving the utilization of available in-house<br />
resources.<br />
• Automated Vehicle Locator (AVL) system in Municipal Operations: This tool, if<br />
managed properly, promises to enable improvements in areas such as snow and ice removal,<br />
equipment usage, anti-idling, and work performance.<br />
• Customer Relationship Management: There is an improved focus in the area of customer<br />
relationship management throughout the organization. As a result of process and system<br />
improvements, TPW has the capability to report more objectively on its provision of services<br />
to the citizens while monitoring overall performance. Internally, TPW has set a goal of<br />
achieving its service standard 90% of the time when responding to service calls. There should<br />
be noticeable improvements throughout TPW’s management units resulting from this<br />
initiative. Metro Transit’s trip planner service will be introduced utilizing the Google Trip<br />
Planner application.<br />
• Work Management Project: This initiative will increase efficiency and effectiveness of<br />
demand and planned work in Municipal Operations, Traffic and Right of Way and Metro<br />
Transit. The initiative will include the approval of new service standards based on street<br />
classification and the implementation of a Road Patrol program similar to the Ontario<br />
Minimum Maintenance Standards developed by the Ontario Good Roads Association.<br />
Proactive identification of hazards in the right of way will allow better operational planning<br />
and improved service delivery.<br />
• Asset Repair and Replacement: As part of the municipality compliance requirements under<br />
the public sector accounting practices, a portion of building repair and replacement work<br />
normally carried out under the capital budget program, will be delivered by operations staff.<br />
It is expected that this collaborative approach to routine repair, replacement, and<br />
commissioning of certain work within Real Estate and Facility Services will increase<br />
efficiency and effectiveness of demand and planned work in buildings managed and operated<br />
by Facility Services<br />
O8
<strong>Halifax</strong> <strong>Regional</strong> <strong>Municipality</strong><br />
2010/11 Business Plans and Budget (Proposed) Transportation and Public Works<br />
Business Unit Goals<br />
The goals for Transportation and Public Works are:<br />
Goal 1:<br />
Goal 2:<br />
Goal 3<br />
Goal 4:<br />
Goal 5:<br />
Goal 6:<br />
Goal 7:<br />
Goal 8:<br />
Goal 9:<br />
Attract, develop and retain a quality workforce<br />
Continually improve an effective transportation and public works department<br />
Well managed, modern transit system meeting citizen transportation needs<br />
Achieve fiscal, social, environmental and cultural sustainability targets<br />
Infrastructure management strategies implemented in support of long-term growth<br />
Deliver an efficient sustainable resource oriented solid waste program<br />
Prepared Emergency Management<br />
Provide operational support to Special Events<br />
Meet Internal Service Expectations<br />
Goal 1:<br />
Attract, develop and retain a quality workforce<br />
Corporate Strategy Linkage:<br />
Executive Management Team (EMT) Priority - Employer of Choice<br />
Description:<br />
TPW provides a wide range of public services which requires a diverse workforce with a variety<br />
of skills, abilities and technical knowledge. In order to become a workplace of choice within<br />
HRM, TPW needs to understand all the workplace considerations necessary to attract, train, and<br />
retain capable staff. Being able to create the conditions for success for individuals will enable<br />
the entire workforce to meet the growing responsibilities associated with the provision of<br />
municipal services. This is achieved by ensuring staff are best positioned to provide quality<br />
service now and into the future. TPW is able to provide multiple employment development<br />
opportunities to employees based on the diversity of skills required and the variety of services<br />
provided which demonstrates the commitment to continuous learning within the workplace.<br />
These improvements will result in a high performing workplace that attracts and retains quality<br />
employees.<br />
O9
<strong>Halifax</strong> <strong>Regional</strong> <strong>Municipality</strong><br />
2010/11 Business Plans and Budget (Proposed) Transportation and Public Works<br />
Goal 1:<br />
Attract, develop and retain a quality workforce<br />
Objectives for 2010/2011:<br />
Outcome: A workplace of choice where staff are empowered and accountable<br />
All of TPW<br />
TPW 1.1<br />
TPW 1.2<br />
TPW 1.3<br />
TPW 1.4<br />
TPW 1.5<br />
TPW 1.6<br />
TPW 1.7<br />
Implementation of EMT’s Employer of Choice Initiatives including:<br />
• Human Resources People Plan<br />
• Workforce Planning<br />
• Improvement of internal communications<br />
• Enhanced Leadership development<br />
Use Attendance Support Program to reduce Workers Compensation Board,<br />
Sick leave and Long Term Disability usage within each management unit<br />
Ensure timely employee performance development plan review<br />
Provide a healthy, professional, clean, safe, respectful, and positive work<br />
environment for all employees<br />
Employee Engagement<br />
• Hold an Employee Appreciation Day<br />
• Each management unit to conduct ‘Leadership Forum’ at not lower<br />
than Superintendent level<br />
• Better formalize Business Unit rewards and recognition<br />
• Continue to focus on competencies for front line supervisors<br />
Promote TPW as a workplace of choice through various job fair<br />
opportunities<br />
Continue to recognize staff through the Employee Recognition Committee<br />
TPW 1.8 Identify up to five key positions targeted for leadership opportunities for<br />
improved succession planning and employee development<br />
Outcome: Enhance Frontline Transactional capacity within the workplace<br />
All of TPW<br />
TPW 1.9 Support the development of a corporate HRM training database that will<br />
improve the reporting and evaluation of training and development<br />
initiatives implemented in TPW<br />
Corporate Fleet Services<br />
TPW 1.10 Work with the Department of Education and Advance Training to increase<br />
the number of Apprentices relative to the number of Journeymen in the<br />
workplace<br />
Municipal Operations<br />
TPW 1.11<br />
Metro Transit<br />
Develop skill sets of seasonals/students to prepare them for future<br />
employment with HRM<br />
O10
<strong>Halifax</strong> <strong>Regional</strong> <strong>Municipality</strong><br />
2010/11 Business Plans and Budget (Proposed) Transportation and Public Works<br />
TPW 1.12 Develop & Implement a continuous training program for Service<br />
Supervisors to develop new skills in an ever changing environment<br />
Outcome: A representative workplace that values diversity<br />
All of TPW<br />
TPW 1.13 Incorporate strategies to develop and retain a skilled and diverse workforce<br />
to maintain effective service delivery<br />
TPW 1.14 Pursue opportunities with community groups who promote non-traditional<br />
workforce<br />
Objectives for the next 3-5 years:<br />
TPW 1.15<br />
TPW 1.16<br />
TPW 1.17<br />
TPW 1.18<br />
TPW 1.19<br />
Planned training and development opportunities that meet the existing and<br />
future needs of employees, which include two professional development<br />
and/or training seminars in each management unit within the fiscal year<br />
Individualized training and development plans to improve skills, abilities<br />
and knowledge<br />
Develop an integrated succession plan for TPW employees addressing<br />
future skills and leadership gaps<br />
Introduce and encourage development of appropriate leadership<br />
competencies for front line supervisors as designed by Human Resources<br />
Develop recruitment and retention strategy for professional and technical<br />
staff<br />
Goal 2:<br />
Continually improve an effective transportation and public<br />
works department<br />
Corporate Strategy Linkage:<br />
Community Outcome – Integrated and Affordable Transportation Networks<br />
EMT Priority - Service Delivery, Fiscal Responsibility<br />
Description:<br />
Focussing on the continual improvement of TPW will enable the conditions for success, now and<br />
into the future. Aligning costs with services, reducing duplication, and improving cost recovery<br />
will enable the necessary environment to provide Council with the tools to make informed<br />
decisions with respect to the level and types of services provided by TPW. Taking the time to<br />
investigate best practices and to implement new options for service delivery, when feasible, will<br />
result in innovative approaches to continuously increase efficiency and effectiveness of service<br />
delivery and operations.<br />
O11
<strong>Halifax</strong> <strong>Regional</strong> <strong>Municipality</strong><br />
2010/11 Business Plans and Budget (Proposed) Transportation and Public Works<br />
Goal 2:<br />
Continually improve an effective transportation and public<br />
works department<br />
Objectives for 2010/2011:<br />
Outcome: Performance based Operations<br />
All of TPW<br />
TPW 2.1 Improve AVL utilization at the front line supervisor level for performance<br />
measurement and administration of TPW vehicle anti-idling policy<br />
Municipal Operations<br />
TPW 2.2<br />
TPW 2.3<br />
TPW 2.4<br />
TPW 2.5<br />
Review/revise asphalt specifications in partnership with Infrastructure and<br />
Asset Management Services (IAMS) Design & Construction to develop a<br />
construction manual for best practices and methodologies including the use<br />
of environmentally friendly products<br />
In partnership with other internal business units and external stakeholders,<br />
continue to review and update the Municipal Services Guidelines (Red<br />
<strong>Book</strong>)<br />
Contribute to the development of an operational procedure manual for all<br />
supervisors in Municipal Operations<br />
Develop & tender Snow & Ice performance contracts<br />
TPW 2.6 HRM operational staff utilized to deliver parks, sportsfields/playground<br />
and street sidewalk capital projects<br />
Real Estate and Facility Services<br />
TPW 2.7<br />
TPW 2.8<br />
TPW 2.9<br />
TPW 2.10<br />
TPW 2.11<br />
TPW 2.12<br />
Provide additional contract supervision and management services within<br />
Real Estate and Facility Services for building related maintenance<br />
Grow the Building Services Technician complement to improve the annual<br />
inspection plan for facilities, including an expansion of services to those<br />
operated under management agreements<br />
Contribute to the development of an operational procedure manual for all<br />
supervisors in Real Estate and Facility Services<br />
Continue to introduce performance based contracts for Custodial, Snow<br />
and Ice, and Mechanical Services, as well as increasing economies of scale<br />
through bulk purchasing power<br />
Expand the use of performance based service level agreements to facility<br />
client groups<br />
Continue to invest in gas conversions and energy initiatives that provide<br />
increased performance and operating efficiencies at HRM buildings<br />
Outcome: Effective relationships built with external and internal stakeholders and partners<br />
All of TPW<br />
TPW 2.13<br />
Continue to develop Service Level Agreements (SLAs) with both internal<br />
and external partners<br />
O12
<strong>Halifax</strong> <strong>Regional</strong> <strong>Municipality</strong><br />
2010/11 Business Plans and Budget (Proposed) Transportation and Public Works<br />
Outcome: Focus on service delivery improvement initiatives<br />
All of TPW<br />
TPW 2.14 Evaluation of the Work Management Project<br />
• Council approval of road based service response standards<br />
• Continue road patrols in accordance with street classification<br />
hierarchy<br />
TPW 2.15 Develop and implement a vehicle and equipment accident /incident review<br />
committee and policy for TPW (except Metro Transit)<br />
Traffic & Right of Way Services<br />
TPW 2.16 Upgrade controllers and traffic signal equipment on specific corridors to<br />
improve efficiency and traffic coordination<br />
Outcome: HRM assets secured and safeguarded<br />
All of TPW<br />
TPW 2.17<br />
TPW 2.18<br />
Conduct a full inventory of keys, tools and equipment currently in use and<br />
establish a process for the sign out and confirmation, in writing, of the<br />
assignment of responsibility and accountability for the care and keeping of<br />
the items<br />
Develop strategies to control use of vehicles to ensure their security<br />
TPW 2.19 Review and revise Business Unit Safety Governance to include: Joint<br />
Occupational Health and Safety (JOHS) Committees, accident reporting<br />
and monitoring and contractor language<br />
Outcome: Improve citizen awareness of and satisfaction with TPW Services<br />
All of TPW<br />
TPW 2.20<br />
TPW 2.21<br />
TPW 2.22<br />
Real Estate and Facility Services<br />
Develop interactive web based information on TPW services and<br />
initiatives<br />
Improve Public awareness of service standards and accomplishments<br />
through improved marketing and public relations<br />
Respond to citizen based requests within established corporate standards<br />
90% of the time<br />
TPW 2.23 Develop acquisition and disposal process to include enhanced<br />
communication/process for public property acquisition<br />
Outcome: Critical operational vehicles and equipment are available for core services<br />
Corporate Fleet Services<br />
TPW 2.24 Stream line work processes to align with new operating software. The<br />
focus is to create efficiencies and reduce costs<br />
Objectives for the next 3-5 years:<br />
TPW 2.25<br />
Move of Fleet Garage from Turner Drive to Thornhill Drive, to enhance<br />
service and cure operational shortcomings<br />
O13
<strong>Halifax</strong> <strong>Regional</strong> <strong>Municipality</strong><br />
2010/11 Business Plans and Budget (Proposed) Transportation and Public Works<br />
TPW 2.26<br />
TPW 2.27<br />
TPW 2.28<br />
TPW 2.29<br />
TPW 2.30<br />
Implement AVL system for entire TPW general fleet and winter contracted<br />
vehicles<br />
Install vehicle weigh scales at depots for Salt Management (3-5 years)<br />
Cost/benefit analysis of contracted intrusion alarm monitoring costs, false<br />
alarm costs, and intrusion system upgrades required to coordinate and<br />
monitor all intrusion alarms internally<br />
Develop effective vehicle usage recording system for operations activity<br />
charge backs, monitoring vehicle usage and unit costs of operation, and<br />
recording operator vehicle usage. (3 -5 years if ICT project is required)<br />
Corporate Fleet, work with client to review and update vehicle tender<br />
specifications<br />
Goal 3:<br />
Well managed, modern transit system meeting citizen<br />
transportation needs<br />
Corporate Strategy Linkage:<br />
Community Outcome – Integrated and Affordable Transportation Networks<br />
Council Focus Area – Transportation, Public Safety, Infrastructure<br />
EMT Priority - Service Delivery<br />
Description:<br />
Transit systems and services are a current growth area for larger municipalities. With funding<br />
improvements both federally and provincially there is significant focus on this necessary public<br />
service. Metro Transit has responded well to its continued, unprecedented growth and has made<br />
significant improvements to the level of service provided to the citizens. The commitment over<br />
the next three to five years is to continue to match service improvements and expansions that best<br />
meet the highest priority needs of the citizens of HRM. In addition, Metro Transit will continue<br />
to improve the passenger experience through passenger facility upgrades and access to real time<br />
route servicing information.<br />
Goal 3:<br />
Well managed, modern transit system meeting citizen<br />
transportation needs<br />
Objectives for 2010/2011:<br />
Outcome: Improve Operational Efficiency & Effectiveness<br />
Metro Transit<br />
TPW 3.1<br />
TPW 3.2<br />
Develop new vehicle specifications and criteria for Access-a-Bus and<br />
HIAA MetroX vehicles<br />
Increase annual ferry revenue by reducing the duration of the ferry dry-dock<br />
process<br />
O14
<strong>Halifax</strong> <strong>Regional</strong> <strong>Municipality</strong><br />
2010/11 Business Plans and Budget (Proposed) Transportation and Public Works<br />
TPW 3.3 Improve quality of conventional buses through planned replacement of 5<br />
articulated buses<br />
TPW 3.4 Conduct Ferry Terminal Condition Assessment & Risk Mitigation Plan<br />
TPW 3.5<br />
TPW 3.6<br />
Conduct a minimum of 6 Mid-life Bus Rebuilds<br />
Replace 2 service vehicles for improved operations.<br />
TPW 3.7 Improve quality of Access-A-Bus vehicles through phase replacement to 8<br />
vehicles<br />
TPW 3.8 Rebrand final ferry vessel<br />
TPW 3.9 Employee Performance Management Module of Hastus Enterprise System.<br />
RGI, OA and ICT approval by end of Fiscal Year<br />
TPW 3.10 DV/DC fully implemented by Jan/11. Fully implement Daily<br />
Vehicle/Daily Crew modules of Hastus Enterprise System for January 2011<br />
for go live date<br />
TPW 3.11 Implement, test, measure key performance indicators (KPI's) in 1010/11<br />
with set targets established in 2011/12<br />
Outcome: Improved transit system safety and security<br />
Metro Transit<br />
TPW 3.12<br />
TPW 3.13<br />
TPW 3.14<br />
TPW 3.15<br />
TPW 3.16<br />
TPW 3.17<br />
Strategic Transportation Planning<br />
TPW 3.18<br />
Outcome: Improve Customer Service<br />
Metro Transit<br />
TPW 3.19<br />
TPW 3.20<br />
TPW 3.21<br />
Enhanced security at Sackville, Portland Hills, Bridge, and Lacewood<br />
Terminals for customers & Operators by the replacement of existing or<br />
installation of new high resolution video surveillance equipment as a<br />
deterrent to improper activity and to allow for improved facial recognition<br />
of individuals involved in incidents<br />
Investigate turnstiles at Ferry Terminals to enhance safety system<br />
improvements<br />
Improve safety by monitoring and evaluating the completion of pre-trip<br />
inspection of buses<br />
Develop & Introduce an Accident Adjudication Process for all Metro<br />
Transit vehicles<br />
Introduce a Safety Data Tracking System<br />
Ensure all driver abstracts ad licence verifications are current<br />
Provide ongoing support for development of Transit Park and Ride<br />
facilities<br />
Continued focus on accessible landing pads<br />
Undertake System Accessibility Study<br />
Introduce a Customer Threat Awareness Program - "if you see it, say it"<br />
O15
<strong>Halifax</strong> <strong>Regional</strong> <strong>Municipality</strong><br />
2010/11 Business Plans and Budget (Proposed) Transportation and Public Works<br />
TPW 3.22<br />
TPW 3.23<br />
TPW 3.24<br />
Introduce a Customer Etiquette Program - strollers, backpacks, coffee, etc.<br />
Design and introduce a Customer Satisfaction Survey process<br />
Improve responsiveness to customer inquiries and complaints<br />
Outcome: Promote Culture Shift Through Organizational Development<br />
Metro Transit<br />
TPW 3.25<br />
TPW 3.26<br />
TPW 3.27<br />
Implement 2 year objectives of Continuous Operator Training and<br />
Development Program (3 Year Rolling Cycle)and investigate including a<br />
Threat Analysis component<br />
Implement a structured program to evaluate and provide feedback of new<br />
Operators by conducting probationary interviews, ride checks and formal<br />
Driver evaluations<br />
Develop Transit Security By-Law<br />
TPW 3.28 Enhanced support for operators through: improved access to Employee<br />
Services Supervisors by reducing span of control (1to 90); improved post<br />
incident intervention; on board ride alongs and new operational structure<br />
TPW 3.29 Expand Operator washroom facilities availability at key terminals –<br />
Highfield Park Terminal & Bridge Terminals<br />
TPW 3.30 Improve supervisory span of control for Operators<br />
TPW 3.31 Work with HR to develop a comprehensive wellness approach to<br />
attendance/case management<br />
Outcome: Expand Service<br />
Metro Transit<br />
TPW 3.33<br />
TPW 3.34<br />
TPW 3.35<br />
Commissioning and operate RLTC (Ragged Lake Transit Centre).<br />
Improve Access-a-Bus service to clients through planned expansion of up<br />
to 6 vehicles.<br />
Conversion of Routes 2 & 3 to fully Accessible Low Floor routes<br />
TPW 3.36 Improve conventional service through planned expansion of 10 articulated<br />
Novas<br />
TPW 3.37 Complete design for 4 th ferry completed and submit to Transport Canada by<br />
end of Fiscal Year<br />
TPW 3.38 Bridge Terminal construction complete by August 2010<br />
TPW 3.39 Lacewood Terminal siting and design complete, and construction<br />
tendered by late 2010<br />
Objectives for the next 3-5 years: Construct & Build<br />
TPW 3.40<br />
TPW 3.41<br />
Lacewood Terminal construction and implementation<br />
Identify and implement new technologies that support improved<br />
Operations and Employee self-service processes<br />
O16
<strong>Halifax</strong> <strong>Regional</strong> <strong>Municipality</strong><br />
2010/11 Business Plans and Budget (Proposed) Transportation and Public Works<br />
TPW 3.42<br />
TPW 3.43<br />
Research and implement farebox technology to reduce fare disputes<br />
between Operators and customers<br />
Research opportunities for implementation of Stop Annunciation Services<br />
on all buses<br />
Goal 4:<br />
Achieve fiscal, social, environmental and cultural<br />
sustainability targets<br />
Corporate Strategy Linkage:<br />
Community Outcome – Economic Prosperity<br />
EMT Priority - Service Delivery, Fiscal Responsibility<br />
Description:<br />
In support of the overall corporate movement toward a more “green” corporate culture, TPW is<br />
committed to incorporating sustainable service practices wherever possible. As the HRM<br />
business unit with the largest workforce and greatest use of both service and transit vehicles, the<br />
commitment to being more environmentally, fiscally, socially and culturally conscious will have<br />
substantial impacts both on the organization and as a demonstration of leadership to our citizens.<br />
TPW is also responsible for providing alternative transportation options combined with an<br />
efficient transportation system and active transportation options improving the opportunities for<br />
alternative transportation.<br />
Goal 4:<br />
Achieve fiscal, social, environmental and cultural<br />
sustainability targets<br />
Objectives for 2010/2011:<br />
Outcome: Implement sustainable service practices<br />
All of TPW<br />
TPW 4.1<br />
Develop Performance Measurement Framework<br />
TPW 4.2 Develop Plan for source separation of waste collection programs at all<br />
HRM facilities/infrastructure/public spaces<br />
Municipal Operations<br />
TPW 4.3<br />
Branding of sportfields<br />
Service Delivery & Quality Improvement (SDQI)<br />
TPW 4.4 Assist Management sections to identify performance measures, develop<br />
service standards and use measurement tools<br />
Outcome: Increased use of efficient, affordable and diverse transportation and environmental<br />
options<br />
All of TPW<br />
O17
<strong>Halifax</strong> <strong>Regional</strong> <strong>Municipality</strong><br />
2010/11 Business Plans and Budget (Proposed) Transportation and Public Works<br />
TPW 4.5<br />
Traffic & Right of Way Services<br />
TPW 4.6<br />
Implement and monitor operating procedures for permissible idling<br />
Convert conventional traffic signals to LEDs<br />
TPW 4.7 Implement the amendments to the Streets By-Law S-300<br />
TPW 4.8<br />
Fleet Services<br />
TPW 4.9<br />
TPW 4.10<br />
Metro Transit<br />
TPW 4.11<br />
Strategic Transportation Planning<br />
Convert 2000 conventional street lights with LED cut-off lights<br />
Work with Engineered Machine Products and the HRM Sustainable<br />
Environment Management Office on the Mini Hybrid project seeking to<br />
potentially expand use of these vehicles within the Transit Fleet<br />
Presently fleet has identified re-usable materials such as oil, oil filters, and<br />
tires. Fleet will review the other materials it uses to see if there are<br />
opportunities to advance this process and recycle all re-usable equipment<br />
Reduce idling of transit buses with Webasta heaters<br />
TPW 4.12 Develop Smart Trip, a program of commuter trip reduction, through<br />
implementation of transportation demand management principles<br />
Objectives for the next 3-5 years:<br />
TPW 4.13<br />
TPW 4.14<br />
Near term plan to role out multi-stream waste collection infrastructure<br />
across all HRM facilities, public spaces and recreational facilities<br />
Near term plan to implement By-Law S-600 practices across all HRM<br />
corporate operations, properties and facilities<br />
Goal 5: Infrastructure management strategies implemented in<br />
support of long-term growth<br />
Corporate Strategy Linkage:<br />
Council Focus Area - Infrastructure<br />
EMT Priority - Fiscal Responsibility<br />
Description:<br />
With the increased level of awareness of the Asset Management project and Council Focus Area<br />
of Infrastructure, HRM is making considerable progress in the area of infrastructure planning. A<br />
more formal separation of recapitalization and capability projects will help guide improvements<br />
in capital planning. Eventually the asset management project will establish guidelines for the<br />
recapitalization of its assets and asset classes. The development of a five year capital plan for<br />
capability and recapitalization projects that focuses on outcomes will assist in the decision<br />
making process, aligning resources with the identified requirements.<br />
O18
<strong>Halifax</strong> <strong>Regional</strong> <strong>Municipality</strong><br />
2010/11 Business Plans and Budget (Proposed) Transportation and Public Works<br />
Goal 5:<br />
Infrastructure management strategies implemented in<br />
support of long-term growth<br />
Objectives for 2010/2011:<br />
Outcome: Participate in the development & implementation of the long term capital<br />
infrastructure plan objectives<br />
All of TPW<br />
TPW 5.1 Provide support and assistance to IAM in the furtherance of the Asset<br />
Management project, including development and implementation of<br />
revised business processes and asset commissioning<br />
TPW 5.2 Improvements to Street Maintenance Directory for detailed private<br />
/unaccepted road maintenance, snow &ice priority levels, sanding /salting<br />
delineation and street lengths ( review-2010, implement 3-5 yrs)<br />
Municipal Operations<br />
TPW 5.3 Implement strategies on street management system to ensure appropriate<br />
snow management practices<br />
Real Estate and Facility Services<br />
TPW 5.4 Implement strategies and recommendations of the Business Park<br />
Functional Plan to ensure timely and effective management practices for<br />
park development<br />
TPW 5.5 Provide support and assistance with the Central Library funding strategy,<br />
specifically the marketing and disposal of the residual lands at Spring<br />
Garden, Clyde and Queen, including development and implementation of a<br />
disposal process and asset transactions and conveyances<br />
TPW 5.6 To provide support and assistance to IAM/CD in the furtherance of the<br />
arena capacity study project.<br />
Traffic & Right of Way Services<br />
TPW 5.7 Implement alternative traffic strategies and system capacity increases<br />
• Main Street widening (MacLaughlin Road to Wilfred Jackson Way)<br />
• Glendale/Old Beaverbank Road - left turn lane<br />
• Glendale/ Smokey – left turn lane<br />
• Norman Newman/ Eisener – right turn lane<br />
Solid Waste Resources<br />
TPW 5.8<br />
TPW 5.9<br />
Implement recapitalization plan for the Materials Recycling Facility (MRF)<br />
Implement recapitalization plan for two Source Separated Composting<br />
Facilities (SSCF) in support of increasing both capacity and process<br />
maturity end-state<br />
O19
<strong>Halifax</strong> <strong>Regional</strong> <strong>Municipality</strong><br />
2010/11 Business Plans and Budget (Proposed) Transportation and Public Works<br />
TPW 5.10 Implement recapitalization plan for Otter Lake facility, to include Waste<br />
Stabilization Facility (WSF) structural and roof project, ongoing cell<br />
construction, cell capping and landfill gas management systems and<br />
equipment replacement<br />
Strategic Transportation Planning<br />
TPW 5.11 Complete the Roadway Network and Transportation Demand Management<br />
Functional Plans<br />
TPW 5.12 Revitalize discussions with the Province regarding a Capital Transportation<br />
Authority<br />
TPW 5.13 Develop a Council and public education program around how the various<br />
transportation elements of the <strong>Regional</strong> Plan work together (e.g. Active<br />
Transportation, Transit Functional Plan/5-Year Approach to Transit,<br />
Roadway Network Optimization Plan, etc.)<br />
Outcome: Business Park development in support of economic growth<br />
Real Estate and Facility Services<br />
TPW 5.14<br />
TPW 5.15<br />
TPW 5.16<br />
TPW 5.17<br />
TPW 5.18<br />
Continue supporting the joint business relationship with Greater <strong>Halifax</strong><br />
Partnership with respect to marketing and developing regional business<br />
parks<br />
Work with Business Parks groups to bring to market serviced industrial lots<br />
in line with projected demand<br />
Continue to support the Atlantic Gateway - <strong>Halifax</strong> Logistics Park to<br />
support development of the Gateway initiative<br />
Implement Business Park Function Plan (BPFP) for Burnside and Bayer’s<br />
Lake to support continued growth, development, and delivery of industrial<br />
lands with HRM<br />
Improve HRM web page as a sales tool<br />
TPW 5.19 Hold regular sessions with area Councillors with respect to business park<br />
development activity and trends<br />
TPW 5.20 Complete key economic stimulus projects for the Business Parks - North<br />
Dartmouth Trunk Sewer Burnside and the Washmill Lake/102 underpass to<br />
Bayers Lake<br />
Objectives for the next 3-5 years:<br />
TPW 5.21<br />
TPW 5.22<br />
TPW 5.23<br />
Develop and maintain geospatial asset inventories for all infrastructure<br />
groups maintained by TPW<br />
Implement asset management work order system for tracking all capital and<br />
operating costs against specific assets<br />
Improvements to Street Maintenance Directory for detailed private<br />
/unaccepted road maintenance, snow & ice priority levels, sanding /salting<br />
delineation and street lengths (Operational Review-2010 ,Implement 3-5<br />
yrs)<br />
O20
<strong>Halifax</strong> <strong>Regional</strong> <strong>Municipality</strong><br />
2010/11 Business Plans and Budget (Proposed) Transportation and Public Works<br />
Goal 6<br />
Deliver an efficient sustainable resource oriented solid<br />
waste program<br />
Corporate Strategy Linkage:<br />
EMT Priority - Service Delivery, Fiscal Responsibility<br />
Description:<br />
HRM has a world recognized solid waste program. Provincial Environmental Goals and<br />
Sustainable Prosperity Act (EGSPA) requirements require a further significant increase in<br />
diversion of materials from the landfill. HRM’s program of source separated recycling and<br />
composting is somewhat mature. Optimizing and expanding upon opportunities to further<br />
enhance diversion will require further measures to meet the 2015 target of 300 kg/capita disposal<br />
of waste/year. HRM must therefore introduce new technology and programs to increase the<br />
diversion of re-usable material in some form of energy recovery, bio-chemical or biofuels model,<br />
and find new markets for recyclable materials. HRM must also increase its composting capacity<br />
and continue to advance and enhance participation in the source-separated recycling program<br />
across the residential and Industrial, Commercial and Institutional (ICI) sectors. To achieve the<br />
EGSPA goal, HRM must work internally with other BU’s in setting the example within HRM<br />
and externally with both public and private sector stakeholders and partners, including the<br />
identification of new partners. This effort will require development and implementation of new<br />
programs, technology and policy to support those initiatives.<br />
Goal 6:<br />
Deliver an efficient sustainable resource oriented solid<br />
waste program<br />
Objectives for 2010/2011:<br />
Solid Waste Resources<br />
TPW 6.1<br />
TPW 6.2<br />
TPW 6.3<br />
TPW 6.4<br />
TPW 6.5<br />
TPW 6.6<br />
Complete comprehensive analysis of current composting maturity states to<br />
evaluate ability to meet new Canadian Council of Ministers of the Environment<br />
(CCME) and NS composting guidelines in support of assessments of technology<br />
and/or operational adjustments to achieve compliance<br />
Complete comprehensive molecular characterization analysis of existing residual<br />
waste streams destined for landfill in support of technology assessments for new<br />
programs<br />
Expand existing education and compliance operations across both residential and<br />
ICI sectors<br />
Develop framework with stakeholders for a strategic plan to achieve<br />
Environmental Goals and Sustainable Prosperity Act (EGSPA) targets for<br />
2015<br />
Negotiate renewal agreement for Otter Lake Waste Processing and Disposal<br />
Facilities<br />
Administer and monitor the diversion of Construction & Demolition materials<br />
(By-Law L-200)<br />
O21
<strong>Halifax</strong> <strong>Regional</strong> <strong>Municipality</strong><br />
2010/11 Business Plans and Budget (Proposed) Transportation and Public Works<br />
TPW 6.7<br />
TPW 6.8<br />
TPW 6.9<br />
TPW 6.10<br />
TPW 6.11<br />
TPW 6.12<br />
TPW 6.13<br />
TPW 6.14<br />
Monitor and support the prevention of the exportation of Industrial, Commercial<br />
& Institutional waste from HRM, except through intra municipal agreements<br />
Work with stakeholder partner in the production and sale of electricity at<br />
Highway 101 landfill<br />
Develop and manage an efficient program to deal with leachate from HRM Solid<br />
Waste Resource operational facilities, to include the exploration of utilizing<br />
Highway 101 Landfill site as a leachate treatment facility to meet HRM needs<br />
Enhance Solid Waste Resources compliance and enforcement operations across<br />
HRM<br />
Administer a Household Hazardous Waste (HHW) program which achieves the<br />
number of mobile depot events contained in the approved annual operating<br />
budget<br />
Monitor the HRM diversion rate with a focus on identifying new initiatives and<br />
opportunities to increase the rate<br />
Develop and implement Back-Yard Composter unit sale event<br />
Develop and implement Residential Curbside Give-Away Weekend Event<br />
TPW 6.15 Work with all Business Units to implement corporate compliance with By-Law<br />
S-600 at all HRM operations, sites, properties and facilities<br />
TPW 6.16 Deliver timely, quality and reliable collection services to the performance<br />
standards of the contracts<br />
TPW 6.17 Manage facility contracts and partnerships to ensure effective processing and<br />
marketing is maintained<br />
Objectives for the next 3-5 years:<br />
TPW 6.18<br />
TPW 6.19<br />
Identify and implement new technology/process/facility to meet HRM compost<br />
capacity and Provincial maturity state guidelines and negotiate contract changes<br />
with stakeholders<br />
Identify and implement new technology to increase landfill diversion rates to<br />
meet EGSPA target, to include assessment and confirmation of long-term plan<br />
for Otter Lake landfill (beyond 2024) and/or its successor site<br />
Goal 7:<br />
Prepared Emergency Management<br />
Corporate Strategy Linkage:<br />
Council Focus Area - Public Safety<br />
Description:<br />
TPW provides substantial assistance in the municipal response to emergencies primarily through<br />
the provision of its own assets or by leveraging assets of others to accommodate/assist victims of<br />
emergencies, as well as providing the direct services to the public in order to restore the<br />
<strong>Municipality</strong> to its pre-emergency state as soon as possible. As emergencies increase in<br />
complexity and affect more people, the expectation to respond in an efficient and immediate<br />
manner increases. The complexities of asset provision and delivery of services also therefore<br />
O22
<strong>Halifax</strong> <strong>Regional</strong> <strong>Municipality</strong><br />
2010/11 Business Plans and Budget (Proposed) Transportation and Public Works<br />
escalate. A well developed, planned response for addressing emergency situations will ensure<br />
that the citizens receive the necessary support and level of service needed to overcome the<br />
emergency.<br />
Goal 7:<br />
Prepared Emergency Management<br />
Objectives for 2010/2011:<br />
Outcome: Emergency Plan developed and implemented for TPW<br />
All of TPW<br />
TPW 7.1<br />
TPW 7.2<br />
TPW 7.3<br />
TPW 7.4<br />
TPW 7.5<br />
TPW 7.6<br />
Develop training plan for key EMO staff and take part in EMO sponsored<br />
exercises<br />
Re-write internal emergency response plan to focus on emergency<br />
management<br />
Participate in EMO joint planning initiatives and operations<br />
Develop an operational emergency management manual for each area<br />
directly involved with EMO operations including Transit, Municipal<br />
Operations, and Real Estate and Facility Services<br />
Complete a Business Continuity Plan and Emergency Preparedness Plan<br />
Participate and support the exploration of one response system for all HRM<br />
Public Safety Agencies during a multi-agency/multi-jurisdictional response<br />
Goal 8:<br />
Provide operational support to Special Events<br />
Corporate Strategy Linkage:<br />
Council Focus Area – Infrastructure<br />
Description:<br />
Each year HRM plays host to a number of events which include an annual Concert on the<br />
Commons. HRM must also prepare for the 2011 Canada Winter Games. TPW will be required<br />
to support the planning effort for the Games by providing the functional expertise of TPW staff<br />
in the area of traffic planning, transit planning, municipal operations, and Real Estate and Facility<br />
Services will be required in order to ensure a successful Winter Games.<br />
Goal 8:<br />
Provide operational support to Special Events<br />
Objectives for 2010/2011:<br />
Outcome: Support the needs of the 2011 Canada Winter Games<br />
All of TPW<br />
TPW 8.1<br />
Provide staff support and input into facility planning and development in<br />
support of the Games<br />
O23
<strong>Halifax</strong> <strong>Regional</strong> <strong>Municipality</strong><br />
2010/11 Business Plans and Budget (Proposed) Transportation and Public Works<br />
TPW 8.2<br />
TPW 8.3<br />
TPW 8.4<br />
Support the planning and management of capital projects in consideration<br />
of the Games requirements<br />
Work with staff and the Games Committee to develop transportation and<br />
facility strategies for the 2011 Winter Games and provide resources<br />
including fuel, bus operations, snow removal, etc.<br />
Support Canada Winter Games by absorbing costs for staff secondments<br />
TPW 8.5 Work with HRM Special Event Staff to develop and implement a solid<br />
waste source separated plan for the Canada Winter Games<br />
Outcome: Support the needs of Special Events<br />
All of TPW<br />
TPW 8.5<br />
TPW 8.6<br />
Work with HRM Special Events Staff to develop transportation strategies<br />
for each event<br />
Work with HRM Special Event Staff to develop and implement a solid<br />
waste source separated plan for all facilities and external sites<br />
Goal 9:<br />
Meet Internal Service and Partnership Expectations<br />
Corporate Strategy Linkage:<br />
Council Focus Area – Transportation, Public Safety, Infrastructure<br />
EMT Priority - Service Delivery<br />
Description:<br />
Support and participate in initiatives identified by other Business Units as agreed upon in the<br />
Business Planning cycle.<br />
Goal 9:<br />
Meet Internal Service Expectations<br />
Objectives for 2010/2011:<br />
TPW 9.1 Work with all HRM BUs in the development and implementation of BU source<br />
separated multi-unit receptacle programs and collection system in compliance<br />
with By-Law S-600 for all facilities, recreational areas and public venues<br />
TPW 9.2 Participate and support BPIM in the rollout of new desktop software , operating<br />
system upgrades, Privacy Policy Rollout and providing increased notice of<br />
Corporate Office moves<br />
O24
<strong>Halifax</strong> <strong>Regional</strong> <strong>Municipality</strong><br />
2010/11 Business Plans and Budget (Proposed) Transportation and Public Works<br />
TPW 9.3<br />
TPW 9.4<br />
TPW 9.5<br />
TPW 9.6<br />
TPW 9.7<br />
TPW 9.8<br />
TPW 9.9<br />
TPW 9.10<br />
TPW 9.11<br />
Participate and support various committees including:<br />
• Community Visioning<br />
• <strong>Regional</strong> Plan Advisory Committee<br />
• HRMby Design Steering Committee<br />
• Cogswell Master Plan Steering Committee<br />
• Long term arena strategy<br />
• Cole Harbour, Musquodoboit Harbour, Eastern Passage facility needs<br />
analysis<br />
• Dartmouth Sportsplex Steering Committee<br />
• New committees as identified to support ongoing facilities, facility<br />
projects and related matters<br />
• Communications Strategy<br />
• Multi year Financial Strategy<br />
• Employee Recognition Committee<br />
• Labour Management Committee<br />
Support Business Units in office moves and relocations by providing leadership<br />
role for space design, planning and execution. (Community Development,<br />
Finance<br />
Support Business Units in the roll out of new policies and compliance/audits of<br />
existing policies, including:<br />
• New finance policies<br />
• Hurricane Juan Audit<br />
• Property Tax and Rents per Management agreements<br />
• Duty to Accommodate<br />
• Substance Abuse Policy<br />
• Values and Ethics Policy<br />
Multi Year Financial Strategy<br />
Communication Strategy<br />
Provide input, participation and support for the Security Clearance Project<br />
Support Corporate Safety in meeting HRM’s obligations for compliance with<br />
Health and Safety Legislation<br />
Support and implement Workforce Planning model provided by HR<br />
Support and provide subject matter expertise for the implementation of<br />
Information, Communication & Technology Projects including:<br />
• ICT0740 Corporate HR training and Development Solution<br />
• Asset Management Decision Support Tool<br />
Provide input, participation and support for collective bargaining processes<br />
(NSUPE/ATU)<br />
Provide expertise to Infrastructure and Asset Management for assets condition<br />
assessment, rating and reporting (General and Facilities)<br />
O25
<strong>Halifax</strong> <strong>Regional</strong> <strong>Municipality</strong><br />
2010/11 Business Plans and Budget (Proposed) Transportation and Public Works<br />
TPW 9.12<br />
Participate and support IAM Facility Rationalization initiative by providing<br />
information on facilities from which they currently deliver service, when they:<br />
a) are no longer capable of supporting an acceptable service level; or<br />
b) are being abandoned due to a discontinuation of service or if service is being<br />
relocated to another facility; or<br />
c) are in a condition that no longer supports further investment based on the<br />
existing use; or<br />
In the case of community run facilities, the facility is not being utilized or<br />
managed by community and community does not support an alternative service<br />
delivery model<br />
Service Level Changes<br />
Increases In Services / new initiatives:<br />
$ Expansion of 6 Access-A-Bus Vehicles<br />
$ Addition of 3 new Conventional routes as listed in the Annual Plan<br />
$ Increase in services 6 Metro Transit Routes as listed in the Annual Plan<br />
$ Commissioning of Ragged Lake Transit Centre<br />
Decreases In Services / Operational Pressures:<br />
$ Adjustments to 15 routes to meet Service Standards in the 5year Strategic Plan<br />
Expected Services Not Being Delivered:<br />
$ Elimination of expanded weekly summer green bin program<br />
O26
Transportation & Public Works<br />
Summary of Gross Expenditures by Division<br />
2008-2009 2009-2010 2009-2010 2010-2011 Change over<br />
Actual Budget Projections Budget Budget Var as %<br />
TPW Administration<br />
R100 Directors Admin. 366,374 412,460 412,460 689,711 277,251 67.2<br />
366,374 412,460 412,460 689,711 277,251 67.2<br />
New Integrated Security Manag<br />
R102 Integrated Sec Manag 69,327 124,100 117,100 353,524 229,424 184.9<br />
69,327 124,100 117,100 353,524 229,424 184.9<br />
Service Delivery & Quality Im<br />
R101 Serv. Deliv.& Qualit 638,672 734,180 686,200 743,801 9,621 1.3<br />
707,999 858,280 803,300 1,097,325 239,045 27.9<br />
Ops Admin<br />
W220 Clearing-Facilities 128,529 0 0 0 0 -<br />
W959 Clearing - Capital 0 0 0 0 0 -<br />
128,529 0 0 0 0 -<br />
Real Estate<br />
W400 Acquisitions & Disp 449,218 461,900 461,900 475,868 13,968 3.0<br />
W500 Business Parks 392,136 395,100 395,100 406,484 11,384 2.9<br />
W600 Locked Real Estate 624,842 585,800 0 0 (585,800) (100.0)<br />
1,466,196 1,442,800 857,000 882,352 (560,448) (38.8)<br />
Contract Support<br />
W134 Capital Salary Costs 0 0 0 46 46 -<br />
W135 Construction Services 370,994 408,200 408,200 399,951 (8,249) (2.0)<br />
370,994 408,200 408,200 399,997 (8,203) (2.0)<br />
Operations<br />
W200 Facility Operations 3,441,147 3,550,300 3,485,900 3,227,436 (322,864) (9.1)<br />
W211 Clean & Tenant Serv. 2,670,932 2,741,800 2,941,800 2,823,292 81,492 3.0<br />
W212 Structural and Arenas 2,074,763 2,113,000 2,132,838 2,177,516 64,516 3.1<br />
W213 Mechanical & PM Serv 2,411,434 2,663,000 2,836,701 2,849,174 186,174 7.0<br />
10,598,276 11,068,100 11,397,239 11,077,418 9,318 0.1<br />
Facilities<br />
W160 Facilities Admin 293,943 460,000 1,045,800 1,053,751 593,751 129.1<br />
W202 TPW Commercial Leases 3,357,434 3,634,300 3,295,161 3,641,864 7,564 0.2<br />
W203 Alderney Gate FacMgt 2,078,876 2,109,300 2,109,300 2,103,208 (6,092) (0.3)<br />
16,328,529 17,271,700 17,847,500 17,876,241 604,541 3.5<br />
RPAM Admin<br />
W100 Admin/ServDelivery 207,986 243,800 243,800 246,835 3,035 1.2<br />
207,986 243,800 243,800 246,835 3,035 1.2<br />
Real Estate and Facility Serv 18,502,234 19,366,500 19,356,500 19,405,425 38,925 0.2<br />
Public Relations/debt<br />
R622 Public Relations 168,795 251,600 221,700 382,014 130,414 51.8<br />
168,795 251,600 221,700 382,014 130,414 51.8<br />
Transit Total<br />
R631 Gen. Transit Admin. 20,714,865 22,078,849 19,779,871 280,017 (21,798,832) (98.7)<br />
R635 Operator's Expense 27,089,286 29,610,403 29,496,802 32,621,055 3,010,652 10.2<br />
R636 Support Services - T 2,123,296 2,162,500 2,184,350 1,783,428 (379,072) (17.5)<br />
R637 Scheduling 658,307 789,000 739,548 910,716 121,716 15.4<br />
R638 Gen. Operations Exp. 1,347,251 1,602,700 1,797,705 321,276 (1,281,424) (80.0)<br />
51,933,004 56,243,452 53,998,276 35,916,492 (20,326,960) (36.1)<br />
Community Transit Total<br />
R641 Community Transit 592,649 493,398 524,648 347,840 (145,558) (29.5)<br />
592,649 493,398 524,648 347,840 (145,558) (29.5)<br />
Access-A-Bus Total<br />
R652 AAB-Scheduling/Disp. 471,901 849,200 435,350 2,954,190 2,104,990 247.9<br />
R653 Lock Contract Access 5,506 0 0 0 0 -<br />
R654 AAB Operations 2,854,559 2,737,999 2,899,758 0 (2,737,999) (100.0)<br />
3,331,965 3,587,199 3,335,108 2,954,190 (633,009) (17.6)<br />
Ferries Total<br />
R661 Gen. Ferry Expense 690,149 722,600 742,950 283,342 (439,258) (60.8)<br />
R668 Ferry Crew Expense 2,281,110 2,184,000 2,596,800 2,016,152 (167,848) (7.7)<br />
R671 Metro Tr. Debt Chrg 5,954,574 5,558,700 5,558,700 6,082,650 523,950 9.4<br />
8,925,833 8,465,300 8,898,450 8,382,144 (83,156) (1.0)<br />
O27
Transportation & Public Works<br />
Summary of Gross Expenditures by Division (continued)<br />
2008-2009 2009-2010 2009-2010 2010-2011 Change over<br />
Actual Budget Projections Budget Budget Var as %<br />
Fleet: Ilsley Site<br />
R932 Transit Shop Mtce. 509,554 593,000 597,000 614,145 21,145 3.6<br />
R933 Fleet R&M:Trans.-Ils 42,725 (2,900) (575,607) 17,345,995 17,348,895 (598,237.8)<br />
R934 Fleet Ops:Trans.-Ils (0) (700) (5,100) 958,889 959,589 (137,084.1)<br />
552,280 589,400 16,293 18,919,029 18,329,629 3,109.9<br />
Fleet:Thornhill Site<br />
R935 Bus Rebuild Program (56) (200) (200) (200) 0 -<br />
R936 Fleet R&M:Trans-Thor (30) 73,580 163,167 2,298,380 2,224,800 3,023.6<br />
R955 Fleet R&M:Transit Ferry 5,660 0 0 577,750 577,750 -<br />
R960 Fleet R&M:Transit-AAB 0 (100) 1,700 613,376 613,476 (613,476.0)<br />
R961 Fleet R&M:Trans Comm (0) 0 50,000 147,417 147,417 -<br />
5,574 73,280 214,667 3,636,723 3,563,443 4,862.8<br />
Metro Transit Services<br />
R667 Ferry Maintenance 0 0 0 579,910 579,910 -<br />
R657 Security 0 0 0 339,174 339,174 -<br />
R656 Safety and Training 0 0 0 307,927 307,927 -<br />
R640 Commun and Systems 0 0 0 504,165 504,165 -<br />
R624 Administration 0 0 0 178,069 178,069 -<br />
A640 Veh. Track. & Comm. 270,906 387,400 380,700 (387,400) (100.0)<br />
65,781,006 70,091,029 67,589,842 72,447,677 2,356,648 3.4<br />
Transportation Services<br />
R170 Transportation Serv. 1,139,424 1,424,540 1,364,055 1,417,616 (6,924) (0.5)<br />
1,139,424 1,424,540 1,364,055 1,417,616 (6,924) (0.5)<br />
Right of Way Services<br />
R112 Rights of Way Approval 556,487 560,850 551,338 461,180 (99,670) (17.8)<br />
556,487 560,850 551,338 461,180 (99,670) (17.8)<br />
Sign Shop<br />
R747 Traffic Signs 1,399,863 1,470,740 1,476,178 1,431,142 (39,598) (2.7)<br />
1,399,863 1,470,740 1,476,178 1,431,142 (39,598) (2.7)<br />
Traffic Signals & Streetlight<br />
R825 Streetlighting 5,733,948 6,650,900 6,559,417 6,486,435 (164,465) (2.5)<br />
R827 Traffic Lights 1,574,880 1,556,790 1,487,128 1,542,292 (14,498) (0.9)<br />
7,308,828 8,207,690 8,046,545 8,028,727 (178,963) (2.2)<br />
Traffic & Transportation 10,404,602 11,663,820 11,438,116 11,338,665 (325,155) (2.8)<br />
Fleet: Administration<br />
R912 Fleet: Administration 440,206 521,420 498,321 422,985 (98,435) (18.9)<br />
440,206 521,420 498,321 422,985 (98,435) (18.9)<br />
Fleet: Turner Site<br />
R970 Fleet R&M:Municipal 20,061 (900) (899) 0 900 (100.0)<br />
20,061 (900) (899) 0 900 (100.0)<br />
Fleet: Emergency<br />
R981 Fleet R&M:Fire 20,606 (300) 11,000 0 300 (100.0)<br />
R985 Fleet R&M:Police (95) (100) 0 0 100 (100.0)<br />
20,511 (400) 11,000 0 400 (100.0)<br />
Fleet: <strong>Halifax</strong> <strong>Regional</strong> Water<br />
R991 Fleet: R&M HRWC 348,808 710,000 710,000 0 (710,000) (100.0)<br />
348,808 710,000 710,000 0 (710,000) (100.0)<br />
Fleet Services 829,586 1,230,120 1,218,422 422,985 (807,135) (65.6)<br />
All Weather Program<br />
W187 Hfx Artificial Spfld 246,733 229,800 210,500 214,044 (15,756) (6.9)<br />
W190 Dart Artificl Spfld 161,801 165,200 156,100 139,100 (26,100) (15.8)<br />
408,534 395,000 366,600 353,144 (41,856) (10.6)<br />
Municipal Operations Admin<br />
W120 Operations Admin 251,981 298,540 338,540 299,734 1,194 0.4<br />
660,516 693,540 705,140 652,878 (40,662) (5.9)<br />
Municipal Operations Support<br />
R710 Municipal Op Support 4,034,318 3,978,860 4,149,700 4,629,399 650,539 16.3<br />
4,034,318 3,978,860 4,149,700 4,629,399 650,539 16.3<br />
O28
Transportation & Public Works<br />
Summary of Gross Expenditures by Division (continued)<br />
2008-2009 2009-2010 2009-2010 2010-2011 Change over<br />
Actual Budget Projections Budget Budget Var as %<br />
Streets & Roads<br />
R715 Administration - St. 2,350,489 2,003,380 2,289,158 2,091,840 88,460 4.4<br />
R720 Street Clean/Graffit 2,321,849 2,086,250 2,946,250 1,062,826 (1,023,424) (49.1)<br />
R721 Street Mtce-West Rgn 420,562 493,400 543,400 477,889 (15,511) (3.1)<br />
R723 Service Trucks/Litter 0 0 0 1,104,182 1,104,182 -<br />
R732 Street Mtce-Cent Rgn 1,035,354 776,690 671,345 794,721 18,031 2.3<br />
R735 Street Mtce-East Rgn 425,845 529,700 485,000 432,228 (97,472) (18.4)<br />
R899 Streets J/C Clearing 0 0 0 0 0 -<br />
6,554,099 5,889,420 6,935,153 5,963,686 74,266 1.3<br />
Ice Control ( East, West and<br />
R761 Locked Ice Control 465,216 0 0 0 0 -<br />
R771 East - Ice Control 2,095,829 1,215,480 1,878,480 1,243,111 27,631 2.3<br />
R772 West - Ice Control 2,898,057 1,482,980 2,282,980 1,682,621 199,641 13.5<br />
R773 Central - Ice Control 2,325,266 1,138,790 1,738,790 1,252,466 113,676 10.0<br />
7,784,368 3,837,250 5,900,250 4,178,198 340,948 8.9<br />
Plowing ( East, West and Cent<br />
R762 Locked Plowing 155,911 0 0 0 0 -<br />
R774 East - Plowing 1,932,031 1,775,480 2,565,480 1,695,997 (79,483) (4.5)<br />
R775 West - Plowing 2,276,146 2,228,380 3,223,380 2,144,719 (83,661) (3.8)<br />
R776 Central Plowing 1,993,343 1,442,790 2,107,790 1,381,815 (60,975) (4.2)<br />
6,357,430 5,446,650 7,896,650 5,222,531 (224,119) (4.1)<br />
Snow Removal ( East, West and<br />
R763 Locked Snow Removal 14,428 0 0 0 0 -<br />
R777 East - Snow Removal 226,926 56,600 56,600 36,600 (20,000) (35.3)<br />
R778 West - Snow Removal 593,207 96,000 96,000 74,126 (21,874) (22.8)<br />
R779 Central - Snow Removal 234,272 18,400 18,400 16,400 (2,000) (10.9)<br />
1,068,832 171,000 171,000 127,126 (43,874) (25.7)<br />
Sidewalk Plowing/Ice Control<br />
R764 Locked Swlk Plow/Ice 3,248,694 0 0 0 0 -<br />
R780 East-Sidewalk Pl/Ice 1,276,511 2,100,680 2,087,680 2,055,795 (44,885) (2.1)<br />
R781 West-Sidewalk Pl/Ice 1,529,858 2,554,380 2,554,380 2,424,077 (130,303) (5.1)<br />
R782 Central-Swalk Pl/Ice 324,702 748,190 748,190 665,538 (82,652) (11.0)<br />
6,379,765 5,403,250 5,390,250 5,145,410 (257,840) (4.8)<br />
Related Program Costs(East, W<br />
R765 LockRelated ProgCost 319,085 0 0 0 0 -<br />
R783 East-Related Pr Cost 357,191 93,780 93,780 93,033 (747) (0.8)<br />
R784 West-Related Pr Cost 333,094 105,480 105,480 123,133 17,653 16.7<br />
R785 Cent-Related Pr Cost 168,690 64,380 64,380 34,156 (30,224) (46.9)<br />
1,178,060 263,640 263,640 250,322 (13,318) (5.1)<br />
Snow & Ice Control Priority 2<br />
R768 Priority 2&3 Snow &Ice 1,330,136 0 0 0 0 -<br />
1,330,136 0 0 0 0 -<br />
Operation Coordinator/Snow & 24,098,591 15,121,790 19,621,790 14,923,587 (198,203) (1.3)<br />
Sidewalks<br />
R738 Waverley Sidewalks 0 6,700 6,700 6,700 0 -<br />
R739 Fall River Sidewalks 53,722 0 0 0 0 -<br />
R740 Concrete SW-Wst/Bedf 648,055 767,400 765,200 724,462 (42,938) (5.6)<br />
R741 Asphalt Crb/Wlk-E/C 273,643 448,200 237,200 417,240 (30,960) (6.9)<br />
R742 Concrete SW-East/Cen 521,039 584,500 651,500 631,022 46,522 8.0<br />
R743 Asphalt Patching 1,003,048 828,900 1,047,800 789,343 (39,557) (4.8)<br />
R744 Sidewalks - East 0 0 (0) 0 0 -<br />
R745 Sidewalks - West (0) 0 0 0 0 -<br />
2,499,507 2,635,700 2,708,400 2,568,767 (66,933) (2.5)<br />
Public Works Operations 33,152,196 23,646,910 29,265,343 23,456,040 (190,870) (0.8)<br />
O29
Transportation & Public Works<br />
Summary of Gross Expenditures by Division (continued)<br />
2008-2009 2009-2010 2009-2010 2010-2011 Change over<br />
Actual Budget Projections Budget Budget Var as %<br />
Parks and Open Spaces<br />
R831 Parks/Open - Admin 38,575 243,600 206,100 262,769 19,169 7.9<br />
R845 Parks Urban Forestry 869,727 933,800 933,800 1,091,500 157,700 16.9<br />
R850 Public Garden Green 265,264 557,900 557,900 672,462 114,562 20.5<br />
R851 Parks/Horticulture 1,489,968 927,300 942,300 972,083 44,783 4.8<br />
R852 Cap Dis Main Weekend 170,395 547,500 647,500 508,863 (38,637) (7.1)<br />
R855 Parks Cemeteries 854,285 452,400 437,100 365,006 (87,394) (19.3)<br />
R860 Parks/Open-West 770,338 666,000 666,000 748,853 82,853 12.4<br />
4,458,551 4,328,500 4,390,700 4,621,536 293,036 6.8<br />
Sportsfields & Playgrounds<br />
W180 Playgrounds East 1,143,358 1,147,900 870,300 617,394 (530,506) (46.2)<br />
W181 Sports/Play - Admin 329,116 474,300 171,800 486,715 12,415 2.6<br />
W182 Sportsfields East 1,440,269 1,232,200 1,090,300 788,891 (443,309) (36.0)<br />
W183 Playgrounds Central 0 0 161,300 622,198 622,198 -<br />
W184 Playgrounds West 758,297 856,700 824,400 837,099 (19,601) (2.3)<br />
W185 Sportsfields - Central 0 0 177,700 592,056 592,056 -<br />
W186 Sportsfields West 997,182 1,117,600 1,091,900 1,028,940 (88,660) (7.9)<br />
W189 Sports/PlayR&M-frCpt 0 0 (0) 0 0 -<br />
4,668,223 4,828,700 4,387,700 4,973,293 144,593 3.0<br />
Municipal Operations 46,973,803 37,476,510 42,898,583 38,333,146 856,636 2.3<br />
Former Solid Waste System<br />
M431 Sack Landfill Reserv 250,000 0 0 0 0 -<br />
R311 MA Solid Waste Debt 319,590 307,700 307,700 295,200 (12,500) (4.1)<br />
R314 Sckv. Landfill Site 0 0 0 100 100 -<br />
R315 Leach. Trt./FlareStc 24,164 0 0 0 0 -<br />
593,754 307,700 307,700 295,300 (12,400) (4.0)<br />
Admin WR<br />
R321 Administration - WR 961,046 1,099,500 1,151,231 1,134,308 34,808 3.2<br />
961,046 1,099,500 1,151,231 1,134,308 34,808 3.2<br />
SW Other<br />
R322 Collection & RRFB 11,428,254 11,815,400 11,775,400 12,072,400 257,000 2.2<br />
R323 Waste Res Sy Debt Ch 1,159,893 136,800 136,800 196,400 59,600 43.6<br />
R324 Compost Fac.Burnside 3,190,605 3,225,000 3,335,000 3,583,000 358,000 11.1<br />
R325 Compost Fac.Ragged Lak 2,783,693 2,835,000 3,835,000 3,975,000 1,140,000 40.2<br />
R328 Rural Depots 177,535 155,000 155,000 154,400 (600) (0.4)<br />
R330 Material Recov. Fac. 2,681,857 2,453,700 2,463,700 2,522,700 69,000 2.8<br />
R331 RRFB Contract 215,623 247,200 247,200 285,301 38,101 15.4<br />
R332 <strong>Operating</strong> Reserve 300,000 300,000 300,000 300,000 0 -<br />
R333 C & E Progrms HRM 329,302 327,900 327,900 295,110 (32,790) (10.0)<br />
R334 Household Haz. Waste 336,742 401,300 401,300 416,200 14,900 3.7<br />
22,603,503 21,897,300 22,977,300 23,800,511 1,903,211 8.7<br />
Otter Lake<br />
R326 Otter Lake WSF 3,422,823 2,947,700 2,947,700 2,832,200 (115,500) (3.9)<br />
R327 Otter Lake RDF 6,240,686 6,927,300 6,927,300 7,136,900 209,600 3.0<br />
R329 Otter Lake FEP 9,906,639 10,198,400 9,854,000 11,111,600 913,200 9.0<br />
19,570,148 20,073,400 19,729,000 21,080,700 1,007,300 5.0<br />
Waste Resources 43,134,697 43,070,200 43,857,531 46,015,519 2,945,319 6.8<br />
Solid Waste Services 43,728,450 43,377,900 44,165,231 46,310,819 2,932,919 6.8<br />
<strong>Regional</strong> Transportation Plann<br />
R951 <strong>Regional</strong> Trans.Plann 489,546 544,000 524,100 469,391 (74,609) (13.7)<br />
489,546 544,000 524,100 469,391 (74,609) (13.7)<br />
Total $187,783,600 $185,020,619 $188,406,554 $190,515,144 $5,494,525 3.0<br />
O30
Transportation & Public Works<br />
Summary of Gross Revenue by Division<br />
2008-2009 2009-2010 2009-2010 2010-2011 Change over<br />
Actual Budget Projections Budget Budget Var as %<br />
TPW Administration<br />
R100 Directors Admin. (23) 0 0 0 0 -<br />
(23) 0 0 0 0 -<br />
Service Delivery & Quality Im<br />
R101 Serv. Deliv.& Qualit (162,000) (177,100) (100,000) (177,100) 0 -<br />
(162,000) (177,100) (100,000) (177,100) 0 -<br />
Ops Admin<br />
W220 Clearing-Facilities (15,741) 0 0 0 0 -<br />
(15,741) 0 0 0 0 -<br />
Real Estate 0 0 0 0 0 -<br />
W400 Acquisitions & Disp (107,530) (303,400) (195,000) (303,400) 0 -<br />
W500 Business Parks (818,407) (733,800) (893,364) (733,800) 0 -<br />
(925,937) (1,037,200) (1,088,364) (1,037,200) 0 -<br />
Operations<br />
W200 Facility Operations 44,593 0 0 0 0 -<br />
W211 Clean & Tenant Serv. (886) 0 0 0 0 -<br />
W212 Structural and Arenas (168,004) 0 0 0 0 -<br />
W213 Mechanical & PM Serv (2,313) 0 0 0 0 -<br />
(126,609) 0 0 0 0 -<br />
Facilities<br />
W202 TPW Commercial Lease (1,770,594) (2,162,100) (2,201,400) (2,559,100) (397,000) 18.4<br />
W203 Alderney Gate FacMgt (1,327,530) (1,305,100) (1,305,100) (1,305,100) 0 -<br />
(3,224,733) (3,467,200) (3,506,500) (3,864,200) (397,000) 11.5<br />
Real Estate and Facility Serv (4,166,411) (4,504,400) (4,594,864) (4,901,400) (397,000) 8.8<br />
Public Relations/debt<br />
R622 Public Relations (583,225) (655,700) (655,700) (680,700) (25,000) 3.8<br />
(583,225) (655,700) (655,700) (680,700) (25,000) 3.8<br />
Transit Total<br />
R631 Gen. Transit Admin. (26,383,440) (57,621,549) (55,897,149) 0 57,621,549 (100.0)<br />
R635 Operator's Expense (10,210) 0 0 (64,704,213) (64,704,213) -<br />
R636 Support Services - T (15,878) 0 0 0 0 -<br />
(26,409,527) (57,621,549) (55,897,149) (64,704,213) (7,082,664) 12.3<br />
Community Transit Total<br />
R641 Community Transit (588,438) (115,900) (98,000) (93,000) 22,900 (19.8)<br />
(588,438) (115,900) (98,000) (93,000) 22,900 (19.8)<br />
Access-A-Bus Total<br />
R652 AAB-Scheduling/Disp. (148,775) (179,500) (165,000) (180,000) (500) 0.3<br />
(148,775) (179,500) (165,000) (180,000) (500) 0.3<br />
Ferries Total<br />
R661 Gen. Ferry Expense (1,783,625) (1,981,600) (2,021,600) 0 1,981,600 (100.0)<br />
R668 Ferry Crew Expense (226) 0 0 (1,976,100) (1,976,100) -<br />
(1,783,851) (1,981,600) (2,021,600) (1,976,100) 5,500 (0.3)<br />
Fleet: Ilsley Site<br />
R933 Fleet R&M:Trans.-Ils (36,052) 0 (59,112) 0 0 -<br />
(36,052) 0 (59,112) 0 0 -<br />
Fleet:Thornhill Site<br />
R955 Fleet R&M:Transit Ferry (5,808) 0 0 0 0 -<br />
(5,808) 0 0 0 0 -<br />
Metro Transit Services<br />
R624 Administration 0 0 0 (79,600) (79,600) -<br />
A640 Veh. Track. & Comm. (28,365) (28,000) (21,300) 28,000 (100.0)<br />
(29,584,042) (60,582,249) (58,917,861) (67,713,613) (7,131,364) 11.8<br />
Transportation Services<br />
R170 Transportation Serv. 0 0 (10) 0 0 -<br />
0 0 (10) 0 0 -<br />
O31
Transportation & Public Works<br />
Summary of Gross Revenue by Division (continued)<br />
2008-2009 2009-2010 2009-2010 2010-2011 Change over<br />
Actual Budget Projections Budget Budget Var as %<br />
Right of Way Services<br />
R112 Rights of Way Approval (420,664) (418,100) (383,617) (509,600) (91,500) 21.9<br />
(420,664) (418,100) (383,617) (509,600) (91,500) 21.9<br />
Sign Shop<br />
R747 Traffic Signs (55,235) 0 (105,419) 0 0 -<br />
(55,235) 0 (105,419) 0 0 -<br />
Traffic Signals & Streetlight<br />
R825 Streetlighting (94,240) 0 (53,000) 0 0 -<br />
R827 Traffic Lights (5,373) 0 (6,750) 0 0 -<br />
(99,613) 0 (59,750) 0 0 -<br />
Traffic & Transportation (575,513) (418,100) (548,796) (509,600) (91,500) 21.9<br />
Fleet: Turner Site<br />
R970 Fleet R&M:Municipal (14,792) 0 0 0 0 -<br />
(14,792) 0 0 0 0 -<br />
Fleet: Emergency<br />
R981 Fleet R&M:Fire (31,785) 0 (11,000) 0 0 -<br />
(31,785) 0 (11,000) 0 0 -<br />
Fleet: <strong>Halifax</strong> <strong>Regional</strong> Water<br />
R991 Fleet: R&M HRWC (348,808) (710,000) (710,000) 0 710,000 (100.0)<br />
(348,808) (710,000) (710,000) 0 710,000 (100.0)<br />
Fleet Services (395,385) (710,000) (721,000) 0 710,000 (100.0)<br />
All Weather Program<br />
W187 Hfx Artificial Spfld (169,159) (135,000) (154,900) (135,000) 0 -<br />
W190 Dart Artificl Spfld (143,534) (137,800) (143,100) (137,800) 0 -<br />
(312,693) (272,800) (298,000) (272,800) 0 -<br />
Municipal Operations Admin (312,693) (272,800) (298,000) (272,800) 0 -<br />
Municipal Operations Support<br />
R710 Municipal Op Support (149,555) 0 (166,000) 0 0 -<br />
(149,555) 0 (166,000) 0 0 -<br />
Streets & Roads<br />
R715 Administration - St. (6,884) 0 0 0 0 -<br />
R720 Street Clean/Graffit (52) 0 0 0 0 -<br />
(6,936) 0 0 0 0 -<br />
Plowing ( East, West and Cent<br />
R775 West - Plowing (101) 0 0 0 0 -<br />
R776 Central Plowing (68) 0 0 0 0 -<br />
(169) 0 0 0 0 -<br />
Sidewalk Plowing/Ice Control<br />
R764 Locked Swlk Plow/Ice (2,316,883) 0 0 0 0 -<br />
R780 East-Sidewalk Pl/Ice (369) (1,059,600) (1,059,600) (1,059,600) 0 -<br />
R781 West-Sidewalk Pl/Ice 456 (927,150) (927,150) (927,150) 0 -<br />
R782 Central-Swalk Pl/Ice (689,650) (689,650) (689,650) 0 -<br />
(2,316,797) (2,676,400) (2,676,400) (2,676,400) 0 -<br />
Operation Coordinator/Snow & (2,316,966) (2,676,400) (2,676,400) (2,676,400) 0 -<br />
Sidewalks<br />
R738 Waverley Sidewalks (6,551) (6,700) (6,700) (6,700) 0 -<br />
R740 Concrete SW-Wst/Bedf (38) 0 0 0 0 -<br />
(6,590) (6,700) (6,700) (6,700) 0 -<br />
O32
Transportation & Public Works<br />
Summary of Gross Revenue by Division (continued)<br />
2008-2009 2009-2010 2009-2010 2010-2011 Change over<br />
Actual Budget Projections Budget Budget Var as %<br />
Public Works Operations (2,330,491) (2,683,100) (2,683,100) (2,683,100) 0 -<br />
Parks and Open Spaces<br />
R850 Public Garden Green (113) 0 0 0 0 -<br />
R851 Parks/Horticulture (2,270) 0 (15,000) 0 0 -<br />
R855 Parks Cemeteries (434,375) (394,100) (244,100) (674,225) (280,125) 71.1<br />
(436,758) (394,100) (259,100) (674,225) (280,125) 71.1<br />
Sportsfields & Playgrounds<br />
W180 Playgrounds East (2,370) 0 0 0 0 -<br />
W181 Sports/Play - Admin (49,760) (51,000) (51,000) (51,000) 0 -<br />
W182 Sportsfields East (89,028) (80,700) (101,100) (80,700) 0 -<br />
W184 Playgrounds West (7,694) 0 0 0 0 -<br />
W186 Sportsfields West (71,873) (80,700) (80,700) (80,700) 0 -<br />
(220,724) (212,400) (232,800) (212,400) 0 -<br />
Municipal Operations (3,450,222) (3,562,400) (3,639,000) (3,842,525) (280,125) 7.9<br />
Admin WR<br />
R321 Administration - WR (10,302,919) (10,340,700) (10,038,015) (10,740,015) (399,315) 3.9<br />
(10,302,919) (10,340,700) (10,038,015) (10,740,015) (399,315) 3.9<br />
SW Other<br />
R322 Collection & RRFB (3,785,068) (3,224,000) (2,731,000) (2,724,000) 500,000 (15.5)<br />
R324 Compost Fac.Burnside (679,919) (680,000) (740,000) (779,000) (99,000) 14.6<br />
R325 Compost Fac.Ragged Lak (396,212) (400,000) (410,000) (424,000) (24,000) 6.0<br />
R330 Material Recov. Fac. (1,480,911) (1,029,600) (1,382,000) (1,245,769) (216,169) 21.0<br />
R331 RRFB Contract (169,107) (247,300) (247,300) (287,636) (40,336) 16.3<br />
R333 C & E Progrms HRM (31,364) 0 (40,000) 0 0 -<br />
R334 Household Haz. Waste (7,325) (8,000) (8,000) (8,000) 0 -<br />
(6,549,906) (5,588,900) (5,558,300) (5,468,405) 120,495 (2.2)<br />
Otter Lake<br />
R326 Otter Lake WSF (0) 0 0 0 0 -<br />
R329 Otter Lake FEP (153,909) (108,000) (325,642) (80,000) 28,000 (25.9)<br />
(153,910) (108,000) (325,642) (80,000) 28,000 (25.9)<br />
Waste Resources (17,006,736) (16,037,600) (15,921,957) (16,288,420) (250,820) 1.6<br />
Solid Waste Services (17,006,736) (16,037,600) (15,921,957) (16,288,420) (250,820) 1.6<br />
<strong>Regional</strong> Transportation Plann<br />
R951 <strong>Regional</strong> Trans.Plann (576) 0 0 0 0 -<br />
(576) 0 0 0 0 -<br />
Total (55,340,906) (85,991,849) (84,443,478) (93,432,658) (7,440,809) 8.7<br />
O33
Transportation & Public Works<br />
Summary of Net Expenditures by Division<br />
2008-2009 2009-2010 2009-2010 2010-2011 Change over<br />
Actual Budget Projections Budget Budget Var as %<br />
TPW Administration<br />
R100 Directors Admin. 366,352 412,460 412,460 689,711 277,251 67.2<br />
366,352 412,460 412,460 689,711 277,251 67.2<br />
New Integrated Security Manag<br />
R102 Integrated Sec Manag 69,327 124,100 117,100 353,524 229,424 184.9<br />
69,327 124,100 117,100 353,524 229,424 184.9<br />
Service Delivery & Quality Im<br />
R101 Serv. Deliv.& Qualit 476,672 557,080 586,200 566,701 9,621 1.7<br />
545,999 681,180 703,300 920,225 239,045 35.1<br />
Ops Admin<br />
W220 Clearing-Facilities 112,788 0 0 0 0 -<br />
W959 Clearing - Capital 0 0 0 0 0 -<br />
112,788 0 0 0 0 -<br />
Real Estate<br />
W400 Acquisitions & Disp 341,689 158,500 266,900 172,468 13,968 8.8<br />
W500 Business Parks (426,271) (338,700) (498,264) (327,316) 11,384 (3.4)<br />
W600 Locked Real Estate 624,842 585,800 (585,800) (100.0)<br />
540,259 405,600 (231,364) (154,848) (560,448) (138.2)<br />
Contract Support<br />
W134 Capital Salary Costs 0 0 0 46 46 -<br />
W135 Construction Services 370,994 408,200 408,200 399,951 (8,249) (2.0)<br />
370,994 408,200 408,200 399,997 (8,203) (2.0)<br />
Operations<br />
W200 Facility Operations 3,485,740 3,550,300 3,485,900 3,227,436 (322,864) (9.1)<br />
W211 Clean & Tenant Serv. 2,670,046 2,741,800 2,941,800 2,823,292 81,492 3.0<br />
W212 Structural and Arenas 1,906,759 2,113,000 2,132,838 2,177,516 64,516 3.1<br />
W213 Mechanical & PM Serv 2,409,121 2,663,000 2,836,701 2,849,174 186,174 7.0<br />
10,471,666 11,068,100 11,397,239 11,077,418 9,318 0.1<br />
Facilities<br />
W160 Facilities Admin 293,943 460,000 1,045,800 1,053,751 593,751 129.1<br />
W202 TPW Commercial Lease 1,586,841 1,472,200 1,093,761 1,082,764 (389,436) (26.5)<br />
W203 Alderney Gate FacMgt 751,346 804,200 804,200 798,108 (6,092) (0.8)<br />
13,103,796 13,804,500 14,341,000 14,012,041 207,541 1.5<br />
RPAM Admin<br />
W100 Admin/ServDelivery 207,986 243,800 243,800 246,835 3,035 1.2<br />
207,986 243,800 243,800 246,835 3,035 1.2<br />
Real Estate and Facility Serv 14,335,823 14,862,100 14,761,636 14,504,025 (358,075) (2.4)<br />
Public Relations/debt<br />
R622 Public Relations (414,430) (404,100) (434,000) (298,686) 105,414 (26.1)<br />
(414,430) (404,100) (434,000) (298,686) 105,414 (26.1)<br />
Transit Total<br />
R631 Gen. Transit Admin. (5,668,575) (35,542,700) (36,117,278) 280,017 35,822,717 (100.8)<br />
R635 Operator's Expense 27,079,076 29,610,403 29,496,802 (32,083,158) (61,693,561) (208.4)<br />
R636 Support Services - T 2,107,418 2,162,500 2,184,350 1,783,428 (379,072) (17.5)<br />
R637 Scheduling 658,307 789,000 739,548 910,716 121,716 15.4<br />
R638 Gen. Operations Exp. 1,347,251 1,602,700 1,797,705 321,276 (1,281,424) (80.0)<br />
25,523,477 (1,378,097) (1,898,873) (28,787,721) (27,409,624) 1,988.9<br />
Community Transit Total<br />
R641 Community Transit 4,211 377,498 426,648 254,840 (122,658) (32.5)<br />
4,211 377,498 426,648 254,840 (122,658) (32.5)<br />
O34
Transportation & Public Works<br />
Summary of Net Expenditures by Division (continued)<br />
2008-2009 2009-2010 2009-2010 2010-2011 Change over<br />
Actual Budget Projections Budget Budget Var as %<br />
Access-A-Bus Total<br />
R652 AAB-Scheduling/Disp. 323,126 669,700 270,350 2,774,190 2,104,490 314.2<br />
R653 Lock Contract Access 5,506 0 0 0 0 -<br />
R654 AAB Operations 2,854,559 2,737,999 2,899,758 0 (2,737,999) (100.0)<br />
3,183,191 3,407,699 3,170,108 2,774,190 (633,509) (18.6)<br />
Ferries Total<br />
R661 Gen. Ferry Expense (1,093,476) (1,259,000) (1,278,650) 283,342 1,542,342 (122.5)<br />
R668 Ferry Crew Expense 2,280,884 2,184,000 2,596,800 40,052 (2,143,948) (98.2)<br />
R671 Metro Tr. Debt Chrg 5,954,574 5,558,700 5,558,700 6,082,650 523,950 9.4<br />
7,141,982 6,483,700 6,876,850 6,406,044 (77,656) (1.2)<br />
Fleet: Ilsley Site<br />
R932 Transit Shop Mtce. 509,554 593,000 597,000 614,145 21,145 3.6<br />
R933 Fleet R&M:Trans.-Ils 6,673 (2,900) (634,719) 17,345,995 17,348,895 (598,237.8)<br />
R934 Fleet Ops:Trans.-Ils (0) (700) (5,100) 958,889 959,589 (137,084.1)<br />
516,227 589,400 (42,819) 18,919,029 18,329,629 3,109.9<br />
Fleet:Thornhill Site<br />
R935 Bus Rebuild Program (56) (200) (200) (200) 0 -<br />
R936 Fleet R&M:Trans-Thor (30) 73,580 163,167 2,298,380 2,224,800 3,023.6<br />
R955 Fleet R&M:Transit Ferry (149) 0 0 577,750 577,750 -<br />
R960 Fleet R&M:Transit-AAB 0 (100) 1,700 613,376 613,476 (613,476.0)<br />
R961 Fleet R&M:Trans Comm (0) 50,000 147,417 147,417 -<br />
(234) 73,280 214,667 3,636,723 3,563,443 4,862.8<br />
Metro Transit Services<br />
R667 Ferry Maintenance 0 0 0 579,910 579,910 -<br />
R657 Security 0 0 0 339,174 339,174 -<br />
R656 Safety and Training 0 0 0 307,927 307,927 -<br />
R640 Commun and Systems 0 0 0 504,165 504,165 -<br />
R624 Administration 0 0 0 98,469 98,469 -<br />
A640 Veh. Track. & Comm. 242,541 359,400 359,400 (359,400) (100.0)<br />
36,196,964 9,508,780 8,671,981 4,734,064 (4,774,716) (50.2)<br />
Transportation Services<br />
R170 Transportation Serv. 1,139,424 1,424,540 1,364,045 1,417,616 (6,924) (0.5)<br />
1,139,424 1,424,540 1,364,045 1,417,616 (6,924) (0.5)<br />
Right of Way Services<br />
R112 Rights of Way Approval 135,823 142,750 167,721 (48,420) (191,170) (133.9)<br />
135,823 142,750 167,721 (48,420) (191,170) (133.9)<br />
Sign Shop<br />
R747 Traffic Signs 1,344,628 1,470,740 1,370,759 1,431,142 (39,598) (2.7)<br />
1,344,628 1,470,740 1,370,759 1,431,142 (39,598) (2.7)<br />
Traffic Signals & Streetlight<br />
R825 Streetlighting 5,639,708 6,650,900 6,506,417 6,486,435 (164,465) (2.5)<br />
R827 Traffic Lights 1,569,507 1,556,790 1,480,378 1,542,292 (14,498) (0.9)<br />
7,209,215 8,207,690 7,986,795 8,028,727 (178,963) (2.2)<br />
Traffic & Transportation 9,829,089 11,245,720 10,889,320 10,829,065 (416,655) (3.7)<br />
Fleet: Administration<br />
R912 Fleet: Administration 440,206 521,420 498,321 422,985 (98,435) (18.9)<br />
440,206 521,420 498,321 422,985 (98,435) (18.9)<br />
Fleet: Turner Site<br />
R970 Fleet R&M:Municipal 5,269 (900) (899) 0 900 (100.0)<br />
5,269 (900) (899) 0 900 (100.0)<br />
Fleet: Emergency<br />
R981 Fleet R&M:Fire (11,179) (300) 0 0 300 (100.0)<br />
R985 Fleet R&M:Police (95) (100) 0 0 100 (100.0)<br />
(11,274) (400) 0 0 400 (100.0)<br />
O35
Transportation & Public Works<br />
Summary of Net Expenditures by Division (continued)<br />
2008-2009 2009-2010 2009-2010 2010-2011 Change over<br />
Actual Budget Projections Budget Budget Var as %<br />
Fleet: <strong>Halifax</strong> <strong>Regional</strong> Water<br />
R991 Fleet: R&M HRWC 0 (0) (0) 0 0 (100.0)<br />
0 (0) (0) 0 0 (100.0)<br />
Fleet Services 434,201 520,120 497,422 422,985 (97,135) (18.7)<br />
All Weather Program<br />
W187 Hfx Artificial Spfld 77,574 94,800 55,600 79,044 (15,756) (16.6)<br />
W190 Dart Artificl Spfld 18,267 27,400 13,000 1,300 (26,100) (95.3)<br />
95,842 122,200 68,600 80,344 (41,856) (34.3)<br />
Municipal Operations Admin<br />
W120 Operations Admin 251,981 298,540 338,540 299,734 1,194 0.4<br />
347,823 420,740 407,140 380,078 (40,662) (9.7)<br />
Municipal Operations Support<br />
R710 Municipal Op Support 3,884,763 3,978,860 3,983,700 4,629,399 650,539 16.3<br />
3,884,763 3,978,860 3,983,700 4,629,399 650,539 16.3<br />
Streets & Roads<br />
R715 Administration - St. 2,343,605 2,003,380 2,289,158 2,091,840 88,460 4.4<br />
R720 Street Clean/Graffit 2,321,796 2,086,250 2,946,250 1,062,826 (1,023,424) (49.1)<br />
R721 Street Mtce-West Rgn 420,562 493,400 543,400 477,889 (15,511) (3.1)<br />
R723 Service Trucks/Litter 0 0 0 1,104,182 1,104,182<br />
R732 Street Mtce-Cent Rgn 1,035,354 776,690 671,345 794,721 18,031 2.3<br />
R735 Street Mtce-East Rgn 425,845 529,700 485,000 432,228 (97,472) (18.4)<br />
R899 Streets J/C Clearing 0 0 0 0 0<br />
6,547,162 5,889,420 6,935,153 5,963,686 74,266 1.3<br />
Ice Control ( East, West and<br />
R761 Locked Ice Control 465,216 0 0 0 0 -<br />
R771 East - Ice Control 2,095,829 1,215,480 1,878,480 1,243,111 27,631 2.3<br />
R772 West - Ice Control 2,898,057 1,482,980 2,282,980 1,682,621 199,641 13.5<br />
R773 Central - Ice Control 2,325,266 1,138,790 1,738,790 1,252,466 113,676 10.0<br />
7,784,368 3,837,250 5,900,250 4,178,198 340,948 8.9<br />
Plowing ( East, West and Cent<br />
R762 Locked Plowing 155,911 0 0 0 0 -<br />
R774 East - Plowing 1,932,031 1,775,480 2,565,480 1,695,997 (79,483) (4.5)<br />
R775 West - Plowing 2,276,045 2,228,380 3,223,380 2,144,719 (83,661) (3.8)<br />
R776 Central Plowing 1,993,275 1,442,790 2,107,790 1,381,815 (60,975) (4.2)<br />
6,357,261 5,446,650 7,896,650 5,222,531 (224,119) (4.1)<br />
Snow Removal ( East, West and<br />
R763 Locked Snow Removal 14,428 0 0 0 0 -<br />
R777 East - Snow Removal 226,926 56,600 56,600 36,600 (20,000) (35.3)<br />
R778 West - Snow Removal 593,207 96,000 96,000 74,126 (21,874) (22.8)<br />
R779 Central - Snow Removal 234,272 18,400 18,400 16,400 (2,000) (10.9)<br />
1,068,832 171,000 171,000 127,126 (43,874) (25.7)<br />
Sidewalk Plowing/Ice Control<br />
R764 Locked Swlk Plow/Ice 931,811 0 0 0 0 -<br />
R780 East-Sidewalk Pl/Ice 1,276,142 1,041,080 1,028,080 996,195 (44,885) (4.3)<br />
R781 West-Sidewalk Pl/Ice 1,530,314 1,627,230 1,627,230 1,496,927 (130,303) (8.0)<br />
R782 Central-Swalk Pl/Ice 324,702 58,540 58,540 (24,112) (82,652) (141.2)<br />
4,062,968 2,726,850 2,713,850 2,469,010 (257,840) (9.5)<br />
Related Program Costs(East, W<br />
R765 LockRelated ProgCost 319,085 0 0 0 0 -<br />
R783 East-Related Pr Cost 357,191 93,780 93,780 93,033 (747) (0.8)<br />
R784 West-Related Pr Cost 333,094 105,480 105,480 123,133 17,653 16.7<br />
R785 Cent-Related Pr Cost 168,690 64,380 64,380 34,156 (30,224) (46.9)<br />
1,178,060 263,640 263,640 250,322 (13,318) (5.1)<br />
O36
Transportation & Public Works<br />
Summary of Net Expenditures by Division (continued)<br />
2008-2009 2009-2010 2009-2010 2010-2011 Change over<br />
Actual Budget Projections Budget Budget Var as %<br />
Ice Control ( East, West and<br />
R768 Priority 2&3 Snow &Ice 1,330,136 0 0 0 0 -<br />
1,330,136 0 0 0 0 -<br />
Operation Coordinator/Snow & 21,781,625 12,445,390 16,945,390 12,247,187 (198,203) (1.6)<br />
Sidewalks<br />
R738 Waverley Sidewalks (6,551) 0 0 0 0 -<br />
R739 Fall River Sidewalks 53,722 0 0 0 0 -<br />
R740 Concrete SW-Wst/Bedf 648,017 767,400 765,200 724,462 (42,938) (5.6)<br />
R741 Asphalt Crb/Wlk-E/C 273,643 448,200 237,200 417,240 (30,960) (6.9)<br />
R742 Concrete SW-East/Cen 521,039 584,500 651,500 631,022 46,522 8.0<br />
R743 Asphalt Patching 1,003,048 828,900 1,047,800 789,343 (39,557) (4.8)<br />
R744 Sidewalks - East 0 0 (0) 0 0 -<br />
R745 Sidewalks - West (0) 0 0 0 0 -<br />
2,492,918 2,629,000 2,701,700 2,562,067 (66,933) (2.5)<br />
Public Works Operations 30,821,705 20,963,810 26,582,243 20,772,940 (190,870) (0.9)<br />
Parks and Open Spaces<br />
R831 Parks/Open - Admin 38,575 243,600 206,100 262,769 19,169 7.9<br />
R845 Parks Urban Forestry 869,727 933,800 933,800 1,091,500 157,700 16.9<br />
R850 Public Garden Green 265,151 557,900 557,900 672,462 114,562 20.5<br />
R851 Parks/Horticulture 1,487,698 927,300 927,300 972,083 44,783 4.8<br />
R852 Cap Dis Main Weekend 170,395 547,500 647,500 508,863 (38,637) (7.1)<br />
R855 Parks Cemeteries 419,910 58,300 193,000 (309,219) (367,519) (630.4)<br />
R860 Parks/Open-West 770,338 666,000 666,000 748,853 82,853 12.4<br />
4,021,793 3,934,400 4,131,600 3,947,311 12,911 0.3<br />
Sportsfields & Playgrounds<br />
W180 Playgrounds East 1,140,988 1,147,900 870,300 617,394 (530,506) (46.2)<br />
W181 Sports/Play - Admin 279,356 423,300 120,800 435,715 12,415 2.9<br />
W182 Sportsfields East 1,351,241 1,151,500 989,200 708,191 (443,309) (38.5)<br />
W183 Playgrounds Central 0 0 161,300 622,198 622,198 -<br />
W184 Playgrounds West 750,603 856,700 824,400 837,099 (19,601) (2.3)<br />
W185 Sportsfields - Central 0 0 177,700 592,056 592,056 -<br />
W186 Sportsfields West 925,309 1,036,900 1,011,200 948,240 (88,660) (8.6)<br />
W189 Sports/PlayR&M-frCpt 0 0 (0) 0 0 -<br />
4,447,498 4,616,300 4,154,900 4,760,893 144,593 3.1<br />
Municipal Operations 43,523,582 33,914,110 39,259,583 34,490,621 576,511 1.7<br />
Former Solid Waste System<br />
M431 Sack Landfill Reserv 250,000 0 0 0 0 -<br />
R311 MA Solid Waste Debt 319,590 307,700 307,700 295,200 (12,500) (4.1)<br />
R314 Sckv. Landfill Site 0 0 0 100 100 -<br />
R315 Leach. Trt./FlareStc 24,164 0 0 0 0 -<br />
593,754 307,700 307,700 295,300 (12,400) (4.0)<br />
Admin WR<br />
R321 Administration - WR (9,341,874) (9,241,200) (8,886,784) (9,605,707) (364,507) 3.9<br />
(9,341,874) (9,241,200) (8,886,784) (9,605,707) (364,507) 3.9<br />
O37
Transportation & Public Works<br />
Summary of Net Expenditures by Division (continued)<br />
2008-2009 2009-2010 2009-2010 2010-2011 Change over<br />
Actual Budget Projections Budget Budget Var as %<br />
SW Other<br />
R322 Collection & RRFB 7,643,186 8,591,400 9,044,400 9,348,400 757,000 8.8<br />
R323 Waste Res Sy Debt Ch 1,159,893 136,800 136,800 196,400 59,600 43.6<br />
R324 Compost Fac.Burnside 2,510,685 2,545,000 2,595,000 2,804,000 259,000 10.2<br />
R325 Compost Fac.Ragged Lak 2,387,480 2,435,000 3,425,000 3,551,000 1,116,000 45.8<br />
R328 Rural Depots 177,535 155,000 155,000 154,400 (600) (0.4)<br />
R330 Material Recov. Fac. 1,200,945 1,424,100 1,081,700 1,276,931 (147,169) (10.3)<br />
R331 RRFB Contract 46,516 (100) (100) (2,335) (2,235) 2,235.0<br />
R332 <strong>Operating</strong> Reserve 300,000 300,000 300,000 300,000 0 -<br />
R333 C & E Progrms HRM 297,938 327,900 287,900 295,110 (32,790) (10.0)<br />
R334 Household Haz. Waste 329,417 393,300 393,300 408,200 14,900 3.8<br />
16,053,597 16,308,400 17,419,000 18,332,106 2,023,706 12.4<br />
Otter Lake<br />
R326 Otter Lake WSF 3,422,822 2,947,700 2,947,700 2,832,200 (115,500) (3.9)<br />
R327 Otter Lake RDF 6,240,686 6,927,300 6,927,300 7,136,900 209,600 3.0<br />
R329 Otter Lake FEP 9,752,730 10,090,400 9,528,358 11,031,600 941,200 9.3<br />
19,416,238 19,965,400 19,403,358 21,000,700 1,035,300 5.2<br />
Waste Resources 26,127,961 27,032,600 27,935,574 29,727,099 2,694,499 10.0<br />
Solid Waste Services 26,721,715 27,340,300 28,243,274 30,022,399 2,682,099 9.8<br />
<strong>Regional</strong> Transportation Plann<br />
R951 <strong>Regional</strong> Trans.Plann 488,970 544,000 524,100 469,391 (74,609) (13.7)<br />
488,970 544,000 524,100 469,391 (74,609) (13.7)<br />
Total $132,442,694 $99,028,770 $103,963,076 $97,082,486 -$1,946,284 (2.0)<br />
O38
Transportation & Public Works<br />
Summary by Expenditure & Revenue Types<br />
2008-2009 2009-2010 2009-2010 2010-2011 Change over<br />
Actual Budget Projections Budget Budget Var as %<br />
Expenditures<br />
Compensation & Benefits 76,802,961 80,020,500 80,775,595 84,485,512 4,465,012 5.6<br />
Office 888,825 1,207,500 1,183,936 1,196,831 (10,669) (0.9)<br />
Professional Fees 19,473,144 20,425,000 21,173,739 456,587 (19,968,413) (97.8)<br />
Legal & Consulting Fees 108,173 175,100 193,500 153,212 (21,888) (12.5)<br />
External Services 31,283,478 27,649,600 31,023,109 50,993,193 23,343,593 84.4<br />
Uniforms & Clothing 530,283 564,300 478,082 597,810 33,510 5.9<br />
Salt 3,116,338 1,600,600 2,868,000 1,602,200 1,600 0.1<br />
Supplies & Materials 3,204,367 2,873,800 3,009,484 2,757,857 (115,943) (4.0)<br />
Utilities 10,005,178 11,073,100 11,101,020 10,334,575 (738,525) (6.7)<br />
Building Costs 4,393,530 4,481,700 5,347,080 4,513,466 31,766 0.7<br />
Equipment & Communications 8,041,709 4,016,700 6,141,464 4,030,119 13,419 0.3<br />
Vehicle Expense 21,025,593 20,638,100 18,991,238 18,435,075 (2,203,025) (10.7)<br />
Travel 382,587 449,000 363,959 372,590 (76,410) (17.0)<br />
Training & Education 166,615 307,700 279,976 322,203 14,503 4.7<br />
Facilities Rental 2,596,799 3,151,500 2,793,743 3,179,100 27,600 0.9<br />
Advertising & Promotion 570,110 606,900 576,060 524,631 (82,269) (13.6)<br />
Other Goods & Services 1,637,548 2,002,170 1,886,710 2,121,563 119,393 6.0<br />
Interdepartmental (8,454,652) (7,902,000) (8,041,208) (7,561,134) 340,866 (4.3)<br />
Debt-Interest 2,538,078 2,006,800 2,013,600 2,067,450 60,650 3.0<br />
Debt Principal 9,019,065 6,688,900 6,688,900 7,751,700 1,062,800 15.9<br />
Insurance Costs 36,807 20,300 20,300 20,300 0 -<br />
Transfer to/from Reserves 2,759,441 3,613,500 2,854,818 3,329,304 (284,196) (7.9)<br />
Other Fiscal (3,651,854) (972,600) (3,639,000) (1,121,300) (148,700) 15.3<br />
Prior year Surplus/Deficit 1,309,477 322,449 322,449 (47,700) (370,149) (114.8)<br />
Expenditures 187,783,600 185,020,619 188,406,554 190,515,144 5,494,525 3.0<br />
Total $187,783,600 $185,020,619 $188,406,554 $190,515,144 $5,494,525 3.0<br />
Revenues<br />
Tax Revenues (226,400) (1,300) (1,300) (1,300) 0 -<br />
Area Rate Revenue (2,638,137) (30,666,649) (30,666,649) (36,779,713) (6,113,064) 19.9<br />
Payments in Lieu of taxes 456 0 0 0 0 -<br />
Transfers from other Gov'ts (3,959,903) (3,479,300) (2,986,300) (3,019,636) 459,664 (13.2)<br />
Licenses & Permits (251,023) (249,000) (227,000) (369,000) (120,000) 48.2<br />
Rental & Leasing (2,939,171) (3,181,300) (3,309,786) (3,578,300) (397,000) 12.5<br />
Transit Revenue (28,244,890) (31,841,100) (30,025,700) (32,855,400) (1,014,300) 3.2<br />
Recreational Revenue (3,726) 0 (1,814) 0 0 -<br />
Tipping Fees - Waste Resource (11,157,151) (11,301,500) (11,068,815) (11,823,815) (522,315) 4.6<br />
Sales Revenue (2,606,454) (2,188,800) (2,399,152) (2,673,094) (484,294) 22.1<br />
Environmental Protection Levi 0 0 (419) 0 0 -<br />
Other Revenue (3,314,508) (2,998,800) (3,672,443) (2,248,300) 750,500 (25.0)<br />
Interdepartmental Revenue 0 (84,100) (84,100) (84,100) 0 -<br />
Revenues (55,340,906) (85,991,849) (84,443,478) (93,432,658) (7,440,809) 8.7<br />
Total (55,340,906) (85,991,849) (84,443,478) (93,432,658) (7,440,809) 8.7<br />
Net Cost $132,442,694 $99,028,770 $103,963,076 $97,082,486 -$1,946,284 (2.0)<br />
O39
Reserves<br />
Purpose of Reserves<br />
Reserves are utilized to improve the process of visionary planning for HRM’s future needs. In general,<br />
Reserve Funds are intended to serve three purposes:<br />
1 They allow for a smoothing of expenditures that might otherwise require an extreme single year outlay<br />
(i.e. equipment expenditures and snow-removal expenditures);<br />
2 They allow for long term planning of major capital expenditures such as the opening and closing of<br />
land-fill cells, and the Harbour Solutions Project; and<br />
3 They assist with cash flow management and can reduce the issuance of debt, acting as “savings” for<br />
future needs.<br />
Therefore, reserves are a means by which HRM can accumulate funds for an anticipated future<br />
requirement. This differs from the <strong>Operating</strong> Budget (General Fund) which, in accordance with<br />
the<strong>Halifax</strong> <strong>Regional</strong> <strong>Municipality</strong> Charter, must budget for a year-end net balance of zero.<br />
Strategies for Reserves<br />
The Reserves Policy approved by <strong>Regional</strong> Council on December 1, 1998 implemented the following<br />
strategies:<br />
< Reserve funding is incorporated into a financial plan as an integral part of the <strong>Operating</strong> and Capital<br />
Budgets.<br />
< Each reserve has its purpose clearly defined in a Business Case plan. The Business Case must<br />
also include the source and application of funds, the expected time line and any appropriate<br />
maximum amount, and projected annual contributions, withdrawals, and balances.<br />
< Reserves are centrally administered so as to ensure consideration for the whole organization.<br />
< Withdrawals from Reserves must be approved by <strong>Regional</strong> Council.<br />
Other aspects of the Policy include the payment of interest to the reserves, the segregating of each<br />
reserve in the accounting records, and ensuring that reserves will not be in a deficit position.<br />
P1
Equipment and <strong>Operating</strong> Reserves<br />
These reserves are established following the very general guidelines outlined in the Financial Reporting and<br />
Accounting Manual, Section 3.15 as issued by the Province of Nova Scotia. Their general intent is to save<br />
for large expenditures on equipment by appropriating funds from operating.<br />
Equipment Reserves:<br />
Q204 General Fleet (1997): To provide for replacement of fleet vehicles and equipment with a useful life of<br />
less than 10 years for Transportation and Public Works, including Parks and Metro Transit. Funding to come<br />
from the operating budget of Fiscal Services (M310), sale of surplus vehicles and from interest paid to the<br />
reserve.<br />
Q205 Police Vehicles (1998): To provide for replacement of Police Service vehicles with a useful life of<br />
less than 10 years. Funding to come from the operating budget of Fiscal Services (M310), sale of surplus<br />
vehicles and from interest paid to the reserve.<br />
Q206 Fire Vehicles (2000): To provide for replacement of Fire & Emergency Service utility vehicles (cars,<br />
vans, and light trucks), and firefighting equipment as they reach the end of their useful life. Also, to provide<br />
partial financing for the replacement of firefighting apparatus (heavy firefighting trucks). Funding to come<br />
from the operating budget of Fiscal Services (M471), sale of surplus vehicles and from interest paid to the<br />
reserve.<br />
Q213 Fuel Systems (Pre-amalgamation): To provide for upgrade and replacement of HRM regional fuel<br />
depots. The source of funding which stopped flowing to the reserve prior to 1999 was $0.01 of the $0.02<br />
per litre surcharge applied to HRM Business Units and outside agencies based on the litres of fuel issued<br />
through HRM Fuel Depots. Post-1999, the only funding source to the reserve are interest payments.<br />
P2
<strong>Operating</strong> Reserves:<br />
Q306 Self Insurance (2006): To provide funds for settlement of insured risks to HRM and to reduce the<br />
expenses associated with insurance costs by increasing the minimum deductible provided in HRM’s policy.<br />
The costs related to insurance and risk can fluctuate greatly each year. The HRM, at any time, has an amount<br />
of claims outstanding. This reserve will provide an amount to stabilize the fluctuation of these costs and<br />
reserve monies for outstanding claims. Funding to come from the operating budget of Fiscal Services (M323)<br />
and from interest paid to the reserve.<br />
Q308 Operations Stabilization (1999): Many regular operating expenditures fluctuate from year to year<br />
based on demand for the service. Occasionally, an unusual fluctuation occurs which is significantly greater<br />
than the normal expenditure pattern and which cannot reasonably be covered within available funding. This<br />
reserve can be used to smooth significant fluctuations in expenditures which cannot be anticipated and are<br />
beyond the control of the organization. Funding to come from the operating budget<br />
of Fiscal Services (M411) and from interest paid to the reserve.<br />
Q309 Snow & Ice Control Variable <strong>Operating</strong> (1999): This reserve provides funding for costs associated<br />
with snow and ice control which are beyond that provided for in the annual operating budget. Given the<br />
unpredictability of winter weather, it is prudent to plan for the contingency that any one winter may place<br />
an onerous burden on the resources of the <strong>Municipality</strong>. Funding to come from <strong>Operating</strong> Budget (M471).<br />
Q310 Service Improvement (2003): This reserve will be used to provide loans for business redesign projects<br />
that improve the <strong>Municipality</strong>’s business processes and for which seed capital is required. Eligible projects<br />
must demonstrate anticipated down stream benefits that will result from reworking processes and activities.<br />
Funding to come in the form of loan repayments (principal & interest) from projects. Also, any operating<br />
surplus at the end of the year from Fiscal Services (M421) may be directed into this reserve to replenish<br />
withdrawals that are not repayable.<br />
Q311 Cemetery Maintenance (2000): This reserve provides funds for perpetual care maintenance for<br />
cemeteries not already provided for in existing Cemetery Trust Accounts. Funding to come from the sale of<br />
Mount Hermon cemetery lots and from interest paid on the reserve.<br />
Q312 Culture Development Reserve (2003): This reserve is used to provide funding to prepare heritage<br />
and cultural sites for increased access by citizens and tourists in a way that presents, promotes and preserves<br />
them for future generations. Funding to come from 10% of HRM’s sale of land, corporate donations and,<br />
public (Provincial & Federal) contributions.<br />
Q313 Municipal Elections (2001): Funds from this reserve are allocated for the purpose of conducting<br />
special and regular elections pursuant to legislation. In addition, the election reserve will provide for a small<br />
amount of funding ($2,000 - $3,000 annually) for the purpose of updating the election database (civic<br />
addresses and street ranges within polls/districts), ensuring critical information is current and in place for<br />
special, and in particular, regular elections. Funding to come from operating budgets of Fiscal Services<br />
(M471) & Administrative Services (A125) and from interest paid to reserve.<br />
P3
Q314 Emergency Measures Organization (EMO) Cost Recovery (2001): This reserve provides funding to<br />
offset the costs associated with responding to large-scale emergencies. Because such emergencies are<br />
unpredictable and very expensive, business units do not normally provide funding for them within their<br />
operating budgets. Funding to come from operating budget of Emergency Measures Cost Recovery (A451)<br />
and from interest paid to reserve.<br />
Q315 Marketing Levy Special Events (2001): This reserve provides funding to attract and host exceptional<br />
Tourism, Culture, & Heritage events, that typically are national or international in caliber and occur on an<br />
infrequent basis, where the <strong>Municipality</strong> provides a leading and/or hosting role. Funding to come directly<br />
from the 2% Hotel Marketing Levy collected (only 40% of this amount is allocated to fund this reserve) and<br />
from interest paid to reserve.<br />
Q316 DNA Costs (HRP and RCMP) (2001): This reserve provides funding to pay for the costs of<br />
conducting DNA evidentiary analysis for the <strong>Halifax</strong> <strong>Regional</strong> Police and the RCMP. The Federal<br />
government charges each province a flat fee; the reserve covers the municipal component. Funding to come<br />
from the operating budget of Fiscal Services (M319) and from interest paid to the reserve.<br />
Q317 Titanic Reserve (2002): This reserve is used to maintain existing monuments, markers, and<br />
interpretive panels and create new ones related to the famous ocean liner, and to design and publish<br />
interpretive materials. The reserve is largely funded from donations.<br />
Q318 Library Capital Campaign (2005): This reserve is used to fund the Central Library fund raising<br />
capital campaign. Any additional funds beyond that required to cover campaign costs will be transferred to<br />
the capital project for architectural design fees, construction, materials, furniture and equipment for the<br />
Central Library. Funding will be from Provincial grant increases paid to the <strong>Halifax</strong> <strong>Regional</strong> Library and<br />
from interest paid to the reserve.<br />
Q319 Major Events Facilities (2006): This reserve is used for the development of major cultural and<br />
public event facilities. Funding to come from surplus form <strong>Halifax</strong> Metro Cente and from interest paid to<br />
the reserve.<br />
Q320 <strong>Operating</strong> Costs of New Capital (2006): This reserve is used to smooth fluctuations in operating costs<br />
of new capital due to the timing of completion of related capital projects. Any initial implementation and<br />
operating costs associated with a new capital asset are budgeted in the same year as the capital project. For a<br />
variety of reasons, completion of capital projects may occur later than the end of the year in which they are<br />
approved. Without a mechanism to carry forward funds, any implementation and initial ongoing operating<br />
funds unexpended at the end of the fiscal year must be re-budgeted in the following fiscal year. This will<br />
produce a favorable variance in the current fiscal year, while putting pressure on the operating budgets in<br />
subsequent years. The unexpended operating costs of new capital funds in the operating budget of Fiscal<br />
Services (M317) will move to this reserve at year end.<br />
P4
Q321 Information and Communication Technologies (2006): To provide a mechanism to capture savings<br />
generated by information or communication technology systems improvements and upgrades. Funds will be<br />
used to support future maintenance, upgrade, and replacement requirements of information or communication<br />
systems. Funding to come from the operating budget of Fiscal Services (M322) and from interest paid to the<br />
reserve.<br />
Q322 Police Emergency/ Extraordinary Investigation: To provide a source of funds for an emergency<br />
event or extraordinary investigation which, because of the complexity, expense, and low frequency of<br />
occurrence, could not be covered by the <strong>Operating</strong> Budget. Funding of the reserve to come from the<br />
<strong>Regional</strong> Police and HRM’s operating budgets depending on the availability of any surplus being realized<br />
at year end.<br />
Q323 Police Officer On the Job Injury (2003): This reserve will be used to provide financial assistance for<br />
sworn officers injured on the job for those injuries not covered by Long Term Disability insurance as provided<br />
by Article 44 of the 2003 MAPP collective agreement. Sworn officers with <strong>Halifax</strong> <strong>Regional</strong> Police opted out<br />
of the Province’s WCB insurance and provide 100% self coverage. Funding to come from Police WCB<br />
operating account depending on the availability of any surplus being realized at year end.<br />
Q324 Commons Enhancement Fund (2006): To provide a source of funds available for the protection and<br />
restoration of the Commons’ turf. Funding to come from hosting partners of all future<br />
events to be held on the Commons<br />
P5
Capital Reserves<br />
The <strong>Halifax</strong> <strong>Regional</strong> Municipal Charter addresses these types of reserves in Sections 99 and 100. The general<br />
intent of these funds is to provide for future contingencies that have a high probability of occurring and have a<br />
long range (5 - 30 years) time line.<br />
Q101 Sale of Capital Assets (1999): It is Council’s intention that this reserve be primarily used for the<br />
acquisition of land, buildings and similar fixed assets. The reserve was created in accordance with the<br />
requirements of Section 99 of the <strong>Halifax</strong> <strong>Regional</strong> <strong>Municipality</strong> Charter. Under this Charter, funds may only<br />
be used for either (1) capital expenditures for which the municipality may borrow; or (2) repayment of the<br />
principal portion of capital debt. Funding is to come from the sale of real property, other than the sale of<br />
Business/Industrial Parks land, Parkland and pre-determined library land; and from interest paid to the reserve.<br />
Q121 Business/Industrial Parks Expansion (1999): This reserve is used exclusively to fund the servicing<br />
and grading of lands for sale in <strong>Municipality</strong> owned business and industrial parks. The reserve was created in<br />
accordance with the requirements of Section 99 of the <strong>Halifax</strong> <strong>Regional</strong> <strong>Municipality</strong> Charter which requires<br />
that any proceeds from the sales of land be deposited into a Capital Reserve fund. Specifically, funding for<br />
this reserve is to come from the sale of land in HRM business and industrial parks and from interest paid to<br />
reserve.<br />
Q103 Capital Surplus (1999): This reserve is for any purpose identified in Section 99 of the <strong>Halifax</strong><br />
<strong>Regional</strong> <strong>Municipality</strong> Charter under the Capital Reserve Section including (1) capital expenditures for<br />
which the <strong>Municipality</strong> may borrow and (2) repayment of the principal portion of capital debt. Funding to<br />
come from any surplus funds remaining from debentures issued, any capital grant not expended, funds in<br />
excess of twenty years in the Tax Sale Surplus Trust account, operating budget of Fiscal Services (M310)<br />
and from interest paid to the reserve.<br />
Q107 Parkland Development (2006): As prescribed by the <strong>Halifax</strong> <strong>Regional</strong> Municipal Charter, the reserve<br />
is used in new residential developments for the acquisition of, and capital improvements to, parks,<br />
playgrounds and similar purposes and may use interest paid for the operation and maintenance costs of<br />
similar public places. The reserve was created in accordance with the requirements of Sections 271 & 273 of<br />
the <strong>Halifax</strong> <strong>Regional</strong> <strong>Municipality</strong> Carter. Funding to come from real estate developers in the form of cash<br />
in-lieu of 5% assessed value of the subdivision’s lots approved for development.<br />
Q119 Sackville Landfill Closure (1996): This reserve was prescribed by the Province in 1996 and is<br />
intended to provide funds to responsibly end the life of the Sackville Landfill site and monitor it thereafter for<br />
environmental impact. The reserve funding comes from operating budget of Solid Waste Services (M431) and<br />
from interest paid to reserve.<br />
Q120 Otter Lake Landfill Closure (1996): This reserve was prescribed by the Province in 1996 and is<br />
intended to provide funds to responsibly end the life of the Otter Lake Landfill site and monitor it thereafter<br />
for environmental impact. It is currently estimated that Otter Lake will accept waste for approximately 25<br />
years. Funding to come from the operating budget of Solid Waste Services (R327) and from interest paid to<br />
reserve.<br />
P6
Q123 Waste Resources (2000): To provide funding for the construction of landfill cells and purchase of<br />
equipment including replacement carts to operate the waste resources program. Funding to come from the<br />
operating budget of Fiscal Services (M461) and from interest paid to the reserve.<br />
Q124 Upper Sackville Turf (2000): This reserve provides funding to offset the costs of maintaining,<br />
upgrading, and eventual replacement of the artificial turf field and amenities at Weir Field in Upper<br />
Sackville. The reserve may also be used for upgrading and replacement of ancillary structures associated<br />
with the field such as lighting, bleachers, and the parking lot. The reserve is funded from 50% of all user<br />
fees generated from the artificial turf facilities.<br />
Q125 Metro Park Parkade (2002): This reserve is used to maintain and upgrade this property owned by<br />
the <strong>Municipality</strong>. The reserve is funded from a percentage of the parking fees collected under Fiscal<br />
Services (M555) and from interest paid to reserve.<br />
Q126 Strategic Growth (2003): The purpose of this reserve is to enable the municipality to respond to<br />
challenges posed to our service and infrastructure capability caused by population growth, rapid urban and<br />
suburban development expansion, changing demographics and rapid technological advancement. The reserve<br />
is meant to allow the municipality to take advantage of opportunities that may arise outside the normal<br />
operating and capital budget during the fiscal year, and to leverage funds from other levels of government and<br />
external agencies. Funding to come from the operating budget of Fiscal Services (M316) and from interest<br />
paid to the reserve.<br />
Q127 Sustainable Community (2004): The purpose of this reserve is to fund environmentally friendly<br />
projects, including those which reduce the environmental impacts of municipal operations and community<br />
activities. Primary funding to come from interest savings on loans from the Federation of Canadian<br />
Municipalities’ Green Municipal Investment Fund and other potential sources are: corporate contributions,<br />
public partnerships, and savings produced from reduced reliance on fossil fuels and from interest paid to the<br />
reserve.<br />
Q128 Rural Fire (2003): This reserve will be used to fund light vehicles (rescue, utility and tactical support),<br />
address health and safety concerns and assist in ensuring rural fire buildings comply to code in order to meet<br />
operational requirements. These safety issues may also include emergency power and accessibility in the<br />
event stations are needed as ‘emergency shelters’. Funding to come from the operating budget of Fire Services<br />
(F793) and from interest paid to the reserve.<br />
Q129 Ferry Replacement (2003): This reserve will be used to fund the mid-life refit of the ferries, which<br />
will extend their useful life from 20 to 40 years, and the replacement of the <strong>Halifax</strong> Harbour passenger ferries<br />
as they reach the end of their useful lives. Because replacement is very expensive (about $8 - $12 million<br />
each) and occurs infrequently, the funding of a reserve will allow the cost to be spread out and absorbed over<br />
many years. Funding to come from the operating budget of Fiscal Services (M321) and from interest paid in<br />
reserve.<br />
Q130 New Capital Replacement (2006): As part of its Long Term Capital strategy, HRM created this<br />
capital replacement reserve for a variety of capital assets that have no such specific reserve. The intent of the<br />
reserve is to fund the replacement of existing capital assets which have reached the end of their useful life.<br />
P7
Priority will be given to projects that support the legislated mandate of the municipality and to projects that<br />
reduce current operating costs. Funding to come from the operating budget of Fiscal Services (M322) and<br />
from interest paid in reserve.<br />
Q131 Energy and Underground Services Co-Location (2004): This reserve will be used to enable the<br />
municipality to respond quickly to opportunities that may arise outside of the normal operating and capital<br />
budget during the fiscal year, and to leverage funds from other levels of government and external agencies to<br />
co-locate under ground services such as natural gas conduit, fibre optic cable, power and telecom lines with<br />
other capital projects. Funding to come from any future net proceeds from the sale of natural gas orphan<br />
systems or conduit assets, annual contribution from the Provincial Department of Energy ending in 2014/15<br />
fiscal year, savings identified from energy projects and from interest paid to reserve.<br />
Q133 Capital Cost Contribution Bedford South Interchange (2006): To fund HRM’s share of an<br />
interchange to be built as per the Bedford South Charge Area plan. Funds will be used for oversized<br />
infrastructure which benefits existing communities in the areas surrounding the charge area. A contribution<br />
will be made annually from the operating budget of Fiscal Services (M310), in the amount of $450,000 with<br />
interest earned at the prevailing market rate being paid to reserves. This contribution will stop in 2011/12<br />
once the required amount of $3,855,000 is fully funded.<br />
Q134 Gas Tax (2006): This reserve is used as a financial vehicle for maintaining the funds received under<br />
the Canada-Nova Scotia Agreement on the Transfer of Federal Gas Tax Revenues. This is in compliance<br />
with the Federal Government requirement for the <strong>Municipality</strong> to maintain a separate accounting for the<br />
funds provided and for the interest earned on unexpended funds. The funds are used to acquire sustainable<br />
infrastructure. As outlined in the Municipal Funding Agreement (2005) between the Province and HRM,<br />
HRM will receive annual Gas Tax funding for the five years April 1, 2005 to March 31, 2010.<br />
Q135 Alderney Gate Recapitalization/Leasehold Improvement (2005): This reserve is used to cover costs<br />
to preserve the structural integrity of the Alderney Gate building and systems, maintenance items that are not<br />
directly recoverable from tenants, leasehold improvements and/or tenant allowances to retain tenants or attract<br />
new tenants at the expiration of leases, etc. Annual funding equivalent to about 1.5% of the 2005 purchase<br />
price of the building escalated to reflect inflation over the period, will come from the operating budget of<br />
Alderney Gate (W203) and from interest paid to the reserve.<br />
Q136 Strategic Transit Fund (2006): As outlined in the Transit Funding Agreement between the Province<br />
of Nova Scotia and <strong>Halifax</strong> <strong>Regional</strong> <strong>Municipality</strong>, HRM will receive annual Strategic Transit funding. This<br />
agreement falls under the Canada-Nova Scotia Agreement on the Transfer of Federal Public Transit Funds.<br />
In return, the municipality is required to use the funds for investment in public transit infrastructure and to<br />
provide accountability documentation to the provincial government, who will act as administrator of the<br />
funds. The <strong>Municipality</strong> is required to maintain a separate accounting for the funds provided and for the<br />
interest earned on unexpended funds. This reserve ended March 31, 2010.<br />
Q137 <strong>Regional</strong> Capital Cost Charges: This reserve is used to fund the growth-related share of regional<br />
infrastructure for which a Capital Cost Contribution (CCC) is collected. CCCs collected for Wastewater<br />
Treatment Facilities and other <strong>Regional</strong> infrastructure will be deposited into the reserve and expended<br />
according to the purpose for which they were collected. The reserve will not be used for area CCCs.<br />
P8
Q138 Community Facility Partnership (2010): This reserve is to provide funding to community non-profit<br />
and public institutions in support of major capital initiatives undertaken as part of a formal partnership<br />
agreement. Funding to come from an annual transfer of funds from the <strong>Operating</strong> Budget within Fiscal<br />
Services (M310).<br />
Q139 Central Library Repayment Reserve: This reserve is to be used to fund HRM’s commitment to the<br />
Central Library capital project. This Reserve is governed by Section 120 of the <strong>Halifax</strong> Charter. Proceeds<br />
from property sold by the <strong>Municipality</strong> must be placed in a Capital Reserve and is governed by the<br />
requirements of the <strong>Halifax</strong> Charter regarding its application. Funding will be provided through the sale of<br />
specific parcels of HRM-Owned properties as outlined in the Report to Council on November 18, 2008 over a<br />
period of 2 to 10 years.<br />
Q140 Central Library Repayment Reserve: This reserve will be used to cover costs to preserve the<br />
structural integrity of the Central Library building, systems, and maintenance items. Funding to come an<br />
annual contribution from Central Library <strong>Operating</strong> Budget. Funding will begin upon completion of the build<br />
in 2013/14 and on the Reserve.<br />
Q108 Kingswood Water (1999): This reserve was originally used to fund the maintenance and upgrade<br />
of the water system in the Kingswood residential subdivision. Funding was through fire protection<br />
charges which were collected by HRM on behalf of HRWC. The reserve is under consideration to be<br />
transferred to the HRWC as part of the EMS/HRWC merger.<br />
Q112 5594-96 Morris St (2006): This reserve is used to maintain and upgrade this leased property owned by<br />
the <strong>Municipality</strong>. Funding to come from about 4% of annual revenues generated through lease agreements and<br />
interest earned on the reserve.<br />
Q113 Rockingham Community Centre (2006): This reserve is used to maintain and upgrade this leased<br />
property owned by the <strong>Municipality</strong>. Funding to come from about 4% of annual revenues generated through<br />
lease agreements and interest earned on the reserve.<br />
Q115 Captain William Spry Centre (2006): This reserve is used to maintain and upgrade this leased<br />
property owned by the <strong>Municipality</strong>. Funding to come from about 4% of annual revenues generated<br />
through lease agreements and interest earned on the reserve.<br />
Q116 Richmond School (2006): To provide for major repairs and renovations to this building in accordance<br />
with the terms of the lease. Funding to come from about 4% of annual revenues generated through lease<br />
agreements and interest earned on the reserve.<br />
The following tables are the cash-flow projections for all Reserve Funds for the fiscal year ending<br />
March 31, 2010 based on the 2009-2010 Proposed <strong>Operating</strong> , Capital and Reserve Budgets.<br />
P9
HALIFAX REGIONAL MUNICIPALITY<br />
PROPOSED RESERVE BUDGET 2010/11<br />
TO MARCH 31, 2011<br />
Budget<br />
Projected<br />
Projected Balance<br />
31-Mar-10 Contributions Interest Withdrawals 31-Mar-11<br />
Equipment Reserves $1,992,790 $420,000 $18,598 ($330,000) $2,101,388<br />
<strong>Operating</strong> Reserves $16,485,670 $15,457,513 $212,173 ($7,564,922) $24,590,434<br />
Capital Reserves $23,192,665 $66,347,512 $380,368 ($53,939,142) $35,981,402<br />
$41,671,124 $82,225,025 $611,139 ($61,834,064) $62,673,224<br />
P10
HALIFAX REGIONAL MUNICIPALITY<br />
PROPOSED EQUIPMENT & OPERATING RESERVE FUNDS BUDGET<br />
Projected 2010/11 2010/11 2010/11 Projected<br />
Available 2010/11 2010/11 Capital <strong>Operating</strong> Other Available<br />
Balance Budgeted Projected Budget Budget Budgeted Balance<br />
March 31/10 Contributions Interest Withdrawals Withdrawals Withdrawals March 31/11<br />
Equipment Reserves<br />
Q204 General Fleet 1,490,664 65,000 12,337 0 0 0 1,568,001<br />
Q205 Police Vehicles 250,368 30,000 2,188 0 0 0 282,556<br />
Q206 Fire Vehicles 449,756 325,000 3,839 -330,000 0 0 448,595<br />
Q213 Fuel System 29,124 0 234 0 0 0 29,358<br />
Total Equipment Reserves 1,992,790 420,000 18,598 -330,000 0 0 2,101,388<br />
<strong>Operating</strong> Reserves<br />
Q306 Self Insurance 3,171,876 0 26,121 0 -353,200 0 2,844,797<br />
Q308 Operations Stabilization 556,519 2,473,700 18,019 0 0 0 3,048,238<br />
Q309 Snow & Ice Control 3,727,641 4,677,211 55,430 0 0 0 8,460,282<br />
Q310 Service Improvement 1,675,496 247,300 15,344 0 -144,235 0 1,793,905<br />
Q311 Cemetery Maintenance 149,892 1,667 1,214 0 0 0 152,772<br />
Q312 Culture Development Reserve 666,248 529,210 3,283 -375,000 -235,000 -300,000 288,741<br />
Q313 Municipal Elections 575,448 603,100 7,909 0 0 1,186,457<br />
Q314 EMO Cost Recovery 272,751 0 1,896 0 0 0 274,647<br />
Q315 Marketing Levy Special Events 65,027 1,425,000 1,941 -125,000 -225,000 -957,500 184,467<br />
Q316 DNA Costs (HRP and RCMP) 104,569 113,025 747 0 -109,300 0 109,042<br />
Q317 Titanic Reserve 5,895 0 47 0 0 0 5,942<br />
Q318 * Library Capital Campaign -1,281,737 760,800 0 0 0 0 -520,937<br />
Q319 Major Events Facilities 955,356 0 22,339 0 0 -31,683 946,012<br />
Q320 <strong>Operating</strong> Cost of Capital 125,338 3,673,500 11,791 0 -3,673,500 0 137,129<br />
Q321 Information & Communication Tech 3,180,132 500,000 23,246 -962,000 -73,504 0 2,667,874<br />
Q322 Police Emergency/Extraordinary Investigation 654,833 0 5,264 0 0 0 660,097<br />
Q323 Police Officer On the Job Injury 566,214 0 4,552 0 0 0 570,765<br />
Q324 Commons Enhancement 1,015 0 8 0 0 0 1,023<br />
Q325 Provincially Funded Police Officers & Facilty Lease 1,313,158 453,000 13,022 0 0 0 1,779,180<br />
Total <strong>Operating</strong> Reserves 16,485,670 15,457,513 212,173 -1,462,000 -4,813,739 -1,289,183 24,590,434<br />
Total Equipment & <strong>Operating</strong> Reserves 18,478,460 15,877,513 230,771 -1,792,000 -4,813,739 -1,289,183 26,691,822<br />
* Projected balance is negative as the 3 year commitment for library is reflected in total commitments. Finance will monitor to ensure Reserve<br />
is not in a negative balance, per the Reserve Policy<br />
P11
HALIFAX REGIONAL MUNICIPALITY<br />
PROPOSED CAPITAL RESERVE FUNDS BUDGET<br />
to March 31, 2011<br />
Capital Reserves<br />
Projected 2010/11 2010/11 2010/11 Projected<br />
Available 2010/11 2010/11 Capital <strong>Operating</strong> Other Available<br />
Balance Budgeted Projected Budget Budget Budgeted Balance<br />
March 31/10 Contributions Interest Withdrawals Withdrawals Withdrawals March 31/11<br />
Q101 Sale of Capital Assets -3,515,626 5,548,802 7,826 0 -529,210 1,511,792<br />
Q121 Business/Industrial Parks Expansion -1,754,362 9,013,853 8,867 -7,266,666 0 0 1,691<br />
Q103 Capital Surplus 1,142,112 0 13,752 0 0 0 1,155,863<br />
Q107 Parkland Development 488,486 500,000 4,801 -640,000 0 0 353,287<br />
Q119 Sackville Landfill Closure 4,642,870 0 36,072 -338,000 -333,500 0 4,007,443<br />
0<br />
Q120 Otter Lake Landfill Closure 1,302,224 2,403,018 9,364 -3,075,700 0 638,907<br />
Q123 Waste Resources -84,066 10,300,000 39,660 -1,975,000 0 0 8,280,594<br />
Q124 Upper Sackville Turf 273,027 25,000 2,343 0 0 0 300,369<br />
Q125 Metro Park Parkade 1,657,893 223,800 15,116 -60,000 0 0 1,836,809<br />
Q126 Strategic Growth 3,075,754 5,025,000 33,019 -5,666,000 0 0 2,467,773<br />
Q127 Sustainable Communities 75,853 295,025 2,127 -50,000 -290,733 0 32,272<br />
Q128 Rural Fire 406,635 250,000 3,363 -250,000 0 0 409,998<br />
Q129 Ferry Replacement 6,885,249 1,300,000 52,057 -2,000,000 0 0 6,237,306<br />
Q130 New Capital Replacement 2,699,206 127,340 22,133 0 0 0 2,848,679<br />
Q131 Energy & Underground Services 585,723 541,480 5,830 -363,000 0 0 770,033<br />
Q133 CCC Bedford South Interchange 80,306 450,000 8,494 -450,000 0 0 88,800<br />
Q134 Gax Tax Reserve 2,368,032 25,000,000 47,277 -25,000,000 0 0 2,415,309<br />
Q135 Alderney Gate Recapitalization 478,250 405,200 5,084 -310,000 0 0 578,533<br />
Q137 <strong>Regional</strong> Capital Cost Contribution 1,807,784 931,120 6,340 -1,478,000 0 0 1,267,244<br />
Q138 Community Facility Partnership 500,000 0 8,039 0 -500,000 8,039<br />
Q139 Central Library Repayment Reserve 0 4,000,000 48,255 -3,333,333 0 0 714,922<br />
Q140 Central Library Recapitalizaton Reserve 0 0 0 0 0 0 0<br />
Q108 Kingswood Water 3,768 0 30 0 0 0 3,798<br />
Q112 5594-96 Morris St 57,478 7,874 390 0 -30,000 0 35,743<br />
Q113 Rockingham Community Centre 13,231 0 106 0 0 0 13,337<br />
Q115 Captain William Spry 1,731 0 14 0 0 0 1,745<br />
Q116 Richmond School 1,107 0 9 0 0 0 1,116<br />
Total Capital Reserves 23,192,665 66,347,512 380,368 -52,255,699 -654,233 -1,029,210 35,981,402<br />
P12
<strong>Halifax</strong> <strong>Regional</strong> <strong>Municipality</strong><br />
Asset Class<br />
Total Gross<br />
Budget<br />
Cost<br />
Sharing<br />
DRAFT Project Budget FY<br />
Reserves<br />
2010<br />
LIC /Area Rate<br />
CCC<br />
Total Funding<br />
Borrowing and<br />
Other Transfers<br />
Impact on<br />
<strong>Operating</strong><br />
Budget This<br />
Year<br />
Buildings 54,896,333 17,693,333 9,732,333 1,650,000 29,075,666 25,820,667 2,095,500<br />
Business Tools 1,705,000 962,000 962,000 743,000 802,500<br />
Community & Property Development 2,892,000 500,000 500,000 1,000,000 1,892,000 153,000<br />
District Activity Funds 1,495,000 1,495,000<br />
Equipment & Fleet 8,323,200 616,000 616,000 7,707,200<br />
Industrial Parks 15,600,000 8,333,334 7,266,666 15,600,000 0<br />
Metro Transit 23,638,300 2,000,000 2,000,000 21,638,300 5,420,200<br />
Parks and Playgrounds 9,497,333 3,785,000 640,000 4,425,000 5,072,333 247,000<br />
Roads & Streets 20,516,000 2,250,000 1,766,000 4,016,000 16,500,000<br />
Sidewalks, Curbs & Gutters 3,245,000 875,000 875,000 2,370,000 15,000<br />
Solid Waste 8,623,700 1,757,000 6,866,700 8,623,700 0 50,000<br />
Traffic Improvements 6,819,000 35,000 450,000 225,000 710,000 6,109,000 78,000<br />
Totals for FY2010 157,250,866 34,353,667 29,033,699 4,291,000 225,000<br />
67,903,366 89,347,500 8,861,200<br />
Cost Sharing<br />
Reserves<br />
LIC / Area Rate<br />
CCC<br />
Total Funding<br />
34,353,667<br />
29,033,699<br />
4,291,000<br />
225,000<br />
67,903,366<br />
Capital From <strong>Operating</strong> 28,895,624<br />
Capital Surplus 0<br />
Crespool 300,000<br />
Debt 30,344,833<br />
Gas Tax 25,604,043<br />
<strong>Operating</strong> Budget 4,203,000<br />
Total Borrowing Other Transfers 89,347,500<br />
Q1
<strong>Halifax</strong> <strong>Regional</strong> <strong>Municipality</strong><br />
Asset Class<br />
Total Gross<br />
Budget<br />
Cost<br />
Sharing<br />
Proposed Project Budget FY 2011<br />
Reserves<br />
Local<br />
Improvement<br />
Charges /Area<br />
Rate<br />
Capital<br />
Contribution<br />
Charges<br />
Total Funding<br />
Borrowing and<br />
Other Transfers<br />
Impact on<br />
<strong>Operating</strong><br />
Budget This<br />
Year<br />
Buildings 39,659,000 14,666,667 7,628,333 22,295,000 17,364,000 -810,000<br />
Business Tools 6,713,000 3,030,000 3,030,000 3,683,000 585,800<br />
Community & Property Development 10,365,000 5,000,000 5,000,000 5,365,000 100,000<br />
District Activity Funds 1,495,000 1,495,000<br />
Equipment & Fleet 9,101,000 430,000 430,000 8,671,000<br />
Industrial Parks 21,100,000 21,100,000 21,100,000 0<br />
Metro Transit 27,519,000 450,000 4,500,000 4,950,000 22,569,000 3,362,600<br />
Parks and Playgrounds 5,600,000 500,000 500,000 5,100,000 162,000<br />
Roads & Streets 20,757,000 1,250,000 1,887,500 3,137,500 17,619,500<br />
Sidewalks, Curbs & Gutters 4,025,000 1,062,500 1,062,500 2,962,500<br />
Solid Waste 22,179,500 21,744,500 21,744,500 435,000 50,000<br />
Traffic Improvements 14,026,000 35,000 380,000 2,145,000 2,560,000 11,466,000 76,000<br />
Totals for FY2011 182,539,500 21,401,667 59,312,833 2,950,000 2,145,000<br />
85,809,500 96,730,000 3,526,400<br />
Cost Sharing<br />
Reserves<br />
Local Improvement Charge / Area Rate<br />
Capital Contribution Charges<br />
Total Funding<br />
21,401,667<br />
59,312,833<br />
2,950,000<br />
2,145,000<br />
85,809,500<br />
Capital From <strong>Operating</strong> 27,566,511<br />
Capital Surplus 0<br />
Crespool 300,000<br />
Debt 33,393,489<br />
Gas Tax 25,000,000<br />
<strong>Operating</strong> Budget 10,470,000<br />
Total Borrowing Other Transfers 96,730,000<br />
Q2
<strong>Halifax</strong> <strong>Regional</strong> <strong>Municipality</strong><br />
Asset Class<br />
Total Gross<br />
Budget<br />
Cost<br />
Sharing<br />
Proposed Project Budget FY 2012<br />
Reserves<br />
Local<br />
Improvement<br />
Charges /Area<br />
Rate<br />
Capital<br />
Contribution<br />
Charges<br />
Total Funding<br />
Borrowing and<br />
Other Transfers<br />
Impact on<br />
<strong>Operating</strong><br />
Budget This<br />
Year<br />
Buildings 35,038,000 14,000,000 7,323,000 21,323,000 13,715,000 1,449,000<br />
Business Tools 2,000,000 2,000,000 155,000<br />
Community & Property Development 6,070,000 1,000,000 1,000,000 5,070,000 100,000<br />
District Activity Funds 1,495,000 1,495,000<br />
Equipment & Fleet 11,815,000 380,000 380,000 11,435,000 24,000<br />
Industrial Parks 21,100,000 21,100,000 21,100,000 0<br />
Metro Transit 23,503,000 1,800,000 1,800,000 21,703,000 5,423,300<br />
Parks and Playgrounds 6,400,000 500,000 500,000 5,900,000 145,000<br />
Roads & Streets 28,000,000 1,250,000 2,000,000 3,250,000 24,750,000<br />
Sidewalks, Curbs & Gutters 4,775,000 1,250,000 1,250,000 3,525,000<br />
Solid Waste 6,764,000 6,029,000 6,029,000 735,000 50,000<br />
Traffic Improvements 10,607,000 135,000 135,000 10,472,000 25,000<br />
Totals for FY2012 157,567,000 16,250,000 37,132,000 3,250,000 135,000<br />
56,767,000 100,800,000 7,371,300<br />
Cost Sharing<br />
Reserves<br />
Local Improvement Charge / Area Rate<br />
Capital Contribution Charges<br />
Total Funding<br />
16,250,000<br />
37,132,000<br />
3,250,000<br />
135,000<br />
56,767,000<br />
Capital From <strong>Operating</strong> 32,761,761<br />
Capital Surplus 0<br />
Crespool 300,000<br />
Debt 34,953,239<br />
Gas Tax 25,000,000<br />
<strong>Operating</strong> Budget 7,785,000<br />
Total Borrowing Other Transfers 100,800,000<br />
Q3
<strong>Halifax</strong> <strong>Regional</strong> <strong>Municipality</strong><br />
Asset Class<br />
Total Gross<br />
Budget<br />
Cost<br />
Sharing<br />
Proposed Project Budget FY 2013<br />
Reserves<br />
Local<br />
Improvement<br />
Charges /Area<br />
Rate<br />
Capital<br />
Contribution<br />
Charges<br />
Total Funding<br />
Borrowing and<br />
Other Transfers<br />
Impact on<br />
<strong>Operating</strong><br />
Budget This<br />
Year<br />
Buildings 14,550,000 350,000 350,000 14,200,000 300,000<br />
Business Tools 2,000,000 2,000,000 98,000<br />
Community & Property Development 4,100,000 4,100,000 100,000<br />
District Activity Funds 1,495,000 1,495,000<br />
Equipment & Fleet 9,786,000 380,000 380,000 9,406,000<br />
Industrial Parks 23,100,000 23,100,000 23,100,000 0<br />
Metro Transit 21,953,000 21,953,000 3,122,900<br />
Parks and Playgrounds 6,500,000 500,000 500,000 6,000,000 155,000<br />
Roads & Streets 30,915,000 1,250,000 2,000,000 3,250,000 27,665,000<br />
Sidewalks, Curbs & Gutters 7,000,000 2,000,000 2,000,000 5,000,000<br />
Solid Waste 5,950,000 5,215,000 5,215,000 735,000 50,000<br />
Traffic Improvements 10,557,000 10,557,000 34,000<br />
Totals for FY2013 137,906,000 1,250,000 29,545,000<br />
4,000,000 34,795,000 103,111,000 3,859,900<br />
Cost Sharing<br />
Reserves<br />
Local Improvement Charge / Area Rate<br />
Capital Contribution Charges<br />
Total Funding<br />
1,250,000<br />
29,545,000<br />
4,000,000<br />
34,795,000<br />
Capital From <strong>Operating</strong> 35,167,042<br />
Capital Surplus 0<br />
Crespool 300,000<br />
Debt 34,948,958<br />
Gas Tax 25,000,000<br />
<strong>Operating</strong> Budget 7,695,000<br />
Total Borrowing Other Transfers 103,111,000<br />
Q4
<strong>Halifax</strong> <strong>Regional</strong> <strong>Municipality</strong><br />
Asset Class<br />
Total Gross<br />
Budget<br />
Cost<br />
Sharing<br />
Proposed Project Budget FY 2014<br />
Reserves<br />
Local<br />
Improvement<br />
Charges /Area<br />
Rate<br />
Capital<br />
Contribution<br />
Charges<br />
Total Funding<br />
Borrowing and<br />
Other Transfers<br />
Impact on<br />
<strong>Operating</strong><br />
Budget This<br />
Year<br />
Buildings 16,050,000 350,000 350,000 15,700,000<br />
Business Tools 2,000,000 2,000,000<br />
Community & Property Development 2,000,000 2,000,000 100,000<br />
District Activity Funds 1,495,000 1,495,000<br />
Equipment & Fleet 8,880,000 380,000 380,000 8,500,000<br />
Industrial Parks 16,100,000 16,100,000 16,100,000 0<br />
Metro Transit 20,028,000 20,028,000 2,765,500<br />
Parks and Playgrounds 6,500,000 500,000 500,000 6,000,000 155,000<br />
Roads & Streets 34,115,000 1,250,000 2,000,000 3,250,000 30,865,000<br />
Sidewalks, Curbs & Gutters 10,000,000 2,500,000 2,500,000 7,500,000<br />
Solid Waste 2,321,000 1,586,000 1,586,000 735,000 50,000<br />
Traffic Improvements 10,357,000 10,357,000 30,000<br />
Totals for FY2014 129,846,000 1,250,000 18,916,000<br />
4,500,000 24,666,000 105,180,000 3,100,500<br />
Cost Sharing<br />
Reserves<br />
Local Improvement Charge / Area Rate<br />
Capital Contribution Charges<br />
Total Funding<br />
1,250,000<br />
18,916,000<br />
4,500,000<br />
24,666,000<br />
Capital From <strong>Operating</strong> 38,819,000<br />
Capital Surplus 0<br />
Crespool 300,000<br />
Debt 34,626,000<br />
Gas Tax 25,000,000<br />
<strong>Operating</strong> Budget 6,435,000<br />
Total Borrowing Other Transfers 105,180,000<br />
Q5
<strong>Halifax</strong> <strong>Regional</strong> Muncipality<br />
Proposed Projects - Alphabetical Listing<br />
Buildings<br />
Project Number Project Name<br />
2010 2011 2012 2013 2014<br />
CBX01154 Accessibility - HRM Facilities<br />
150,000 200,000 200,000 200,000 200,000<br />
CBX01157 Alderney Gate Recaptalization(Bundle)<br />
310,000 295,000 323,000 350,000 350,000<br />
CBX01151 All Buildings Program (Bundle)<br />
610,000<br />
CBX01274 Architecture - Exterior (Category 2)<br />
85,000 50,000 50,000 100,000 100,000<br />
CBX01273 Architecture - Interior (Category 5)<br />
1,050,000 400,000 450,000 500,000 500,000<br />
CBX01281 Beaverbank Community Centre<br />
4,000,000 500,000<br />
CBX01144 Bedford 4-pad Arena<br />
18,333,000<br />
CB100091 Canada Games Centre<br />
4,000,000 500,000<br />
CBX01148 Centennial Pool Upgrades<br />
2,700,000<br />
CBW00978 Central Library<br />
10,000,000 22,000,000 21,000,000<br />
CBX01268 Consulting - Buildings (Category 0)<br />
87,000 250,000 60,000 250,000 250,000<br />
CBX01211 East Dartmouth Fire Station<br />
500,000 4,000,000<br />
CBX01275 Electrical (Category 7)<br />
165,000 650,000 650,000 650,000 650,000<br />
CBX01161 Energy Efficiency Projects<br />
513,000 500,000 500,000 500,000 500,000<br />
CBX01102 Fire Station Land Acquisition<br />
735,000<br />
CBM00711 Fuel Depot Upgrades<br />
400,000 400,000 400,000 400,000<br />
CBX01046 <strong>Halifax</strong> City Hall Stone Restoration<br />
1,333,333 2,000,000 2,000,000<br />
CBX01100 Herring Cove Fire Station<br />
2,700,000<br />
CBX01168 HRM Heritage Bldings Upgrds(Bndle)<br />
300,000<br />
CBX01210 Hubley Fire Station<br />
2,750,000<br />
CBX01152 Major Facilities-Upgrades (Bundle)<br />
2,101,000 3,258,000 1,500,000 6,500,000 6,500,000<br />
CBX01269 Mechanical (Category 6)<br />
400,000 860,000 1,185,000 1,000,000 1,000,000<br />
CBX01140 Metropark Upgrades<br />
60,000 60,000<br />
CBX01103 New Bedford West Fire Station<br />
3,500,000 1,500,000<br />
CBX01141 North Preston Community Centre Expansion<br />
1,000,000<br />
CBX01282 Porter's Lake Community Centre<br />
2,144,000 1,056,000<br />
CBX01272 Roof (Category 3)<br />
660,000 505,000 535,000 1,200,000 700,000<br />
CBX01271 Site Work (Category 1)<br />
325,000 1,040,000 60,000 200,000 200,000<br />
CBX01056 Strategic Community Facility Planning<br />
50,000 3,200,000 1,500,000 500,000 500,000<br />
CBX01270 Structural (Category 4)<br />
70,000 200,000 125,000 200,000 200,000<br />
CBX01101 Three Harbour Fire Station<br />
1,000,000<br />
Total<br />
Buildings<br />
54,896,333 39,659,000 35,038,000 14,550,000 16,050,000<br />
Q6
<strong>Halifax</strong> <strong>Regional</strong> Muncipality<br />
Proposed Projects - Alphabetical Listing<br />
Business Tools<br />
Project Number Project Name<br />
2010 2011 2012 2013 2014<br />
CID00631 Asset Management<br />
425,000 600,000 350,000<br />
CID01292 Automatic Vehicle Location Equipment<br />
200,000<br />
CID01122 Corporate Customer Database<br />
60,000 102,000<br />
CID00710 Corporate Document/Record Management<br />
200,000 212,500 250,000 250,000<br />
CIO00261 Desktop Software Upgrade<br />
230,000 230,000 230,000<br />
CID00748 Fibre Optics Network<br />
300,000<br />
CID09995 Future Business Tools<br />
270,000 750,000 1,350,000<br />
CIR00256 GIS Infrastructure Upgrade<br />
100,000 150,000 150,000<br />
CIR00256 GIS Infrastructure Upgrade<br />
125,000 150,000<br />
CBU01202 HRM Security Management-Security Cards<br />
165,000<br />
CID00630 InfoTech Infrastructure Recapitalization<br />
387,000 500,000 500,000 500,000<br />
CBM00986 Non Inventoried Asset Management<br />
200,000 331,500<br />
CIN00200 SAPHR Project<br />
300,000 200,000<br />
CID01293 Streets and Services Permits<br />
150,000<br />
CID09996 Trunk Mobile Radios - TMR<br />
4,500,000<br />
Total<br />
Business Tools<br />
1,705,000 6,713,000 2,000,000 2,000,000 2,000,000<br />
Q7
<strong>Halifax</strong> <strong>Regional</strong> Muncipality<br />
Proposed Projects - Alphabetical Listing<br />
Community & Property Development<br />
Project Number Project Name<br />
2010 2011 2012 2013 2014<br />
CDV00738 Center plans/Design (Visioning)<br />
115,000 200,000 300,000 300,000<br />
CDG01136 Civic Events and Infrastructure<br />
50,000 50,000 50,000 50,000 50,000<br />
CDG00498 Cogswell Design and Administration<br />
100,000<br />
CDG00509 Cultural Facilities<br />
50,000 50,000 50,000 50,000 50,000<br />
CDX01182 Downtown Streetscapes<br />
1,000,000 7,500,000 3,600,000 2,100,000<br />
CDG01135 HRM Public Art<br />
250,000 200,000 200,000 200,000 200,000<br />
CDG00487 Monuments and Commemoration<br />
100,000 100,000 100,000 100,000 100,000<br />
CDG01283 <strong>Regional</strong> Plan 5 year review<br />
400,000 150,000<br />
CDG00493 Shubenacadie Canal Comm/Canal Greenway<br />
584,000 500,000 420,000<br />
CDG00302 Special Places and People<br />
150,000 50,000 50,000 50,000 50,000<br />
CDV00734 Streetscaping in center hubs/corridors<br />
483,000 1,000,000 1,000,000 1,000,000 1,000,000<br />
CDV00721 Watershed Environmental Studies<br />
125,000 400,000 250,000 250,000 250,000<br />
Total<br />
Community & Property Development<br />
2,892,000 10,365,000 6,070,000 4,100,000 2,000,000<br />
Q8
<strong>Halifax</strong> <strong>Regional</strong> Muncipality<br />
Proposed Projects - Alphabetical Listing<br />
District Activity Funds<br />
Project Number Project Name<br />
2010 2011 2012 2013 2014<br />
CCV01301 District 1 Capital Funds<br />
65,000 65,000 65,000 65,000 65,000<br />
CCV01310 District 10 Capital Funds<br />
65,000 65,000 65,000 65,000 65,000<br />
CCV01311 District 11 Capital Funds<br />
65,000 65,000 65,000 65,000 65,000<br />
CCV01312 District 12 Capital Funds<br />
65,000 65,000 65,000 65,000 65,000<br />
CCV01313 District 13 Capital Funds<br />
65,000 65,000 65,000 65,000 65,000<br />
CCV01314 District 14 Capital Funds<br />
65,000 65,000 65,000 65,000 65,000<br />
CCV01315 District 15 Capital Funds<br />
65,000 65,000 65,000 65,000 65,000<br />
CCV01316 District 16 Capital Funds<br />
65,000 65,000 65,000 65,000 65,000<br />
CCV01317 District 17 Capital Funds<br />
65,000 65,000 65,000 65,000 65,000<br />
CCV01318 District 18 Capital Funds<br />
65,000 65,000 65,000 65,000 65,000<br />
CCV01319 District 19 Capital Funds<br />
65,000 65,000 65,000 65,000 65,000<br />
CCV01302 District 2 Capital Funds<br />
65,000 65,000 65,000 65,000 65,000<br />
CCV01320 District 20 Capital Funds<br />
65,000 65,000 65,000 65,000 65,000<br />
CCV01321 District 21 Capital Funds<br />
65,000 65,000 65,000 65,000 65,000<br />
CCV01322 District 22 Capital Funds<br />
65,000 65,000 65,000 65,000 65,000<br />
CCV01323 District 23 Capital Funds<br />
65,000 65,000 65,000 65,000 65,000<br />
CCV01303 District 3 Capital Funds<br />
65,000 65,000 65,000 65,000 65,000<br />
CCV01304 District 4 Capital Funds<br />
65,000 65,000 65,000 65,000 65,000<br />
CCV01305 District 5 Capital Funds<br />
65,000 65,000 65,000 65,000 65,000<br />
CCV01306 District 6 Capital Funds<br />
65,000 65,000 65,000 65,000 65,000<br />
CCV01307 District 7 Capital Funds<br />
65,000 65,000 65,000 65,000 65,000<br />
CCV01308 District 8 Capital Funds<br />
65,000 65,000 65,000 65,000 65,000<br />
CCV01309 District 9 Capital Funds<br />
65,000 65,000 65,000 65,000 65,000<br />
Total<br />
District Activity Funds<br />
1,495,000 1,495,000 1,495,000 1,495,000 1,495,000<br />
Q9
<strong>Halifax</strong> <strong>Regional</strong> Muncipality<br />
Proposed Projects - Alphabetical Listing<br />
Equipment & Fleet<br />
Project Number Project Name<br />
2010 2011 2012 2013 2014<br />
CTI00695 Emission Reduction - Public Transit Buses<br />
36,000 50,000<br />
CVJ01222 EMO Emergency Situational Trailer<br />
450,000<br />
CVJ01088 Fire Apparatus Replacement<br />
1,922,200 2,360,000 4,000,000 3,378,000 3,200,000<br />
CHJ01221 Fire Services Water Supply<br />
400,000 400,000 400,000 400,000<br />
CVJ01089 Fire Utility Replacement<br />
500,000 300,000 300,000 300,000 300,000<br />
CVD01087 Fleet Vehicle Replacement<br />
1,310,000 2,200,000 4,000,000 3,378,000 3,000,000<br />
CVK01206 Identification Unit - Police Services<br />
100,000<br />
CEJ01220 Opticom Signalization System<br />
80,000 80,000 80,000 80,000 80,000<br />
CVK01090 Police Marked Cars<br />
1,575,000 1,311,000 2,150,000 2,150,000 1,800,000<br />
CVK01205 Police Negotiations Unit<br />
125,000<br />
CVU01207 Replacement Ice Resurfacers<br />
100,000 100,000 100,000<br />
CEM01297 Salt Inventory Control<br />
50,000<br />
CEJ01227 Self Contained Breathing Apparatus Replacement<br />
2,400,000 2,400,000<br />
CHU01212 Vehicle Weigh Scales<br />
110,000<br />
CEU01298 Welding Shop - Thornhill Drive<br />
450,000<br />
Total<br />
Equipment & Fleet<br />
8,323,200 9,101,000 11,815,000 9,786,000 8,880,000<br />
Q10
<strong>Halifax</strong> <strong>Regional</strong> Muncipality<br />
Proposed Projects - Alphabetical Listing<br />
Industrial Parks<br />
Project Number Project Name<br />
2010 2011 2012 2013 2014<br />
CQ300742 Aerotech Repositioning & Dvlmnt<br />
1,000,000 2,000,000<br />
CQ300743 Bayers Lake Infill & Ragged Lk Dvlpmnt<br />
10,000,000 6,000,000 6,000,000 6,000,000<br />
CQ300741 Burnside & City of Lakes Development<br />
3,000,000 10,000,000 15,000,000 15,000,000 10,000,000<br />
CQ300746 Development Consulting<br />
50,000 50,000 50,000 50,000 50,000<br />
CQU01291 North Dartmouth Trunk Sewer<br />
4,000,000<br />
CQ300745 Park sign renewal & Maintenance<br />
50,000 50,000 50,000 50,000 50,000<br />
CQ300748 Washmill Lake Court/102 Underpass/Regency Park Dr<br />
8,500,000<br />
Total<br />
Industrial Parks<br />
15,600,000 21,100,000 21,100,000 23,100,000 16,100,000<br />
Q11
<strong>Halifax</strong> <strong>Regional</strong> Muncipality<br />
Proposed Projects - Alphabetical Listing<br />
Metro Transit<br />
Project Number Project Name<br />
2010 2011 2012 2013 2014<br />
CBX01155 200 Ilsley Avenue -Safety Upgrades<br />
340,000<br />
CVD00429 Access-A-Bus Expansion<br />
550,000 900,000 900,000 900,000<br />
CVD00430 Access-A-Bus Replacement<br />
70,000 543,000 797,000 520,000 450,000<br />
CVD00436 Biennial Ferry Refit<br />
580,000 500,000 520,000 520,000 520,000<br />
CBT00432 Bus Stop Accessibility<br />
0 125,000 125,000 125,000 125,000<br />
CVD00434 Conventional Bus Expansion<br />
7,129,000 4,000,000 8,425,000 5,075,000 4,500,000<br />
CVD00435 Conventional Bus Replacement<br />
3,200,000 3,700,000 1,350,000 2,700,000 4,500,000<br />
CBX01171 Ferry Terminal Pontoon Protection(Bndl)<br />
700,000<br />
CMX01229 FFE Ragged Lake Transit Facility<br />
600,000<br />
CMU00981 MetroLink<br />
1,479,300 8,400,000<br />
CVD00431 Mid Life Bus Rebuild<br />
655,000 655,000 655,000 655,000 655,000<br />
CMX01123 New Conventional Ferry<br />
2,000,000 4,500,000 4,500,000<br />
CB200427 Ragged Lake Transit Centre<br />
800,000 5,140,000<br />
CMX01104 Rural Community Transit<br />
0 2,656,000 1,450,000 4,970,000 1,500,000<br />
CMU01289 Rural Transit Plan<br />
325,000 325,000 325,000<br />
CVD00433 Service Vehicle Replacement<br />
60,000 60,000 60,000 60,000 60,000<br />
CBT00437 Shelters Replacement/Expansion<br />
105,000 105,000 105,000 105,000<br />
CBX01164 Transit Facilities Upgrades(Bundle)<br />
400,000 425,000 450,000 450,000 450,000<br />
CMU00982 Transit Security<br />
400,000 425,000 450,000 450,000 450,000<br />
CIU00875 Transit Software<br />
500,000 200,000 200,000 200,000 140,000<br />
CMU01095 Transit Strategy<br />
350,000<br />
CMU01288 Transit System Accessibility<br />
105,000<br />
CB200428 Transit Terminals Upgrade & Expansion<br />
4,805,000 3,131,000 3,688,000 1,373,000<br />
CMU01203 Vehicle Tracking & Communication Equipment Replacement<br />
65,000 60,000 60,000 60,000<br />
Total<br />
Metro Transit<br />
23,638,300 27,519,000 23,503,000 21,953,000 20,028,000<br />
Q12
<strong>Halifax</strong> <strong>Regional</strong> Muncipality<br />
Proposed Projects - Alphabetical Listing<br />
Parks and Playgrounds<br />
Project Number Project Name<br />
2010 2011 2012 2013 2014<br />
CPX01061 Artificial Fields<br />
100,000 1,400,000 600,000 600,000<br />
CPX01179 Athletic Field/Park Equip (Bundle)<br />
50,000 85,000 85,000 85,000 85,000<br />
CPX01180 Ball Field Upgrades (Bundle)<br />
70,000 178,000 250,000 200,000 250,000<br />
CPX01181 Cemetery Upgrades (Bulk)<br />
30,000 50,000 50,000 50,000 50,000<br />
CPX01276 Chester Spur Line - ISF<br />
1,000,000<br />
CPX01183 Horticultural Renovations<br />
30,000 50,000 50,000 50,000 50,000<br />
CDX01214 Indoor Soccer/Field Sport Facility<br />
1,900,000<br />
CPX01184 Lawn Bowling Facilities (Bundle)<br />
20,000 50,000 50,000 50,000<br />
CPX01015 Mainland Common Development<br />
100,000 100,000 50,000<br />
CPX01185 New Parks & Playgrounds (Bundle)<br />
325,000 300,000 215,000 400,000 450,000<br />
CPX01186 New Sports Court Developmnt(Bundle)<br />
100,000 100,000 100,000 100,000<br />
CPX01188 New Street Trees Program (Bundle)<br />
125,000 225,000 250,000 250,000 275,000<br />
CPX01189 Outdoor/SprayPools&Fountains(Bndle)<br />
480,000 50,000 50,000 50,000 75,000<br />
CPX01149 Park Land Acquisition<br />
440,000 500,000 500,000 500,000 500,000<br />
CPX01190 Parks Upgrades (Bundle)<br />
259,000 475,000 500,000 515,000 565,000<br />
CPX01191 Pathways-Park, Hrm Wide (Bundle)<br />
50,000 135,000 125,000 125,000 150,000<br />
CPX01192 Playgrnd Upgrds&Replacemnts(Bundle)<br />
485,000 400,000 400,000 400,000 450,000<br />
CPU00930 Point Pleasant Park Upgrades<br />
1,333,333 300,000 400,000 400,000 475,000<br />
CPX01278 Portland Hills Trail - RInC<br />
600,000<br />
CPX01193 Public Gardens Upgrades<br />
900,000 100,000 100,000 100,000 150,000<br />
CPX01194 <strong>Regional</strong> Park Washroom Facility's(Bundle)<br />
250,000 200,000 200,000 200,000<br />
CPX01133 <strong>Regional</strong> Trails Acquisition<br />
200,000<br />
CPX01196 <strong>Regional</strong> Trails Active Transportation<br />
0 822,000 850,000 850,000 850,000<br />
CDG00983 <strong>Regional</strong> Trails: Maintenance<br />
70,000 100,000 100,000 100,000 125,000<br />
CDG00984 <strong>Regional</strong> Trails-Active Transport-Gas Tax<br />
200,000<br />
CPX01198 Skateboarding/Bike Facilities (Bundle)<br />
100,000 100,000 100,000 100,000<br />
CPX01199 Sports Court Upgrades (Bundle)<br />
500,000 300,000 300,000 400,000 450,000<br />
CPX01200 Sports Field Upgrades (Bundle)<br />
50,000 175,000 200,000 200,000 250,000<br />
CPX01201 Street Tree Replacement Program<br />
125,000 185,000 175,000 175,000 200,000<br />
CPX01178 Track and Field Upgrades (Bundle)<br />
25,000 550,000 50,000 550,000 50,000<br />
Total<br />
Parks and Playgrounds<br />
9,497,333 5,600,000 6,400,000 6,500,000 6,500,000<br />
Q13
<strong>Halifax</strong> <strong>Regional</strong> Muncipality<br />
Proposed Projects - Alphabetical Listing<br />
Roads & Streets<br />
Project Number Project Name<br />
2010 2011 2012 2013 2014<br />
CRU01077 Bridges<br />
1,109,000 1,295,000 2,000,000 2,500,000<br />
CYU01076 Curb Renewals<br />
560,000 680,000 1,500,000 2,000,000 2,000,000<br />
CRX01279 Ernst Mill Bridge - ISF<br />
1,570,000<br />
CRU01241 Gravel Roads & Street Drainage Maintenance-Ops<br />
130,000 160,000 205,000 215,000 215,000<br />
CZU01080 New Paving Streets - Core Area<br />
1,032,000 1,275,000 1,500,000 1,500,000 1,500,000<br />
CXU00585 New Paving Subdivision St's outside core<br />
2,500,000 2,500,000 2,500,000 2,500,000 2,500,000<br />
CRU01079 Other Road Related Works<br />
600,000 2,000,000 2,000,000 2,000,000<br />
CYU01081 Paving Renewal Program<br />
3,284,000 3,753,000 4,500,000 5,500,000 6,500,000<br />
CZU01082 Resurfacing<br />
10,390,000 9,405,000 13,000,000 13,700,000 14,900,000<br />
CRU01078 Street Planer Patching-Var Locations<br />
1,050,000 1,275,000 1,500,000 1,500,000 2,000,000<br />
Total<br />
Roads & Streets<br />
20,516,000 20,757,000 28,000,000 30,915,000 34,115,000<br />
Q14
<strong>Halifax</strong> <strong>Regional</strong> Muncipality<br />
Proposed Projects - Alphabetical Listing<br />
Sidewalks, Curbs & Gutters<br />
Project Number Project Name<br />
2010 2011 2012 2013 2014<br />
CJU01083 New Sidewalks<br />
1,750,000 2,125,000 2,500,000 4,000,000 5,000,000<br />
CKU01084 Sidewalk Renewals<br />
1,495,000 1,900,000 2,275,000 3,000,000 5,000,000<br />
Total<br />
Sidewalks, Curbs & Gutters<br />
3,245,000 4,025,000 4,775,000 7,000,000 10,000,000<br />
Q15
<strong>Halifax</strong> <strong>Regional</strong> Muncipality<br />
Proposed Projects - Alphabetical Listing<br />
Solid Waste<br />
Project Number Project Name<br />
2010 2011 2012 2013 2014<br />
CWU01295 Additional Green Carts for New Residents<br />
300,000 435,000 735,000 735,000 735,000<br />
CWU01065 Burner Installation Hwy101 Lndfill<br />
30,000<br />
CWU01066 Cell 6 Construction - Otter Lake<br />
16,600,000<br />
CWU01092 Dredging of Siltation Pond 08/09<br />
180,000<br />
CWU01290 Environment Monitoring Site Work 101 Landfill<br />
338,000 813,000 139,000 450,000<br />
CWU01296 Half Closure of Cell 4B - Otter Lake<br />
2,385,000<br />
CWU01069 Half Closure of Cell 5 -Otter Lake<br />
690,700 738,500 3,155,000 3,960,000<br />
CWU01267 Otter Lake Equipment<br />
1,675,000 3,300,000 2,555,000 805,000 1,250,000<br />
CWU01294 Refuse Trailers Rural Depots<br />
263,000 336,000<br />
CWU01062 Waste Stabilization Facility Otter Lake<br />
3,235,000<br />
Total<br />
Solid Waste<br />
8,623,700 22,179,500 6,764,000 5,950,000 2,321,000<br />
Q16
<strong>Halifax</strong> <strong>Regional</strong> Muncipality<br />
Proposed Projects - Alphabetical Listing<br />
Traffic Improvements<br />
Project Number Project Name<br />
2010 2011 2012 2013 2014<br />
CTU00420 Active Transportation Plan Implementation<br />
500,000 600,000 600,000 1,000,000 1,000,000<br />
CTU00337 Controller Cabinet Replacement<br />
100,000 325,000 250,000 250,000 250,000<br />
CTR00904 Destination Signage Program<br />
165,000 110,000 110,000 110,000<br />
CTX01115 Dynamic Messaging Signs<br />
2,000,000<br />
CTU00884 Functional Transportation Plans<br />
150,000 100,000 100,000 100,000<br />
CTX01116 Herring Cove Road Widening<br />
1,800,000 400,000 1,350,000<br />
CTU01086 Intersection Improvement Program<br />
1,150,000 1,450,000 1,550,000 2,100,000 2,100,000<br />
CTU01286 Joseph Howe Drive Turn Lanes<br />
450,000<br />
CTV00725 Lacewood 4 Lane/Fairview Interchange<br />
1,200,000 2,800,000<br />
CTU00971 Larry Uteck Interchange<br />
450,000 380,000<br />
CTU00886 LED Traffic Signal Conversion Project<br />
300,000 250,000<br />
CTU01287 Margeson Drive<br />
900,000<br />
CTX01111 Margeson Drive Interchange<br />
3,200,000<br />
CTX01112 Mt. Hope Avenue Extension<br />
2,000,000<br />
CTU01284 Overhead Wiring Conversion<br />
750,000 750,000 750,000 750,000<br />
CTR00906 Pedestrian Safety & Access Program<br />
50,000 50,000 50,000 50,000 50,000<br />
CTU00897 Road Corridor Land Acquisition<br />
1,420,000 697,000 1,657,000 507,000<br />
CTU01285 Road Network Model<br />
414,000<br />
CTX01126 Road Oversizing -Bedford South CCC<br />
19,000 97,000<br />
CTU01006 Roadway Oversizing - Bedford West CCC<br />
135,000 3,250,000<br />
CRU00792 Street Lighting<br />
200,000 310,000 160,000 160,000 160,000<br />
CTR00423 Traffic Calming<br />
50,000 50,000<br />
CTU00422 Traffic Signal Compliance Program<br />
50,000 125,000 100,000 100,000 100,000<br />
CTR00530 Traffic Signal Control System Integration<br />
100,000 100,000 100,000 100,000 100,000<br />
CTU01085 Traffic Signal Installation<br />
35,000 560,000 460,000 500,000 500,000<br />
CTU00419 Traffic Signal Rehabilitation<br />
330,000 580,000 530,000 780,000 880,000<br />
CTX01127 Traffic Signals - Bedford West CCC<br />
100,000 150,000<br />
CTR00908 Transportation Demand Management Program<br />
100,000 400,000 400,000 400,000 400,000<br />
CTR00529 Various Traffic Related Studies<br />
50,000 50,000<br />
Total<br />
Traffic Improvements<br />
6,819,000 14,026,000 10,607,000 10,557,000 10,357,000<br />
Q17
Buildings<br />
<strong>Halifax</strong> <strong>Regional</strong> <strong>Municipality</strong> <strong>Operating</strong> Budget Impact of Projects<br />
<strong>Operating</strong> Cost<br />
Gross<br />
2010<br />
Revenue Net FTE:<br />
CB100091 Canada Games Centre<br />
1,400,000 1,400,000 3<br />
CB200453 Dartmouth East Community Centre<br />
100,000 100,000<br />
CB200454 Gordon R. Snow Community Centre<br />
100,000 100,000<br />
CBG00720 Prospect Community Centre<br />
168,000 168,000<br />
CBW00977 Woodlawn Public Library Expansion<br />
315,500 315,500<br />
Business Tools<br />
Total $2,083,500 $2,083,500 3<br />
CID00631 Asset Management<br />
150,000 150,000 3<br />
CID01122 Corporate Customer Database<br />
162,500 162,500 2<br />
CID00710 Corporate Document/Record Management<br />
118,000 118,000 1<br />
CIR00256 GIS Infrastructure Upgrade<br />
75,000 75,000 1<br />
CBU01202 HRM Security Management-Security Cards<br />
66,000 66,000 3<br />
CBM00986 Non Inventoried Asset Management<br />
81,000 81,000 3<br />
CIN00200 SAPHR Project<br />
150,000 150,000 9<br />
Community & Property Development<br />
Total $802,500 $802,500 22<br />
CDG01136 Civic Events and Infrastructure<br />
5,000 5,000<br />
CDX01182 Downtown Streetscapes<br />
40,000 40,000<br />
CDG01135 HRM Public Art<br />
40,000 40,000<br />
CDG00487 Monuments and Commemoration<br />
15,000 15,000<br />
CDG00493 Shubenacadie Canal Comm/Canal Greenway<br />
18,000 18,000 1<br />
CDG00302 Special Places and People<br />
5,000 5,000<br />
CDV00734 Streetscaping in center hubs/corridors<br />
30,000 30,000 1<br />
Metro Transit<br />
Total $153,000 $153,000 2<br />
CVD00429 Access-A-Bus Expansion<br />
412,100 -14,300 397,800<br />
CVD00430 Access-A-Bus Replacement<br />
7,000 7,000<br />
CVD00436 Biennial Ferry Refit<br />
6,000 6,000<br />
CVD00434 Conventional Bus Expansion<br />
1,652,100 -131,400 1,520,700<br />
CVD00435 Conventional Bus Replacement<br />
17,000 17,000<br />
CB200427 Ragged Lake Transit Centre<br />
3,044,000 3,044,000 34<br />
CMX01104 Rural Community Transit<br />
0 0 4<br />
CMU00982 Transit Security<br />
33,000 33,000<br />
CIU00875 Transit Software<br />
65,000 65,000 1<br />
CMU01288 Transit System Accessibility<br />
5,000 5,000<br />
CB200428 Transit Terminals Upgrade & Expansion<br />
318,700 318,700 1<br />
CMU01203 Vehicle Tracking & Communication Equipme<br />
6,000 6,000<br />
Parks and Playgrounds<br />
Total $5,565,900 -$145,700 $5,420,200 40<br />
CPX01180 Ball Field Upgrades (Bundle)<br />
5,000 5,000<br />
CPX01183 Horticultural Renovations<br />
3,000 3,000<br />
CPX01185 New Parks & Playgrounds (Bundle)<br />
34,000 34,000<br />
CPX01188 New Street Trees Program (Bundle)<br />
15,000 15,000<br />
CPX01194 <strong>Regional</strong> Park Washroom Facility's(Bundle)<br />
20,000 20,000<br />
CPX01196 <strong>Regional</strong> Trails Active Transportation<br />
170,000 170,000 1<br />
Sidewalks, Curbs & Gutters<br />
Total $247,000 $247,000 1<br />
CJU01083 New Sidewalks<br />
15,000 15,000<br />
Solid Waste<br />
Total $15,000 $15,000<br />
CWU01295 Additional Green Carts for New Residents<br />
50,000 50,000<br />
Traffic Improvements<br />
Total $50,000 $50,000<br />
CTU00420 Active Transportation Plan Implementation<br />
5,000 5,000<br />
CRU00792 Street Lighting<br />
3,000 3,000<br />
CTR00908 Transportation Demand Management Progra<br />
70,000 70,000 2<br />
Total $78,000 $78,000 2<br />
Total $8,994,900 -$145,700 $8,849,200 70<br />
Q18
<strong>Halifax</strong> <strong>Regional</strong> <strong>Municipality</strong><br />
APPENDIX “A”<br />
2010/11 Business Plans and Budget (Proposed) Financial Information Tables<br />
<strong>Halifax</strong> <strong>Regional</strong> <strong>Municipality</strong><br />
Proposed Business Plans and Budget 2010/11<br />
APPENDIX “A”<br />
Financial Information Tables by Business Unit<br />
Office of the Chief Administrator<br />
Summary of Budget by Division<br />
2008-2009 2009-2010 2009-2010 2010-2011 Change over<br />
Actual Budget Projections Budget Budget Var as %<br />
Gross Expenditures $10,070,060 $10,198,390 $10,329,008 $10,507,827 $309,437 3.0<br />
Gross Revenue (854,060) (287,400) (349,225) (116,400) 171,000 (59.5)<br />
Net Budget<br />
CAO Office 454,806 446,290 474,650 420,385 (25,905) (5.8)<br />
CAO Administration 4,663,910 4,814,900 5,050,400 4,959,896 144,996 3.0<br />
External & Corp. Affairs 575,469 902,800 706,833 974,807 72,007 8.0<br />
Marketing, Design, Print Servic 1,764,972 1,843,600 1,844,873 2,072,677 229,077 12.4<br />
DCAO Corporate Services & Str 1,288,266 1,419,320 1,418,947 1,465,878 46,558 3.3<br />
DCAO Operations 468,578 484,080 484,080 497,784 13,704 2.8<br />
Total $9,216,001 $9,910,990 $9,979,783 $10,391,427 $480,437 4.8
<strong>Halifax</strong> <strong>Regional</strong> <strong>Municipality</strong><br />
APPENDIX “A”<br />
2010/11 Business Plans and Budget (Proposed) Financial Information Tables<br />
Business Planning & Information Management<br />
Summary of Budget by Division<br />
2008-2009 2009-2010 2009-2010 2010-2011 Change over<br />
Actual Budget Projections Budget Budget Var as %<br />
Gross Expenditures $19,791,312 $19,449,518 $18,494,401 $19,864,695 $415,177 2.1<br />
Gross Revenues (828,002) (435,700) (710,625) (577,600) (141,900) 32.6<br />
Net Budget<br />
Commonwealth Games 19,700 0 145,000 0 0 -<br />
Director of Business Plan. & In 767,766 850,011 1,116,305 915,819 65,808 7.7<br />
Data Knowledge Management 246,970 315,175 335,110 497,141 181,966 57.7<br />
Information Resource Manageme 493,102 579,908 579,078 607,418 27,510 4.7<br />
Geographic Information Services 446,636 496,062 471,126 609,482 113,420 22.9<br />
Data Management 810,407 955,836 927,385 1,014,167 58,331 6.1<br />
Information Technology 3,584,984 2,215,663 1,258,113 2,010,283 (205,380) (9.3)<br />
Technology Intrastructure 4,159,026 4,474,100 4,344,731 4,444,168 (29,932) (0.7)<br />
Customer Care 2,518,451 2,275,525 2,332,123 2,411,745 136,220 6.0<br />
Business Solutions 1,557,672 1,860,372 1,825,377 1,906,196 45,824 2.5<br />
Project Management 915,400 1,197,121 1,052,121 1,192,048 (5,073) (0.4)<br />
Client Services 169,336 164,330 148,650 188,163 23,833 14.5<br />
Customer Service Centres 587,018 674,945 608,959 713,749 38,804 5.7<br />
Dispatch Services/Call Centre 1,800,205 1,875,738 1,860,838 1,917,299 41,561 2.2<br />
E-Access & Services 510,342 593,956 491,396 616,056 22,100 3.7<br />
Visitor Services 398,290 485,176 432,564 250,361 (234,815) (48.4)<br />
Harbour Solutions Project 819 (100) (100) (7,000) (6,900) 6,900.0<br />
Hurricane Juan (3,112) 0 0 0 0 -<br />
Total $18,963,310 $19,013,818 $17,783,776 $19,287,095 $273,277 1.4
<strong>Halifax</strong> <strong>Regional</strong> <strong>Municipality</strong><br />
APPENDIX “A”<br />
2010/11 Business Plans and Budget (Proposed) Financial Information Tables<br />
Community Development<br />
Summary of Budget by Division<br />
2008-2009 2009-2010 2009-2010 2010-2011 Change over<br />
Actual Budget Projections Budget Budget Var as %<br />
Gross Expenditures $34,683,892 $35,563,907 $34,957,095 $36,183,684 $619,777 1.7<br />
Gross Revenue (17,148,683) (15,943,917) (15,340,485) (15,865,065) 78,852 (0.5)<br />
CDBU Administration 368,652 396,590 499,050 366,297 (30,293) (7.6)<br />
Market Development 403,550 401,600 401,600 401,600 0 -<br />
Facilitie s 1,078,075 1,266,100 1,297,630 1,317,302 51,202 4.0<br />
Community Relations 2,708,003 2,946,600 2,778,069 3,071,126 124,526 4.2<br />
Development Services 2,067,695 2,276,400 2,923,562 2,936,352 659,952 29.0<br />
Planning Services 3,362,347 3,688,800 3,243,521 3,512,976 (175,824) (4.8)<br />
Recreation Services 1,475,201 1,496,000 1,394,579 1,417,395 (78,605) (5.3)<br />
Outdoor Recreation 268,419 263,500 273,828 289,104 25,604 9.7<br />
Aquatic Services 458,251 490,400 458,369 604,460 114,060 23.3<br />
Mainland South & Area 1,095,508 1,060,300 1,112,451 1,000,140 (60,160) (5.7)<br />
Mainland N & Western 1,067,575 1,023,300 1,037,741 1,083,010 59,710 5.8<br />
Bedford/Sack/Fall River 836,673 825,500 797,255 875,460 49,960 6.1<br />
Cole Hb/E Shore & Valley 1,346,888 1,384,900 1,402,946 1,454,017 69,117 5.0<br />
Peninsula 1,013,091 1,077,000 1,051,106 1,090,960 13,960 1.3<br />
Dartmouth/Eastern Passage 824,928 825,200 798,296 824,580 (620) (0.1)<br />
Arenas (27,364) (11,600) (62,393) (126,640) (115,040) 991.7<br />
Facility Scheduling 323,809 320,700 320,300 337,750 17,050 5.3<br />
Clearing Account REC 40,201 (163,800) (163,800) (185,100) (21,300) 13.0<br />
Area Services 36,916 52,500 52,500 50,670 (1,830) (3.5)<br />
Area Rate Ser vices (1,213,210) 0 0 (2,840) (2,840) ( 7,100,100.0)<br />
Total $17,535,210 $19,619,990 $19,616,610 $20,318,619 $698,629 3.6
<strong>Halifax</strong> <strong>Regional</strong> <strong>Municipality</strong><br />
APPENDIX “A”<br />
2010/11 Business Plans and Budget (Proposed) Financial Information Tables<br />
Finance<br />
Summary of Budget by Division<br />
2008-2009 2009-2010 2009-2010 2010-2011 Change over<br />
Actual Budget Projections Budget Budget Var as %<br />
Gross Expenditures $12,459,571 $12,426,630 $12,273,012 $13,038,573 $611,943 4.9<br />
Gross Revenue (8,472,915) (8,353,100) (8,486,650) (10,961,800) (2,608,700) 31.2<br />
Net Budget<br />
Administration - Finance 332,963 377,980 387,972 396,745 18,765 5.0<br />
Finance 1,242,609 1,270,500 1,266,610 1,431,222 160,722 12.7<br />
Financial Services Admin 161,623 184,390 177,500 189,925 5,535 3.0<br />
Revenue (5,080,454) (5,016,190) (5,120,118) (7,476,756) (2,460,566) 49.1<br />
Accounting 2,343,734 2,237,180 2,168,778 2,442,445 205,265 9.2<br />
Procurement 3,274,335 3,291,270 3,287,220 3,616,542 325,272 9.9<br />
Payr oll Operations 1,203,038 1,255,000 1,162,100 1,304,000 49,000 3.9<br />
Revenue Replacement Project 7,400 0 0 0 0 -<br />
PS TCA Project 160,846 188,300 171,200 172,650 (15,650) (8.3)<br />
Business Process and Quality As 340,561 285,100 285,100 0 (285,100) (100.0)<br />
Total $3,986,656 $4,073,530 $3,786,362 $2,076,773 -$1,996,757 (49.0)<br />
Fire & Emergency Services<br />
Summary of Budget by Division<br />
2008-2009 2009-2010 2009-2010 2010-2011 Change over<br />
Actual Budget Projections Budget Budget Var as %<br />
Gross Expenditures $52,633,420 $54,792,300 $54,569,448 $56,283,716 $1,491,416 2.7<br />
Gross Revenue (1,185,103) (544,500) (383,996) (653,500) (109,000) 20.0<br />
Net Budget<br />
Operations 39,957,867 42,108,900 41,744,965 43,324,560 1,215,660 2.9<br />
Operations Support 11,487,133 12,138,900 12,440,487 12,305,656 166,756 1.4<br />
Locked Cost Centres 3,316 0 0 0 0 -<br />
Total $51,448,316 $54,247,800 $54,185,452 $55,630,216 $1,382,416 2.5
<strong>Halifax</strong> <strong>Regional</strong> <strong>Municipality</strong><br />
APPENDIX “A”<br />
2010/11 Business Plans and Budget (Proposed) Financial Information Tables<br />
<strong>Halifax</strong> <strong>Regional</strong> Library<br />
Summary of Budget by Division<br />
2008-2009 2009-2010 2009-2010 2010-2011 Change over<br />
Act ual Budget Projections Budget Budget Var as %<br />
Gross Expenditures $19,271,091 $19,673,900 $19,673,900 $20,852,551 $1,178,651 6.0<br />
Gross Revenues (4,770,558) (4,525,900) (4,525,900) (5,310,801) (784,901) 17.3<br />
Net Budget<br />
Administration - Library 1,9 04,458 1,994,800 1,9 94,800 1, 864,900 (129,900) (6.5)<br />
Alderney Gate Library 1,5 58,748 1,592,100 1,5 92,100 1, 638,962 46,862 2.9<br />
Spring Garden Rd. Mem. Library 1,6 66,906 1,782,400 1,7 82,400 1, 846,122 63,722 3.6<br />
Branch Libraries 9,2 82,401 9,778,700 9,7 78,700 10,191,766 413,066 4.2<br />
Restricted Fu nds 88,021 0 0 0 0 -<br />
Net Cost $14,500,533 $15,148,000 $15,148,000 $15,541,750 $393,750 2.6<br />
Human Resources<br />
Summary of Budget by Division<br />
2008-2009 2009-2010 2009-2010 2010-2011 Change over<br />
Actual Budget Projections Budget Budget Var as %<br />
Gross Expenditures $4,260,824 $4,772,160 $4,632,123 $4,895,029 $122,869 2.6<br />
Gross Revenue (7,501) 0 (32,750) (80,000) (80,000) -<br />
Net Budget<br />
Administration 378,457 407,100 435,200 409,315 2,215 0.5<br />
Org.Develop.& Health 1,576,127 1,742,890 1,672,790 1,790,480 47,590 2.7<br />
Client Services 1,288,527 1,434,390 1,305,600 1,390,940 ( 43,450) (3.0)<br />
WCB 5,842 25,000 25,000 105,470 80,470 321.9<br />
Total Compensation 672,374 718,890 654,340 628,774 (90,116) (12.5)<br />
Labour Relations 339,497 443,890 539,193 570,050 126,160 28.4<br />
Tot al $4,260,824 $4,772,160 $4,632,123 $4,895,029 $122,869 2.6
<strong>Halifax</strong> <strong>Regional</strong> <strong>Municipality</strong><br />
APPENDIX “A”<br />
2010/11 Business Plans and Budget (Proposed) Financial Information Tables<br />
<strong>Halifax</strong> <strong>Regional</strong> <strong>Municipality</strong> Police Services<br />
Summary of Budget by Division<br />
2008-2009 2009-2010 2009-2010 2010-2011 Change over<br />
Actual Budget Projections Budget Budget Var as %<br />
Gross Expenditures $71,973,994 $74,949,140 $76,280,055 $78,173,889 $3,224,749 4.3<br />
Gross Revenue (8,361,665) (8,567,400) (9,908,989) (9,018,900) (451,500) 5.3<br />
Net Budget<br />
Executive Office 3,305,073 3,155,900 3,403,724 3,360,470 204,570 6.5<br />
Chief's Division 1,532,165 1,675,840 1,197,754 1,713,590 37,750 2.3<br />
Deputy Operational Support 353,944 451,200 439,859 455,800 4,600 1.0<br />
Support Division 2,107,198 2,256,700 2,561,359 2,108,288 (148,412) (6.6)<br />
General Administration 284,438 408,600 343,050 381,130 (27,470) (6.7)<br />
Facilitie s/B uildings 47,747 49,200 69,000 56,900 7,700 15.7<br />
Initiatives 219,381 373,900 344,270 371,563 (2,337) (0.6)<br />
Operations 632,142 806,400 795,770 805,173 (1,227) (0.2)<br />
Contr actual Services 900,273 1,117,000 1,051,200 1,157,200 40,200 3.6<br />
Community Standards 990,563 1,108,700 1,000,910 1,181,400 72,700 6.6<br />
Contracted Services 1,245,747 1,523,900 1,427,850 1,481,300 (42,600) (2.8)<br />
Community Projects & Bylaw 4,053,163 4,964,600 4,618,780 5,006,203 41,603 0.8<br />
Administration 3,183,406 3,157,500 3,475,286 3,209,164 51,664 1.6<br />
Emergency 911 Communications 5,897,892 6,613,940 6,208,037 6,810,600 196,660 3.0<br />
Dispatch 36,173 77,800 43,678 77,800 0 -<br />
Police 362,858 366,700 301,794 412,944 46,244 12.6<br />
Fire 616,200 616,200 545,400 616,200 0 -<br />
Non-Emergency 0 0 1,745 0 0 -<br />
Integrated Emergency Service 6,913,122 7,674,640 7,100,654 7,917,544 242,904 3.2<br />
Deputy Operations 1,007,900 988,100 896,539 1,053,500 65,400 6.6<br />
Criminal Investigations Divi 14,680,584 10,739,200 13,170,033 11,127,130 387,930 3.6<br />
Operations Central 9,698,840 11,216,600 10,161,439 12,688,200 1,471,600 13.1<br />
Operations East 7,336,412 9,662,800 8,655,249 10,001,300 338,500 3.5<br />
Operations West 7,078,164 8,001,600 7,779,880 8,037,500 35,900 0.4<br />
City Watch 121,608 116,760 78,387 119,800 3,040 2.6<br />
Public Safety 2,360,908 2,437,060 2,910,510 2,476,300 39,240 1.6<br />
Locked Police Services 1,448 0 0 0 0 -<br />
Total $63,612,329 $66,381,740 $66,371,066 $69,154,989 $2,773,249 4.2
<strong>Halifax</strong> <strong>Regional</strong> <strong>Municipality</strong><br />
APPENDIX “A”<br />
2010/11 Business Plans and Budget (Proposed) Financial Information Tables<br />
Infrastructure & Asset Management<br />
Summary of Budget by Division<br />
2008-2009 2009-2010 2009-2010 2010-2011 Change over<br />
Actual Budget Projections Budget Budget Var as %<br />
Gross Expenditures $7,453,651 $8,186,000 $7,791,774 $8,373,927 $187,927 2.3<br />
Gross Revenue (86,988) (70,000) (218,636) (90,800) ( 20,800) 29.7<br />
Net Budget<br />
IAM Admin 380,300 386,120 350,900 406,373 20,253 5.2<br />
Facility Development 1,433,791 1,444,100 1,426,447 1,569,279 125,179 8.7<br />
Design & Construction 3,820,611 4,036,880 3,830,711 4,158,569 121,689 3.0<br />
CCC Implementation Project 155,817 304,400 180,600 314,872 10,472 3.4<br />
Parks Planning 1,079,563 1,219,100 1,200,291 1,219,775 675 0.1<br />
Sustainable Environment 496,581 725,400 584,189 614,259 (111,141) (15.3)<br />
Total $7,366,663 $8,116,000 $7,573,138 $8,283,127 $167,127 2.1<br />
Legal Services & Risk Management<br />
Summary of Budget by Division<br />
2008-2009 2009-2010 2009-2010 2010-2011 Change over<br />
Actual Budget Projections Budget Budget Var as %<br />
Gross Expenditures $2,130,205 $2,194,390 $2,112,559 $2,228,105 $33,715 1.5<br />
Gross Revenue (108,799) (144,000) (193,500) (228,000) (84,000) 58.3<br />
Net Budget<br />
Legal Services 2,130,205 2,194,390 2,112,559 2,228,105 33,715 1.5<br />
Total $2,130,205 $2,194,390 $2,112,559 $2,228,105 $33,715 1.5
<strong>Halifax</strong> <strong>Regional</strong> <strong>Municipality</strong><br />
APPENDIX “A”<br />
2010/11 Business Plans and Budget (Proposed) Financial Information Tables<br />
Transportation & Public Works<br />
Summary of Budget by Division<br />
2008-2009 2009-2010 2009-2010 2010-2011 Change over<br />
Actual Budget Projections Budget Budget Var as %<br />
Gross Expenditures $187,783,600 $185,020,619 $188,406,554 $190,515,144 $5,494,525 3.0<br />
Gross Revenue (55,340,906) (85,991,849) (84,443,478) (93,432,658) (7,440,809) 8.7<br />
Net Budget<br />
TPW Administration 366,352 412,460 412,460 689,711 277,251 67.2<br />
New Integrated Security Manag 69,327 124,100 117,100 353,524 229,424 184.9<br />
Service Delivery & Quality Im 545,999 681,180 703,300 920,225 239,045 35.1<br />
Ops Admin 112,788 0 0 0 0 -<br />
Real Estate 540,259 405,600 (231,364) (154,848) (560,448) (138.2)<br />
Contr act Support 370,994 408,200 408,200 399,997 ( 8,203) (2.0)<br />
Operations 10,471,666 11,068,100 11,397,239 11,077,418 9,318 0.1<br />
Facilities 13,103,796 13,804,500 14,341,000 14,012,041 207,541 1.5<br />
RPAM Admin 207,986 243,800 243,800 246,835 3,035 1.2<br />
Public Relations/debt (414,430) (404,100) (434,000) (298,686) 105,414 (26.1)<br />
Transit Total 25,523,477 (1,378,097) (1,898,873) (28,787,721) (27,409,624) 1,988.9<br />
Community Transit Total 4,211 377,498 426,648 254,840 (122,658) (32.5)<br />
Access-A-Bus Total 3,183,191 3,407,699 3,170,108 2,774,190 (633,509) (18.6)<br />
Ferries Total 7,141,982 6,483,700 6,876,850 6,406,044 (77,656) (1.2)<br />
Fleet: Ilsley Site 516,227 589,400 (42,819) 18,919,029 18,329,629 3,109.9<br />
Fleet:Thornhill Site (234) 73,280 214,667 3,636,723 3,563,443 4,862.8<br />
Metro Transit Services 36,196,964 9,508,780 8,671,981 4,734,064 (4,774,716) (50.2)<br />
Transportation Ser vices 1,139,424 1,424,540 1,364,045 1,417,616 ( 6,924) (0.5)<br />
Right of Way Services 135,823 142,750 167,721 (48,420) (191,170) (133.9)<br />
Sign Shop 1,344,628 1,470,740 1,370,759 1,431,142 (39,598) (2.7)<br />
Traffic Signals & Streetlight 7,209,215 8,207,690 7,986,795 8,028,727 (178,963) (2.2)<br />
Fleet: Administration 440,206 521,420 498,321 422,985 (98,435) (18.9)<br />
Fleet: Turner Site 5,269 (900) (899) 0 900 (100.0)<br />
Fleet: Emergency (11,274) (400) 0 0 400 (100.0)<br />
Fleet: <strong>Halifax</strong> <strong>Regional</strong> Water 0 (0) (0) 0 0 (100.0)<br />
All Weather Program 95,842 122,200 68,600 80,344 (41,856) (34.3)<br />
Municipal Operations Admin 347,823 420,740 407,140 380,078 (40,662) (9.7)<br />
Municipal Operations Support 3,884,763 3,978,860 3,983,700 4,629,399 650,539 16.3<br />
Streets & Roads 6,547,162 5,889,420 6,935,153 5,963,686 74,266 1.3<br />
Ice Control ( East, West and 7,784,368 3,837,250 5,900,250 4,178,198 340,948 8.9<br />
Plowing ( East, West and Cent 6,357,261 5,446,650 7,896,650 5,222,531 (224,119) (4.1)<br />
Snow Removal ( East, West and 1,068,832 171,000 171,000 127,126 (43,874) (25.7)<br />
Sidewalk Plowing/Ice Control 4,062,968 2,726,850 2,713,850 2,469,010 (257,840) (9.5)<br />
Related Program Costs(East, W 1,178,060 263,640 263,640 250,322 (13,318) (5.1)<br />
Ice Control ( East, West and 1,330,136 0 0 0 0 -<br />
Sidewalks 2,492,918 2,629,000 2,701,700 2,562,067 (66,933) (2.5)<br />
Parks and Open Spaces 4,021,793 3,934,400 4,131,600 3,947,311 12,911 0.3<br />
Sportsfields & Playgrounds 4,447,498 4,616,300 4,154,900 4,760,893 144,593 3.1<br />
Former Solid Waste System 593,754 307,700 307,700 295,300 (12,400) (4.0)<br />
Admin WR (9,341,874) (9,241,200) (8,886,784) (9,605,707) (364,507) 3.9<br />
SW Other 16,053,597 16,308,400 17,419,000 18,332,106 2,023,706 12.4<br />
Otter Lake 19,416,238 19,965,400 19,403,358 21,000,700 1,035,300 5.2<br />
Solid Waste Services 26,721,715 27,340,300 28,243,274 30,022,399 2,682,099 9.8<br />
<strong>Regional</strong> Transportation Plann 488,970 544,000 524,100 469,391 (74,609) (13.7)<br />
Total $132,442,694 $99,028,770 $103,963,076 $97,082,486 -$1,946,284 (2.0)
Glossary<br />
Accrual Basis<br />
Amalgamation Costs<br />
Area-Rates<br />
Assessment<br />
Assessment Appeals<br />
Assessment Cap<br />
Assessment Lift<br />
Assessment Roll<br />
Assets<br />
Balance Sheet<br />
Base Budget/Base Case<br />
Base Projects<br />
Base General Tax Rate<br />
BPIM<br />
Budget Envelopes<br />
Business Occupancy Openings<br />
Accounting for expenses and revenues as they are incurred, not when<br />
funds are actually disbursed or received (see Cash Basis).<br />
The costs directly associated with the amalgamation of the former<br />
municipal units which now comprise HRM. These costs are being<br />
amortized over 10 years.<br />
Similar to Property Tax Rates, except that the tax is applied only to real<br />
property in a specified area for the purpose of funding a specific service<br />
that benefits that area only. (Compare <strong>Regional</strong> Area Rate)<br />
(see Property Assessment)<br />
The Province of Nova Scotia permits property owners to appeal the<br />
assessment figures provided in their annual Notice of Assessment.<br />
The percentage that a property assessment can rise, for taxation<br />
purposes, in any given year. Under provincial law the percentage is set<br />
at the Consumer Price Index for the previous year. Some properties,<br />
such as apartments, are ineligible.<br />
The total increase in the assessment base from one year to the next.<br />
The assessed value of all properties within the municipality as provided<br />
by the Province of Nova Scotia.<br />
The property owned by an entity.<br />
Summary of assets, liabilities, and equity. The total value of assets must<br />
equal the sum of the total liabilities and equity.<br />
The budget amounts required to provide the same level of service as was<br />
provided in the prior year.<br />
Capital projects which maintain current service levels. This normally<br />
involves replacement or recapitalization of an existing asset.<br />
The general property tax rate applicable to all taxable properties within<br />
the rural area of HRM.<br />
Business Planning and Information Management<br />
Sum of funding allocated to a business unit within which to develop a<br />
budget. <strong>Operating</strong> budget envelopes are net of (after) business unit<br />
revenues. Capital budget envelopes are net of reserves, area rates, LICs,<br />
CCC, and external cost sharing.<br />
Increases in Business Occupancy Assessment which occurs because of<br />
businesses commencing operations at a location.<br />
R1
Business Occupancy Closings<br />
Business Occupancy Taxes<br />
Business Plans<br />
Business Units<br />
Canadian Institute of Chartered<br />
Accountants (CICA)<br />
Capability Projects<br />
Capacity Gap<br />
Capital Charges, LIC<br />
Capital Commission<br />
Capital Plan<br />
Capital Cost Contribution (CCC)<br />
CD<br />
Capital Reserve Pool (Crespool)<br />
Reductions in Business Occupancy Assessment which occurs due to<br />
businesses discontinuing operations at a location.<br />
Property occupied for the purpose of carrying on a business can be levied<br />
a tax based on a percentage of the assessed value occupied. This tax is in<br />
addition to any property taxes levied.<br />
Include program objectives, outcomes desired, resources required and<br />
performance measures used to determine whether outcomes have been<br />
achieved.<br />
High level corporate divisions based on major services.<br />
The CICA is a national organization of chartered accountants which<br />
conducts research into current business issues and supports the setting of<br />
accounting and assurance standards for business, not-for-profit<br />
organizations and government. It issues guidance on control and<br />
governance, publishes professional literature, develops continuing<br />
education programs and represents the CA profession nationally and<br />
internationally.<br />
Capital projects which expand current service levels. This normally<br />
involves addition, modification or acquisition of assets.<br />
The difference between the funding required annually to recapitalize or<br />
replacing of existing assets needed to maintain current service levels, and<br />
the funding which is available on an annual basis to do so.<br />
Local Improvement Charges. Council may make by-laws imposing local<br />
charges for municipal infrastructure such as streets, curbs, gutters,<br />
sidewalks, etc.<br />
Capital Commissions are a vehicle through which governments promote<br />
and enhance the unique historical and cultural character of Capital<br />
Regions. They are usually established as an arm's-length agency and<br />
generally report to an executive-director, an appointed board of directors<br />
and are ultimately responsible to a provincial minister and cabinet.<br />
Refers to the capital projects under consideration for the next three years.<br />
While the capital plan has the same level of detail, costing and funding<br />
as the capital budget, Council can only approve the second and third<br />
years “in principle”.<br />
Funding provided by developers which is used to offset the costs<br />
stemming from new or expanded municipal infrastructure required as the<br />
result of new development.<br />
Community Development<br />
Capacity remaining, following completion of a capital project, which<br />
was funded from debt. These reserved funds may only be used to<br />
provide additional funding for capital projects which are over-budget or<br />
to new budgets. It cannot be used for new projects or to expand the<br />
R2
scope of existing projects.<br />
Capital Budget<br />
Capital District<br />
Capital from <strong>Operating</strong><br />
Capitalize<br />
Cash Basis<br />
CCC<br />
Chartered Accountants<br />
Citizen<br />
Collective Agreement<br />
Commercial Assessment<br />
Commercial Forest Taxes<br />
Commercial General Tax Rates<br />
Commercial Multiplier<br />
Committee of the Whole (COW)<br />
Consumer Price Index (CPI)<br />
The Council-approved capital expenditures for a fiscal year and the<br />
means of financing them. To qualify for inclusion in the Capital Budget,<br />
projects must have a cost of at least $50,000 and a useful life of at least<br />
one year.<br />
The regional centre for government, finance, culture, entertainment and<br />
business. It encompasses downtown <strong>Halifax</strong>, downtown Dartmouth, and<br />
the Spring Garden Road, Quinpool Road and Gottingen Street areas.<br />
Refers to capital projects which are funded directly from operating<br />
funds. For that reason it is often referred to as “pay-as-you-go” capital<br />
funding.<br />
The amortization of capital costs over a period of years, usually equal to<br />
or less than the anticipated life of the resulting capital asset or<br />
improvements to it.<br />
Accounting for expenses and revenues as the funds are actually<br />
disbursed or received.<br />
(see Capital Cost Contribution)<br />
Accountants who have obtained the CA designation through prescribed<br />
training and work experience.<br />
A person who resides in HRM.<br />
Legal agreement between an employer and a union representing a group<br />
of employees which details the terms and conditions of employment such<br />
as wages and benefits.<br />
The market value of real property (land and buildings) used for<br />
commercial purposes as assessed by the Province of Nova Scotia<br />
Assessment Services.<br />
Land used or intended to be used for forestry purposes shall pay taxes at<br />
the rate of $0.40 per acre (50,000 acres or more).<br />
The general rate of taxation applied to the market value of real property<br />
used for commercial purposes, expressed per $100 of assessed value. It<br />
is a multiple of the Residential General Tax Rate.<br />
A factor that is used to calculate commercial tax rates as a function of<br />
residential rates.<br />
When all members of <strong>Regional</strong> Council meet together as a committee,<br />
not in a session of Council. Council cannot pass resolutions when<br />
meeting as a Committee of the Whole.<br />
An indicator of changes in consumer prices experienced by Canadians. It<br />
is obtained by comparing through time, the cost of a fixed basket of<br />
R3
commodities purchased by consumers.<br />
Cost Drivers<br />
Council<br />
CPI<br />
Credit Rating<br />
Crespool<br />
Debenture<br />
Debenture Discount<br />
Debt<br />
Debt Servicing Policy<br />
Deed Transfer Tax<br />
Deficit<br />
DFA<br />
Director<br />
Education Rate<br />
EMO<br />
Cost pressures which may present challenges to business units in terms<br />
of developing more cost effective ways of providing service within<br />
budget.<br />
(see <strong>Regional</strong> Council)<br />
(see Consumer Price Index)<br />
For HRM as provided annually by the Standard and Poor’s rating<br />
agency.<br />
(see Capital Reserve Pool)<br />
A written promise to pay a specified sum of money called the face value<br />
or principal amount at a specified date or dates in future, called maturity<br />
dates, together with periodic interest at a specified rate. In Nova Scotia,<br />
debentures are provided by the Municipal Finance Corporation, a branch<br />
of the Province of Nova Scotia, to finance capital projects.<br />
When the market interest rate exceeds the stated debenture rate, the<br />
debenture sells at a discount. When the opposite is true, the debenture<br />
sells at a premium. On fixed term securities such as debentures, it is<br />
appropriate to amortize any discount or premium arising on purchase of<br />
the security over the period to maturity.<br />
The outstanding principal repayable on loans provided by the Municipal<br />
Finance Corporation.<br />
The policy which places limits on the debt which may be issued during a<br />
fiscal year.<br />
Tax levied on the transfer of real property (land and buildings), which is<br />
payable at the time of conveyance of the title, and is based on the<br />
purchase price. The rate has been set by Council as 1.5% of the purchase<br />
price.<br />
At the conclusion of the fiscal year, the amount, if any, by which the<br />
municipality’s operating expenditures exceeds its operating revenues.<br />
Disaster Financial Assistance Program. This program is administered<br />
and funded by the Federal Government, and is intended to provide<br />
financial assistance to areas to assist with recovery from a major disaster.<br />
The most senior management position within a Business Unit.<br />
As determined by the Province of Nova Scotia, the rate per $100 of<br />
assessed value which is applied to the Uniform Assessment in order to<br />
determine the Mandatory Education contribution required from each<br />
municipal government within Nova Scotia.<br />
Emergency Measures Organization<br />
R4
EMS<br />
EMT<br />
Executive Management Team<br />
Farm Acreage Taxes<br />
Fee Revenue<br />
Fire Protection Rate<br />
Fiscal Framework<br />
Environmental Management Services<br />
(see Executive Management Team)<br />
Consists of the Chief Administrative Officer and the Deputy Chief<br />
Administrative Officers.<br />
Each year the Province of Nova Scotia pays to the municipality in which<br />
farm property exempt from taxation is situated, a grant equal to $2.10 per<br />
acre in respect of the land. This rate is increased by the Consumer Price<br />
Index each year after March 31, 2001.<br />
User fees such as parking meter revenue, rentals, etc.<br />
A tax levied on assessable property in an area served by a water system<br />
to recover that part of the cost of the water system which is directly<br />
attributable to fire protection.<br />
A financial projection showing revenues, expenditures, debt and other<br />
information using a consistent set of assumptions. It is used for<br />
budgeting purposes and for longer-term projections. The framework is<br />
frequently presented to Council using a Base Case scenario. Council can<br />
then provide staff with direction regarding the assumptions that underlie<br />
the development of the proposed budget.<br />
Fiscal Year Runs from April 1 to March 31.<br />
Fiscal Services<br />
FTE<br />
GDP<br />
General Property Tax Rate<br />
Generally Accepted Accounting<br />
Principals<br />
Goal<br />
Section of the <strong>Operating</strong> Budget which includes non-departmental<br />
expenditures such as mandatory payments to the Province of Nova<br />
Scotia, most debt charges (except those related to Transit Services,<br />
Wastewater and Solid Waste), payments to reserves, Capital from<br />
<strong>Operating</strong>, Capital and <strong>Operating</strong> Grants, the surplus or deficit from the<br />
prior fiscal year, etc.<br />
Full Time Equivalent. A unit of labour equivalent to the normal hours<br />
worked by one full time employee in a year. It is used to standardise and<br />
aggregate the work of regular, part-time and seasonal workers.<br />
Gross Domestic Product, as defined by Statistics Canada, is the total<br />
value of goods and services produced.<br />
The property tax rate, expressed per $100 of taxable assessed value,<br />
which is charged to all property owners in HRM, and which includes all<br />
services with the exception of those funded from area-rates.<br />
A set of standardized accounting principals defined by the Canadian<br />
Institute of Chartered Accountants.<br />
A general statement of desired outcome to be achieved over a specified<br />
period of time. The term goal is roughly equivalent to Strategic<br />
Outcome.<br />
R5
Grants in Lieu<br />
Gross Expenditures<br />
GST<br />
Harbour Solutions Project<br />
HRM<br />
HRP<br />
Indicator<br />
Infrastructure Program<br />
Interest Revenue<br />
LIC<br />
Local Improvement Charge (LIC)<br />
Long Term Capital Plan<br />
Machinery & Equipment<br />
Assessment<br />
Mandatory Education<br />
Mandatory Provincial Costs<br />
Measure<br />
Metropolitan <strong>Regional</strong> Housing<br />
Authority<br />
The Federal and Provincial Governments, as well as their Crown<br />
Corporations, pay grants in lieu of property taxes.<br />
Gross Expenditures<br />
Goods and Services Tax. The Federal sales tax.<br />
Purpose is to improve the quality of effluent entering <strong>Halifax</strong> Harbour<br />
from the municipal sewage system.<br />
<strong>Halifax</strong> <strong>Regional</strong> <strong>Municipality</strong><br />
<strong>Halifax</strong> <strong>Regional</strong> Police Service<br />
A statistic or parameter that provides information on trends in the<br />
condition of a phenomenon and has significance extending beyond that<br />
associated with the properties of the statistic itself.<br />
The Canada - Nova Scotia Infrastructure Program<br />
Includes interest earned by investing excess cash balances, interest<br />
accrued on overdue taxes, capital charges, local improvement charges,<br />
etc.<br />
(see Local Improvement Charge)<br />
Local charges levied by Council for municipal infrastructure such as<br />
streets, curbs, gutters, sidewalks, etc that benefit a specific area.<br />
The 3 year Capital Plan which includes all project costs and funding<br />
sources. The first year is approved by Council as the Capital Budget.<br />
The second and third years are approved by Council in principal.<br />
The assessed value of machinery and equipment used for the purpose of<br />
carrying on a business can be levied a tax. This tax was phased-out after<br />
2003-04.<br />
Provincial statute requires that each municipality make a contribution to<br />
its school board. The contribution for each municipality is calculated by<br />
multiplying the Education Rate by each municipality’s portion of the<br />
Uniform Assessment. The Education Rate is set each year by the N.S.<br />
provincial government.<br />
Costs which HRM is required to fund by provincial statute. They<br />
include Mandatory Education, Correctional Services, the Metropolitan<br />
<strong>Regional</strong> Housing Authority, and the cost of the Provincial Assessment<br />
system.<br />
An indicator that provides information (either qualitative or quantitative)<br />
on the extent to which a policy, program or initiative is achieving its<br />
outcomes.<br />
Administers and manages public non-profit housing for seniors and<br />
families on low incomes within HRM. It is one of seven housing<br />
R6
authorities administered by the Province.<br />
MFC<br />
MISER<br />
Model for Integrating Service and<br />
Expenditure Rationalization<br />
Multi-Year Financial Strategy<br />
Municipal Finance Corporation<br />
MYFS<br />
Net<br />
Non Tax Revenues<br />
Nova Scotia Utility and Review<br />
Board<br />
<strong>Operating</strong> Budget<br />
Outcome<br />
Police Commission<br />
Principal<br />
(see Municipal Finance Corporation)<br />
(see Model for Integrating Service and Expenditure Rationalization)<br />
Computer model which forecasts the long term financial results and<br />
position of HRM by estimating future revenues and expenditures by<br />
means of a series of economic and demographic assumptions, cost<br />
drivers, and service drivers, and incorporating assumptions regarding tax<br />
rates, demographics, inflation, GDP and other economic and fiscal<br />
factors<br />
Involves predicting the future financial situation of HRM and developing<br />
and implementing a strategy in response. This strategy includes<br />
principles of financial management, a reserve policy, acCapital spending<br />
policy, a capital debt policy, and a business planning process.<br />
An agency of the Province of Nova Scotia which provides financing of<br />
the capital requirements of municipalities, school boards, and hospitals<br />
by issuing its securities and re-lending the funds for these purposes.<br />
(see Multi-Year Financial Strategy)<br />
Total expenditures less off-setting revenues<br />
Revenues other than tax revenue. Examples are user fees paid for<br />
services provided (such as recreation programs and transit fares) and<br />
fines.<br />
An independent quasi-judicial body which has both regulatory and<br />
adjudicative jurisdiction flowing from the Provincial Utility and Review<br />
Board Act. It reports to the legislature through the Minister of<br />
Environment and Labour.<br />
The budget which includes the everyday operating expenditures of the<br />
municipality, including debt charges, capital from operating, and reserve<br />
payments, and the main sources of financing available such as taxation<br />
revenue, grants, interest earned on investments, service charges, licenses<br />
and permits, etc. The total budgeted expenditures must equal the total<br />
budgeted revenue.<br />
The benefit or change that occurs because of a program or service.<br />
Provides civilian governance in regards to strategic policy planning and<br />
policy driven budget planning for police service delivery within the<br />
communities serviced by the <strong>Halifax</strong> <strong>Regional</strong> Police and provides an<br />
advisory role in respect of police matters within the communities<br />
serviced by the Provincial Police Service. The Commission also carries<br />
out other roles and responsibilities in accordance with the Provincial<br />
Police Act and HRM Bylaws.<br />
Portion of loan repayments which directly pays down the total amount<br />
R7
owing.<br />
Projections<br />
Property Taxes<br />
Property Tax Rate<br />
Property Assessment<br />
Province<br />
RCMP<br />
RDP<br />
Recapitalization<br />
Recreational Non-Profit Taxes<br />
<strong>Regional</strong> Area Rate<br />
<strong>Regional</strong> Council<br />
Reserves<br />
Residential General Tax Rates<br />
Residential Assessment<br />
Resource Assessment<br />
Estimate of total expenditures and revenues at the end of the fiscal year.<br />
Tax levied based on the market value of real property (land and<br />
buildings) as assessed by the Province of Nova Scotia (Service Nova<br />
Scotia and Municipal Relations). Expressed as a rate per $100 of<br />
assessed value. Residential and commercial properties may be taxed at<br />
different rates. Property tax payments are usually due twice per year.<br />
The rate of taxation on the market value of real property, expressed per<br />
$100 of assessed value.<br />
The market value of real property as determined by the Province of Nova<br />
Scotia Assessment Services.<br />
Government of the Province of Nova Scotia<br />
Royal Canadian Mounted Police, a federal policing agency.<br />
Real Domestic Product is the Gross Domestic Product adjusted for<br />
inflation.<br />
The use of funds to develop and improve existing assets which have<br />
deteriorated through the passage of time and/or a lack of maintenance.<br />
The owner of land used solely for non-profit recreational purposes pays<br />
taxes based on a rate of $5.00 per acre increased by 5% per year from<br />
1977.<br />
A tax rate applied to all areas of HRM, in both the residential and<br />
commercial sectors, to raise the funds required to cover Mandatory<br />
Provincial Costs.<br />
The governing and legislative body for the municipality, <strong>Regional</strong><br />
Council consists of the Mayor and 23 Councillors representing the 23<br />
Districts. <strong>Regional</strong> council is elected once every four years.<br />
Accounts in which funds are accumulated to provide for the timely<br />
replacement of municipal infrastructure and avoid large swings in the<br />
annual costs of services.<br />
The general rate of taxation applied to the market value of real property<br />
used as a residence, expressed per $100 of assessed value.<br />
The market value of real property (land and buildings) used for<br />
residential purposes as assessed by the Province of Nova Scotia<br />
Assessment Services.<br />
The assessed value of farm property, aquaculture property, forest<br />
property of less than 50,000 acres, land of a municipal water utility, or<br />
community fisherman’s service buildings and the land it occupies.<br />
R8
Resource Forest Taxes<br />
Resource Property Taxes<br />
Revenues<br />
Risk<br />
Rural General Tax Rate<br />
Service Nova Scotia and<br />
Municipal Relations<br />
Service Drivers<br />
Stakeholder<br />
Standard and Poor’s<br />
Strategic Initiatives<br />
Suburban General Tax Rate<br />
Supplementary Education<br />
Surplus<br />
Tabled Budget<br />
Tax Agreements<br />
Tax Payer<br />
Land used or intended to be used for forestry purposes pays taxes at the<br />
rate of $0.25 per acre (less than 50,000 acres).<br />
Taxes levied against farm property, aquaculture property, forest property<br />
of less than 50,000 acres, land of a municipal water utility, or community<br />
fisherman’s service buildings and the land it occupies.<br />
External sources of funds provided to the municipality to pay for the cost<br />
of providing services. For HRM, the main source of revenue is provided<br />
by property taxation. There are many other sources including grants,<br />
interest earned on investments, service charges, licenses and permits, etc.<br />
Something that may negatively impact HRM.<br />
(see Base General Tax Rate)<br />
A department of the Province of Nova Scotia which is the lead service<br />
delivery arm of government for programs and services to<br />
businesses, individuals and municipalities.<br />
Factors which have a tendency to increase demand for a service.<br />
Examples include population growth, new construction, new trends, etc.<br />
A person with an interest or concern in the HRM budget.<br />
Bond rating agency.<br />
Large scale initiatives which are corporate-wide in scope and which<br />
represent a major shift in the type and manner in which services are<br />
provided.<br />
The general tax rate applicable to all taxable properties within the<br />
suburban zone of HRM<br />
Supplementary Education funding, which is provided by HRM to the<br />
<strong>Halifax</strong> <strong>Regional</strong> School Board, provides funding for programs and<br />
special services which are outside the core curriculum. The Municipal<br />
Government Act requires separate area rates for Supplementary<br />
Education, one for each of the former City of <strong>Halifax</strong>, and former City of<br />
Dartmouth. HRM does have the discretion to decrease it each year by up<br />
to 10%.<br />
At the close of the fiscal year, the amount by which operating revenues<br />
exceed operating expenditures.<br />
The proposed or draft budget which is presented by staff to <strong>Regional</strong><br />
Council for review. All aspects of the budget are open for debate and<br />
change.<br />
Special property tax agreements with corporations, such as utilities,<br />
which have a large number of properties within the municipality.<br />
Citizens and businesses of HRM who pay taxes (generally through their<br />
R9
property taxes).<br />
Temporary Debt<br />
TPW<br />
Transfer - General Rate<br />
Transfer - Urban Rate<br />
Transfers from other Gov’ts<br />
Transition Expenditures<br />
TTY<br />
Uniform Assessment<br />
Urban General Tax Rate<br />
Variance<br />
Vendors<br />
Water Commission Dividend<br />
WTI<br />
Financing provided through the MFC short-term loan program for<br />
completed capital projects between debenture issues. The expectation is<br />
that the long-term financing will be acquired through the next MFC<br />
debenture issue<br />
Transportation and Public Works<br />
Transfers made from the General Rate Fund to an area rated service to<br />
compensate for revenue lost as the result of commercial properties which<br />
are exempt from the area rate.<br />
Transfers made from the General Urban Rate Fund to an area rated<br />
service to compensate for revenue lost as the result of properties which<br />
are exempt from the area rate because they are outside the rural zone.<br />
Funding received from the federal or provincial governments which may<br />
or may not be designated for a specific service or purpose (conditional vs<br />
unconditional).<br />
Expenditures incurred in order to amalgamate the City of <strong>Halifax</strong>, City<br />
of Dartmouth, Town of Bedford, County of <strong>Halifax</strong>, and the<br />
Metropolitan Authority into the <strong>Halifax</strong> <strong>Regional</strong> <strong>Municipality</strong>. These<br />
costs were amortized over 10 years.<br />
Also known as a TDD (Telecommunications Device for the Deaf). The<br />
TTY consists of a keyboard, a display screen, and a modem. The letters<br />
that the TTY user types into the machine are turned into electrical signals<br />
that can travel over regular telephone lines. When the signals reach their<br />
destination (in this case another TTY) they are converted back into<br />
letters which appear on a display screen.<br />
The total of the taxable property assessment plus the value of grants the<br />
<strong>Municipality</strong> receives from special property tax arrangements.<br />
The general tax rate applicable to all taxable properties within the urban<br />
zone of HRM.<br />
The difference between the amount budgeted for a cost centre or<br />
account, and the amount actually posted and/or committed.<br />
Business which sell their goods and services to HRM.<br />
A grant-in-lieu of property taxes paid by the <strong>Halifax</strong> <strong>Regional</strong> Water<br />
Commission to HRM equal to 10% of the Water Commission’s prior<br />
year’s <strong>Operating</strong> revenue.<br />
West Texas Intermediate. This is a benchmark used when measuring the<br />
market price per barrel of crude oil.<br />
R10