Additional Material, Journal of Imaging Science - Society for Imaging ...
Additional Material, Journal of Imaging Science - Society for Imaging ...
Additional Material, Journal of Imaging Science - Society for Imaging ...

Create successful ePaper yourself
Turn your PDF publications into a flip-book with our unique Google optimized e-Paper software.
Mourad: Improved calibration <strong>of</strong> optical characteristics <strong>of</strong> paper by an adapted paper-MTF model<br />
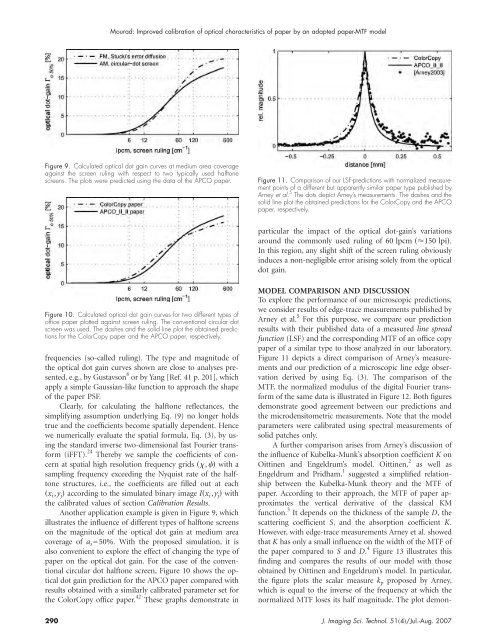
Figure 9. Calculated optical dot gain curves at medium area coverage<br />
against the screen ruling with respect to two typically used halftone<br />
screens. The plots were predicted using the data <strong>of</strong> the APCO paper.<br />
Figure 11. Comparison <strong>of</strong> our LSF-predictions with normalized measurement<br />
points <strong>of</strong> a different but apparently similar paper type published by<br />
Arney et al. 5 The dots depict Arney’s measurements. The dashes and the<br />
solid line plot the obtained predictions <strong>for</strong> the ColorCopy and the APCO<br />
paper, respectively.<br />
particular the impact <strong>of</strong> the optical dot-gain’s variations<br />
around the commonly used ruling <strong>of</strong> 60 lpcm 150 lpi.<br />
In this region, any slight shift <strong>of</strong> the screen ruling obviously<br />
induces a non-negligible error arising solely from the optical<br />
dot gain.<br />
Figure 10. Calculated optical dot gain curves <strong>for</strong> two different types <strong>of</strong><br />
<strong>of</strong>fice paper plotted against screen ruling. The conventional circular dot<br />
screen was used. The dashes and the solid line plot the obtained predictions<br />
<strong>for</strong> the ColorCopy paper and the APCO paper, respectively.<br />
frequencies (so-called ruling). The type and magnitude <strong>of</strong><br />
the optical dot gain curves shown are close to analyses presented,<br />
e.g., by Gustavson 8 or by Yang [Ref. 41 p. 201], which<br />
apply a simple Gaussian-like function to approach the shape<br />
<strong>of</strong> the paper PSF.<br />
Clearly, <strong>for</strong> calculating the halftone reflectances, the<br />
simplifying assumption underlying Eq. (9) no longer holds<br />
true and the coefficients become spatially dependent. Hence<br />
we numerically evaluate the spatial <strong>for</strong>mula, Eq. (3), by using<br />
the standard inverse two-dimensional fast Fourier trans<strong>for</strong>m<br />
(iFFT). 24 Thereby we sample the coefficients <strong>of</strong> concern<br />
at spatial high resolution frequency grids , with a<br />
sampling frequency exceeding the Nyquist rate <strong>of</strong> the halftone<br />
structures, i.e., the coefficients are filled out at each<br />
x i ,y j according to the simulated binary image Ix i ,y j with<br />
the calibrated values <strong>of</strong> section Calibration Results.<br />
Another application example is given in Figure 9, which<br />
illustrates the influence <strong>of</strong> different types <strong>of</strong> halftone screens<br />
on the magnitude <strong>of</strong> the optical dot gain at medium area<br />
coverage <strong>of</strong> a s =50%. With the proposed simulation, it is<br />
also convenient to explore the effect <strong>of</strong> changing the type <strong>of</strong><br />
paper on the optical dot gain. For the case <strong>of</strong> the conventional<br />
circular dot halftone screen, Figure 10 shows the optical<br />
dot gain prediction <strong>for</strong> the APCO paper compared with<br />
results obtained with a similarly calibrated parameter set <strong>for</strong><br />
the ColorCopy <strong>of</strong>fice paper. 42 These graphs demonstrate in<br />
MODEL COMPARISON AND DISCUSSION<br />
To explore the per<strong>for</strong>mance <strong>of</strong> our microscopic predictions,<br />
we consider results <strong>of</strong> edge-trace measurements published by<br />
Arney et al. 5 For this purpose, we compare our prediction<br />
results with their published data <strong>of</strong> a measured line spread<br />
function (LSF) and the corresponding MTF <strong>of</strong> an <strong>of</strong>fice copy<br />
paper <strong>of</strong> a similar type to those analyzed in our laboratory.<br />
Figure 11 depicts a direct comparison <strong>of</strong> Arney’s measurements<br />
and our prediction <strong>of</strong> a microscopic line edge observation<br />
derived by using Eq. (3). The comparison <strong>of</strong> the<br />
MTF, the normalized modulus <strong>of</strong> the digital Fourier trans<strong>for</strong>m<br />
<strong>of</strong> the same data is illustrated in Figure 12. Both figures<br />
demonstrate good agreement between our predictions and<br />
the microdensitometric measurements. Note that the model<br />
parameters were calibrated using spectral measurements <strong>of</strong><br />
solid patches only.<br />
A further comparison arises from Arney’s discussion <strong>of</strong><br />
the influence <strong>of</strong> Kubelka-Munk’s absorption coefficient K on<br />
Oittinen and Engeldrum’s model. Oittinen, 2 as well as<br />
Engeldrum and Pridham, 1 suggested a simplified relationship<br />
between the Kubelka-Munk theory and the MTF <strong>of</strong><br />
paper. According to their approach, the MTF <strong>of</strong> paper approximates<br />
the vertical derivative <strong>of</strong> the classical KM<br />
function. 3 It depends on the thickness <strong>of</strong> the sample D, the<br />
scattering coefficient S, and the absorption coefficient K.<br />
However, with edge-trace measurements Arney et al. showed<br />
that K has only a small influence on the width <strong>of</strong> the MTF <strong>of</strong><br />
the paper compared to S and D. 4 Figure 13 illustrates this<br />
finding and compares the results <strong>of</strong> our model with those<br />
obtained by Oittinen and Engeldrum’s model. In particular,<br />
the figure plots the scalar measure k p proposed by Arney,<br />
which is equal to the inverse <strong>of</strong> the frequency at which the<br />
normalized MTF loses its half magnitude. The plot demon-<br />
290 J. <strong>Imaging</strong> Sci. Technol. 514/Jul.-Aug. 2007