Additional Material, Journal of Imaging Science - Society for Imaging ...
Additional Material, Journal of Imaging Science - Society for Imaging ...
Additional Material, Journal of Imaging Science - Society for Imaging ...

You also want an ePaper? Increase the reach of your titles
YUMPU automatically turns print PDFs into web optimized ePapers that Google loves.
Choi et al.: Colorimetric characterization model <strong>for</strong> plasma display panel<br />
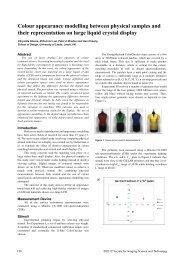
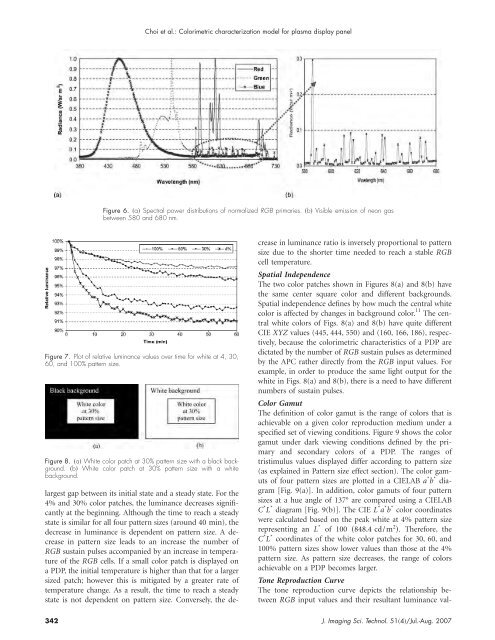
Figure 6. a Spectral power distributions <strong>of</strong> normalized RGB primaries. b Visible emission <strong>of</strong> neon gas<br />
between 580 and 680 nm.<br />
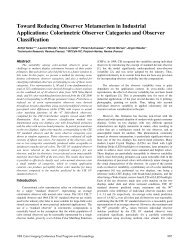
Figure 7. Plot <strong>of</strong> relative luminance values over time <strong>for</strong> white at 4, 30,<br />
60, and 100% pattern size.<br />
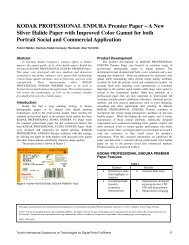
Figure 8. a White color patch at 30% pattern size with a black background.<br />
b White color patch at 30% pattern size with a white<br />
background.<br />
largest gap between its initial state and a steady state. For the<br />
4% and 30% color patches, the luminance decreases significantly<br />
at the beginning. Although the time to reach a steady<br />
state is similar <strong>for</strong> all four pattern sizes (around 40 min), the<br />
decrease in luminance is dependent on pattern size. A decrease<br />
in pattern size leads to an increase the number <strong>of</strong><br />
RGB sustain pulses accompanied by an increase in temperature<br />
<strong>of</strong> the RGB cells. If a small color patch is displayed on<br />
a PDP, the initial temperature is higher than that <strong>for</strong> a larger<br />
sized patch; however this is mitigated by a greater rate <strong>of</strong><br />
temperature change. As a result, the time to reach a steady<br />
state is not dependent on pattern size. Conversely, the decrease<br />
in luminance ratio is inversely proportional to pattern<br />
size due to the shorter time needed to reach a stable RGB<br />
cell temperature.<br />
Spatial Independence<br />
The two color patches shown in Figures 8(a) and 8(b) have<br />
the same center square color and different backgrounds.<br />
Spatial independence defines by how much the central white<br />
color is affected by changes in background color. 11 The central<br />
white colors <strong>of</strong> Figs. 8(a) and 8(b) have quite different<br />
CIE XYZ values (445, 444, 550) and (160, 166, 186), respectively,<br />
because the colorimetric characteristics <strong>of</strong> a PDP are<br />
dictated by the number <strong>of</strong> RGB sustain pulses as determined<br />
by the APC rather directly from the RGB input values. For<br />
example, in order to produce the same light output <strong>for</strong> the<br />
white in Figs. 8(a) and 8(b), there is a need to have different<br />
numbers <strong>of</strong> sustain pulses.<br />
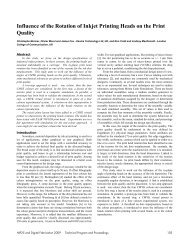
Color Gamut<br />
The definition <strong>of</strong> color gamut is the range <strong>of</strong> colors that is<br />
achievable on a given color reproduction medium under a<br />
specified set <strong>of</strong> viewing conditions. Figure 9 shows the color<br />
gamut under dark viewing conditions defined by the primary<br />
and secondary colors <strong>of</strong> a PDP. The ranges <strong>of</strong><br />
tristimulus values displayed differ according to pattern size<br />
(as explained in Pattern size effect section). The color gamuts<br />
<strong>of</strong> four pattern sizes are plotted in a CIELAB a * b * diagram<br />
[Fig. 9(a)]. In addition, color gamuts <strong>of</strong> four pattern<br />
sizes at a hue angle <strong>of</strong> 137° are compared using a CIELAB<br />
C * L * diagram [Fig. 9(b)]. The CIE L * a * b * color coordinates<br />
were calculated based on the peak white at 4% pattern size<br />
representing an L * <strong>of</strong> 100 848.4 cd/m 2 . There<strong>for</strong>e, the<br />
C * L * coordinates <strong>of</strong> the white color patches <strong>for</strong> 30, 60, and<br />
100% pattern sizes show lower values than those at the 4%<br />
pattern size. As pattern size decreases, the range <strong>of</strong> colors<br />
achievable on a PDP becomes larger.<br />
Tone Reproduction Curve<br />
The tone reproduction curve depicts the relationship between<br />
RGB input values and their resultant luminance val-<br />
342 J. <strong>Imaging</strong> Sci. Technol. 514/Jul.-Aug. 2007