Additional Material, Journal of Imaging Science - Society for Imaging ...
Additional Material, Journal of Imaging Science - Society for Imaging ...
Additional Material, Journal of Imaging Science - Society for Imaging ...

You also want an ePaper? Increase the reach of your titles
YUMPU automatically turns print PDFs into web optimized ePapers that Google loves.
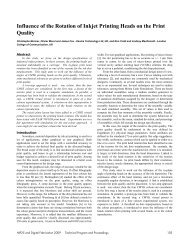
Son et al.: Real-time color matching between camera and LCD based on 16-bit lookup table design in mobile phone<br />
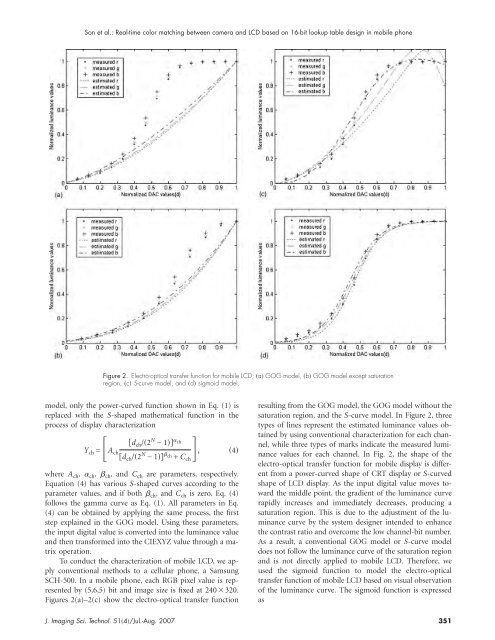
Figure 2. Electro-optical transfer function <strong>for</strong> mobile LCD; a GOG model, b GOG model except saturation<br />
region, c S-curve model, and d sigmoid model.<br />
model, only the power-curved function shown in Eq. (1) is<br />
replaced with the S-shaped mathematical function in the<br />
process <strong>of</strong> display characterization<br />
d ch /2 N −1 ch<br />
Y ch =A ch<br />
d ch /2 N −1 ch + C ch ,<br />
where A ch , ch , ch , and C ch are parameters, respectively.<br />
Equation (4) has various S-shaped curves according to the<br />
parameter values, and if both ch , and C ch is zero, Eq. (4)<br />
follows the gamma curve as Eq. (1). All parameters in Eq.<br />
(4) can be obtained by applying the same process, the first<br />
step explained in the GOG model. Using these parameters,<br />
the input digital value is converted into the luminance value<br />
and then trans<strong>for</strong>med into the CIEXYZ value through a matrix<br />
operation.<br />
To conduct the characterization <strong>of</strong> mobile LCD, we apply<br />
conventional methods to a cellular phone, a Samsung<br />
SCH-500. In a mobile phone, each RGB pixel value is represented<br />
by (5,6,5) bit and image size is fixed at 240320.<br />
Figures 2(a)–2(c) show the electro-optical transfer function<br />
4<br />
resulting from the GOG model, the GOG model without the<br />
saturation region, and the S-curve model. In Figure 2, three<br />
types <strong>of</strong> lines represent the estimated luminance values obtained<br />
by using conventional characterization <strong>for</strong> each channel,<br />
while three types <strong>of</strong> marks indicate the measured luminance<br />
values <strong>for</strong> each channel. In Fig. 2, the shape <strong>of</strong> the<br />
electro-optical transfer function <strong>for</strong> mobile display is different<br />
from a power-curved shape <strong>of</strong> CRT display or S-curved<br />
shape <strong>of</strong> LCD display. As the input digital value moves toward<br />
the middle point, the gradient <strong>of</strong> the luminance curve<br />
rapidly increases and immediately decreases, producing a<br />
saturation region. This is due to the adjustment <strong>of</strong> the luminance<br />
curve by the system designer intended to enhance<br />
the contrast ratio and overcome the low channel-bit number.<br />
As a result, a conventional GOG model or S-curve model<br />
does not follow the luminance curve <strong>of</strong> the saturation region<br />
and is not directly applied to mobile LCD. There<strong>for</strong>e, we<br />
used the sigmoid function to model the electro-optical<br />
transfer function <strong>of</strong> mobile LCD based on visual observation<br />
<strong>of</strong> the luminance curve. The sigmoid function is expressed<br />
as<br />
J. <strong>Imaging</strong> Sci. Technol. 514/Jul.-Aug. 2007 351