

Report PDF - US Environmental Protection Agency
Report PDF - US Environmental Protection Agency
Report PDF - US Environmental Protection Agency

Create successful ePaper yourself
Turn your PDF publications into a flip-book with our unique Google optimized e-Paper software.
spaces installed. Programmatic Condition 4 of the cooperative agreement states<br />
that the final project report will include a summary of the project or activity,<br />
actual results (outputs and outcomes), and costs. The condition also says the final<br />
report will include actual emissions benefit calculations.<br />
TDOT used EPA’s DERA Program Final <strong>Report</strong> Template, Part 1, December<br />
2010, to prepare the final report. The template provides a narrative discussion of<br />
actual project results and examples of how to quantify results. These results may<br />
include, but are not limited to: emission reductions, cost effectiveness, diesel fuel<br />
saved, health benefits achieved, and documented improved ambient air quality.<br />
At EPA’s request, TDOT later updated projected results in the final report using<br />
the actual spaces installed. However, TDOT’s update included the same<br />
assumptions used to calculate the initial reductions proposed for the 175-200<br />
spaces. With the requested updates, EPA accepted the final report on<br />
March 19, 2012.<br />
While EPA asked TDOT to update its assumptions based on actual units installed,<br />
EPA did not ask TDOT to update its usage assumption based on actual usage. As<br />
such, TDOT’s updated results continue to represent estimated rather than actual<br />
results. TDOT’s reporting is not consistent with the DERA program final report<br />
template that discusses actual results. Because TDOT did not consider actual<br />
usage, the projected results for the project are potentially overstated—including<br />
annual and lifetime emission reductions, capital and total project cost<br />
effectiveness, and gallons of diesel fuel saved.<br />
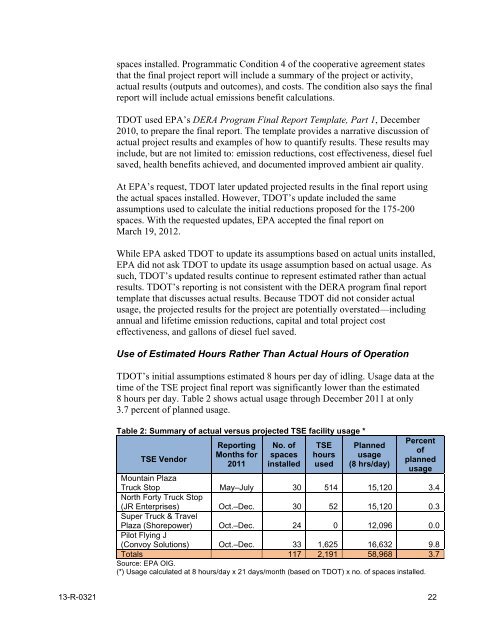
Use of Estimated Hours Rather Than Actual Hours of Operation<br />
TDOT’s initial assumptions estimated 8 hours per day of idling. Usage data at the<br />
time of the TSE project final report was significantly lower than the estimated<br />
8 hours per day. Table 2 shows actual usage through December 2011 at only<br />
3.7 percent of planned usage.<br />
Table 2: Summary of actual versus projected TSE facility usage *<br />
TSE Vendor<br />
<strong>Report</strong>ing<br />
Months for<br />
2011<br />
No. of<br />
spaces<br />
installed<br />
TSE<br />
hours<br />
used<br />
Planned<br />
usage<br />
(8 hrs/day)<br />
Percent<br />
of<br />
planned<br />
usage<br />
Mountain Plaza<br />
Truck Stop May–July 30 514 15,120 3.4<br />
North Forty Truck Stop<br />
(JR Enterprises) Oct.–Dec. 30 52 15,120 0.3<br />
Super Truck & Travel<br />
Plaza (Shorepower) Oct.–Dec. 24 0 12,096 0.0<br />
Pilot Flying J<br />
(Convoy Solutions)<br />
Totals<br />
Oct.–Dec. 33<br />
117<br />
1,625<br />
2,191<br />
16,632<br />
58,968<br />
Source: EPA OIG.<br />
(*) Usage calculated at 8 hours/day x 21 days/month (based on TDOT) x no. of spaces installed.<br />
9.8<br />
3.7<br />
13-R-0321 22


