Download (7Mb) - Iowa Publications Online - State of Iowa
Download (7Mb) - Iowa Publications Online - State of Iowa
Download (7Mb) - Iowa Publications Online - State of Iowa

You also want an ePaper? Increase the reach of your titles
YUMPU automatically turns print PDFs into web optimized ePapers that Google loves.
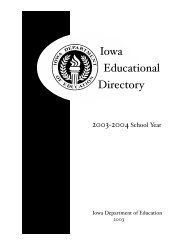
The Annual<br />
CONDITION<br />
OF EDUCATION<br />
Report<br />
2003
Grimes <strong>State</strong> Office Building in Des Moines - Home <strong>of</strong> the <strong>Iowa</strong> Department <strong>of</strong> Education<br />
Elementary/Secondary<br />
A Report on<br />
PREKINDERGARTEN, ELEMENTARY,<br />
AND SECONDARY EDUCATION<br />
in <strong>Iowa</strong><br />
<strong>Iowa</strong> Department <strong>of</strong> Education<br />
2003<br />
Printed on Recycled Paper<br />
i
<strong>State</strong> Board <strong>of</strong> Education<br />
<strong>State</strong> <strong>of</strong> <strong>Iowa</strong><br />
Department <strong>of</strong> Education<br />
Grimes <strong>State</strong> Office Building<br />
Des Moines, <strong>Iowa</strong><br />
<strong>State</strong> Board <strong>of</strong> Education<br />
Gene E. Vincent, President, Carroll<br />
Sally J. Frudden, Vice President, Charles City<br />
James Billings, West Des Moines<br />
Charles C. Edwards, Jr., Des Moines<br />
Sister Jude Fitzpatrick, Davenport<br />
Gregory D. McClain, Cedar Falls<br />
Mary Jean Montgomery, Spencer<br />
Donald L. Roby, Decorah<br />
Kay E. Wagner, Bettendorf<br />
Administration<br />
Ted Stilwill, Director and Executive Officer<br />
<strong>of</strong> the <strong>State</strong> Board <strong>of</strong> Education<br />
Gail Sullivan, Chief <strong>of</strong> Staff<br />
ii<br />
It is the policy <strong>of</strong> the <strong>Iowa</strong> Department <strong>of</strong> Education not to discriminate<br />
on the basis <strong>of</strong> race, color, national origin, gender, disability, religion,<br />
creed, age or marital status in its programs or employment practices. If you<br />
have questions or grievances related to this policy, please contact the<br />
Bureau <strong>of</strong> Administration and School Improvement Services, Grimes<br />
<strong>State</strong> Office Building, Des Moines, <strong>Iowa</strong> 50319-0146, (515) 281-5811.
PREKINDERGARTEN, ELEMENTARY, AND<br />
SECONDARY EDUCATION<br />
in <strong>Iowa</strong><br />
<strong>Iowa</strong> Department <strong>of</strong> Education<br />
Division <strong>of</strong> Financial and Information Services<br />
Leland Tack, Administrator<br />
Bureau <strong>of</strong> Planning, Research, and Evaluation<br />
Shawn Snyder, Chief<br />
Xiaoping Wang, Lead Consultant<br />
Alison Radl, Consultant<br />
Betsy Lundy, Consultant<br />
Sandra Gahn, Consultant<br />
Carla Schimelfenig, Consultant<br />
Becky Erickson, Graphic Artist<br />
The Annual Condition <strong>of</strong> Education Elementary/Secondary<br />
Report<br />
iii
To the Citizens <strong>of</strong> <strong>Iowa</strong><br />
Our 14 th Annual “Condition <strong>of</strong> Education Report” continues to<br />
provide a wide range <strong>of</strong> demographics, statistics and student<br />
achievement data to help <strong>Iowa</strong>ns better understand our educational<br />
system. It includes all the information published earlier in our “<strong>State</strong><br />
Report Card for No Child Left Behind,” as well as a wide range <strong>of</strong><br />
supplemental data.<br />
Our goal is for each “Condition <strong>of</strong> Education Report” to serve as a<br />
dependable resource for understanding pre-kindergarten, elementary,<br />
and secondary education in <strong>Iowa</strong>. It is my hope that all citizens -<br />
especially policymakers, educators and parents - find this report a<br />
tool for accountability and planning as our schools continue to strive<br />
for continuous improvement.<br />
That commitment to continuous improvement remains strong, even<br />
as you’ll note the many areas in which our schools and educators<br />
already rate above national averages - including student test scores,<br />
college preparedness, graduation rates, health and safety, and teacher<br />
quality. We have an exceptional education system in <strong>Iowa</strong>, due in<br />
large part to the dedication <strong>of</strong> communities and citizens to meeting<br />
the needs <strong>of</strong> children now and into the future.<br />
These achievements and improvements are notable in light <strong>of</strong> the<br />
serious budget challenges we have faced for the past several years.<br />
These financial constraints do in fact put at risk some <strong>of</strong> the progress<br />
we have made, particularly in the areas <strong>of</strong> reducing class sizes and<br />
supporting teachers with better salaries and pr<strong>of</strong>essional growth<br />
opportunities. Yet we remain vigilant in our efforts to identify key<br />
priorities in which to invest the public funds we depend upon, so that<br />
student achievement not only remains strong but also continues to<br />
improve. Those priorities include resources that directly benefit<br />
classroom instruction, early intervention programs targeted to young<br />
learners, and reducing achievement and skills gaps.<br />
I hope you find this report a rich resource, an accountability tool, and<br />
a source <strong>of</strong> benchmarks and indicators to help you evaluate progress.<br />
As always, I encourage your suggestions for improving this<br />
document.<br />
Ted Stilwill<br />
Director, Department <strong>of</strong> Education<br />
iv
Acknowledgments<br />
The authors <strong>of</strong> The Annual Condition <strong>of</strong> Education Report wish to thank<br />
the staff <strong>of</strong> the <strong>Iowa</strong> Department <strong>of</strong> Education who contributed to the<br />
production <strong>of</strong> this report. A special acknowledgment is extended to<br />
individuals outside the Department who made important contributions<br />
in sharing their data and thoughts with us. They included: Dr. David<br />
Frisbie, Dr. Timothy Ansley and Dr. Steve Dunbar, <strong>Iowa</strong> Testing Programs;<br />
Dr. Robert Ziomek and Mr. Dave Shawver, American College Testing<br />
Program.<br />
Acknowledgments<br />
Elementary/Secondary<br />
v
Contents<br />
BACKGROUND DEMOGRAPHICS ....................................................1-28<br />
Introduction to Background Demographics ................................................. 1<br />
Population and Demographics ................................................................2-11<br />
Population Change .............................................................................2-3<br />
<strong>Iowa</strong> Population Change ....................................................................4-5<br />
Aging ..................................................................................................... 6<br />
Birth Rates ............................................................................................. 7<br />
<strong>Iowa</strong> Births ............................................................................................ 8<br />
Households with Individuals Under Age 18 ......................................... 9<br />
<strong>Iowa</strong> Immigrants ................................................................................. 10<br />
Migration ............................................................................................. 11<br />
Economics..............................................................................................12-14<br />
<strong>Iowa</strong> Gross <strong>State</strong> Product .................................................................... 12<br />
Average Weekly Wage ....................................................................... 13<br />
Per Capita Income ............................................................................... 14<br />
Social .....................................................................................................15-28<br />
Children Poverty - <strong>State</strong>s .................................................................... 15<br />
Education and Earnings....................................................................... 16<br />
Educational Attainment ..................................................................17-21<br />
Eligible for Free or Reduced Price Meals ......................................22-24<br />
Most Livable <strong>State</strong>s ............................................................................. 25<br />
Health Insurance.................................................................................. 26<br />
Working Parents .................................................................................. 27<br />
Out-<strong>of</strong>-Wedlock Births ........................................................................ 28<br />
INTRODUCTION TO GRADES PK-12 ........................................29-30<br />
ENROLLMENT .........................................................................................31-57<br />
Enrollment Trends ...................................................................................... 31<br />
Enrollment Changes for the Nation ............................................................ 39<br />
Distribution <strong>of</strong> Public School Students and Districts ................................. 40<br />
Enrollment Distribution by Area Education Agency (AEA)...................... 45<br />
County Level Enrollments .......................................................................... 46<br />
Racial/Ethnic Distribution <strong>of</strong> Students ....................................................... 48<br />
Weighted English Language Learners and Total English Language<br />
Learners .................................................................................................. 51<br />
Weighted English Language Learners ................................................ 51<br />
Total English Language Learners ....................................................... 52<br />
Open Enrollment ........................................................................................ 54<br />
Special Education Enrollment .................................................................... 56<br />
vi
Contents<br />
STAFF ........................................................................................................59-95<br />
Teacher Characteristics .............................................................................. 59<br />
Teacher Age and Experience ...................................................................... 61<br />
Teacher Contract Days ............................................................................... 63<br />
Teacher Assignments.................................................................................. 64<br />
Beginning Full-time Public School Teachers............................................. 65<br />
Minority Teacher Characteristics ............................................................... 67<br />
Teacher Salaries ......................................................................................... 68<br />
Average Regular Salary vs. Average Total Salary ..................................... 71<br />
Teacher Salary Comparisons — Nation and Midwest <strong>State</strong>s..................... 72<br />
Teacher Salaries by Area Education Agency ............................................. 73<br />
Teacher Salary Comparisons with Other Occupational Groups ................ 75<br />
Teacher Salaries and the Consumer Price Index (CPI) .............................. 76<br />
Beginning Teacher Salary Comparisons with Midwest <strong>State</strong>s .................. 77<br />
Beginning Teacher Salaries Compared to Expected Beginning<br />
Salaries in Other Occupations ................................................................ 78<br />
Characteristics <strong>of</strong> Principals ....................................................................... 79<br />
Principal Age and Experience .................................................................... 80<br />
Principal Salaries ........................................................................................ 82<br />
` Characteristics <strong>of</strong> Superintendents ............................................................. 83<br />
Superintendent Age and Experience .......................................................... 83<br />
Superintendent Salaries .............................................................................. 85<br />
Teacher, Principal, and Superintendent Salary Comparisons .................... 86<br />
Gender Comparison .................................................................................... 88<br />
Area Education Agency Licensed Staff ..................................................... 89<br />
Instructional Aides...................................................................................... 92<br />
Pupil-Teacher Ratios .................................................................................. 93<br />
PROGRAM 2...........................................................................................97-137<br />
School District Organizational Structure ................................................... 97<br />
Curriculum and Course Enrollments .......................................................... 98<br />
Curriculum Unit Offerings ......................................................................... 99<br />
Foreign Language Enrollments ................................................................ 102<br />
Higher Level Mathematics Enrollments................................................... 103<br />
Higher Level Science Enrollments ........................................................... 104<br />
Chemistry .......................................................................................... 104<br />
Physics............................................................................................... 105<br />
Computer-Related Course Enrollments.................................................... 106<br />
Graduation Requirements for Mathematics and Science ......................... 107<br />
Class Size.................................................................................................. 109<br />
Limitations ........................................................................................ 109<br />
Findings ............................................................................................. 110<br />
Class Size Expenditures .................................................................... 124<br />
Technology ............................................................................................... 124<br />
Expenditures for Computer Hardware and S<strong>of</strong>tware ........................ 124<br />
Availability <strong>of</strong> Computers ................................................................. 127<br />
Project EASIER (Electronic Access System for <strong>Iowa</strong> Education Records) .....132<br />
Early Childhood Education ...................................................................... 135<br />
Elementary/Secondary<br />
viiContents
Contents<br />
STUDENT PERFORMANCE2.........................................................139-263<br />
<strong>State</strong> Indicators <strong>of</strong> Student Success .......................................................... 139<br />
Subgroup <strong>Iowa</strong> Student Counts for ITBS and ITED Reading and<br />
Mathematics Test-Takers; Grades 4, 8, and 11 ............................. 142<br />
Reading ............................................................................................. 144<br />
Mathematics ...................................................................................... 165<br />
Science .............................................................................................. 186<br />
Dropouts ............................................................................................ 192<br />
High School Graduation Rates .......................................................... 194<br />
Postsecondary Education/Training Intentions .................................. 196<br />
Probable Postsecondary Success ....................................................... 197<br />
<strong>Iowa</strong> Testing Programs ............................................................................. 198<br />
<strong>Iowa</strong> Tests <strong>of</strong> Basic Skills (ITBS) ..................................................... 198<br />
<strong>Iowa</strong> Tests <strong>of</strong> Educational Development (ITED) .............................. 202<br />
ITBS and ITED Student Norms ........................................................ 205<br />
ITBS and ITED Achievement Level Distributions ........................... 209<br />
Achievement Levels for Reading Comprehension ....................... 209<br />
Achievement Levels for Mathematics .......................................... 212<br />
Achievement Levels for Science................................................... 215<br />
<strong>State</strong> ITBS and ITED Participation Rates for Public and<br />
Nonpublic Students ................................................................... 216<br />
American College Testing (ACT) Assessment ........................................ 217<br />
ACT Composite Score Comparisons <strong>of</strong> <strong>Iowa</strong>, Midwest <strong>State</strong>s,<br />
and the Nation ............................................................................... 218<br />
ACT Score Comparisons for English, Mathematics, Reading, and<br />
Science Reasoning ...................................................................... 220<br />
ACT Scores for Core and Less than Core Students .......................... 223<br />
ACT Composite Score Distributions ................................................ 225<br />
ACT Scores by Enrollment Category ............................................... 226<br />
ACT Scores by Gender ..................................................................... 228<br />
ACT Composite Scores by Student Planned Educational Majors .... 229<br />
<strong>Iowa</strong> Student ACT Scores Compared to Self-Reported High<br />
School Performance ...................................................................... 231<br />
<strong>Iowa</strong> Student Satisfaction with Selected Aspects <strong>of</strong> the Local<br />
High School ................................................................................... 232<br />
Scholastic Assessment Test (SAT) ........................................................... 232<br />
Advanced Placement (AP) ....................................................................... 236<br />
National Assessment <strong>of</strong> Educational Progress (NAEP) ........................... 242<br />
Pursuit <strong>of</strong> Postsecondary Education/Training .......................................... 244<br />
Postsecondary Enrollment Options .......................................................... 247<br />
Dropouts ................................................................................................... 250<br />
High School Graduation Rates ................................................................. 256<br />
Schools in Need <strong>of</strong> Assistance ................................................................. 261<br />
Highly Qualified Teacher Comparison .................................................... 262<br />
viii
Contents<br />
FINANCE 2 ...........................................................................................265-293<br />
Function Category Expenditures .............................................................. 265<br />
Object Category Expenditures .................................................................. 266<br />
Revenues................................................................................................... 267<br />
Taxable Valuation .................................................................................... 270<br />
Expenditures Per Pupil ............................................................................. 272<br />
<strong>State</strong> Aid ................................................................................................... 274<br />
Property Taxes .......................................................................................... 276<br />
Income Surtaxes ....................................................................................... 281<br />
Instructional Support ................................................................................ 283<br />
Budget Guarantee ..................................................................................... 287<br />
Bond Elections.......................................................................................... 290<br />
Local Option Sales and Services Tax for School Infrastructure .............. 291<br />
Total Elementary and Secondary Education Budgets .............................. 292<br />
Contents<br />
Elementary/Secondary<br />
ix
BACKGROUND DEMOGRAPHICS<br />
Introduction to Background Demographics<br />
Background demographic information has been reported in The Annual Condition <strong>of</strong><br />
Education Report for seven years. Data in the demographics section review changes and<br />
trends that have occurred over time. Comparisons between <strong>Iowa</strong>, the nation, and other states<br />
are made when available. The intent <strong>of</strong> this section is to provide data regarding economic,<br />
social, population and demographic statistics that present information that help analyze the<br />
condition <strong>of</strong> education in the state.<br />
The background demographics section presents data in the following three categories:<br />
• Population and Demographics—includes information pertaining to total population,<br />
birth rates, migration, and age for the state, individual counties, surrounding states, and<br />
the nation.<br />
• Economics—includes data pertaining to wages, income, and the gross state product.<br />
• Social—includes characteristics and data on poverty levels, educational attainment and<br />
earning levels, out-<strong>of</strong>-wedlock births, and rankings <strong>of</strong> the most livable states.<br />
Data presented in the background demographics section is obtained from a variety <strong>of</strong> sources<br />
and each source is displayed. Information in this section is the most recent available at the time<br />
<strong>of</strong> publication.<br />
Background<br />
Demographics<br />
1
Population and Demographics<br />
Population Change<br />
FIGURE 1B — POPULATION CHANGE FOR MIDWEST STATES<br />
1990 TO 2000<br />
U.S. 13.2%<br />
Source:<br />
U.S. Census Bureau, Census 1990 and Census 2000, Population and Housing Unit Counts,<br />
United <strong>State</strong>s (1990 CPH-2-1). http://www.census.gov<br />
• The U.S. population increased by 13.2 percent over the last ten years, significantly<br />
higher than the 9.8 percent growth rate reported for the period from 1980<br />
to 1990.<br />
• <strong>Iowa</strong> experienced a 5.4 percent population growth rate in the past decade,<br />
outpacing the estimated rate <strong>of</strong> 3.3 percent from 1990-1999 and recovering from<br />
the loss <strong>of</strong> 4.7 percent <strong>of</strong> the population between 1980 and 1990.<br />
• The largest increases in population were in the south and west, with Nevada and<br />
Arizona growing at three times the national rate.<br />
• The midwest population grew more slowly than the nation as a whole, with<br />
North Dakota and <strong>Iowa</strong> trailing neighboring states.<br />
2
Population and Demographics<br />
Population Change<br />
FIGURE 2B — POPULATION CHANGE FOR MIDWEST STATES<br />
APRIL 1, 2000 TO JULY 1, 2002<br />
-1.3<br />
0.8<br />
1.0<br />
1.0<br />
2.0<br />
1.4<br />
0.4<br />
1.5<br />
1.4<br />
U.S. +2.5%<br />
Source:<br />
U.S. Census Bureau, Population Division, Table ST-2002-01 — <strong>State</strong> Population Estimates:<br />
April 1, 2000 to July 1, 2002, Table ST-EST2002-02 — <strong>State</strong> Population Estimates and Population<br />
Change: July 1, 2001 to July 1, 2002, and Table ST-EST2002-03 — <strong>State</strong> Population Estimates<br />
and Population Change: April 1, 2000, to July 1, 2002.<br />
• <strong>Iowa</strong>’s population increased slightly, 0.4 percent, since the 2000 Census.<br />
• One midwest state, North Dakota, experienced a population decline during the<br />
same period. North Dakota declined 1.3 percent since April 2000.<br />
• Nationally the population increased by 2.5 percent since the 2000 Census.<br />
Background<br />
Demographics<br />
3
Population and Demographics<br />
<strong>Iowa</strong> Population Change<br />
FIGURE 3B — IOWA POPULATION CHANGE BY COUNTY<br />
1990-2000<br />
Pocahontas<br />
Linn<br />
Johnson<br />
Dallas<br />
Polk<br />
Source: U.S. Census Bureau, Census 1990 and Census 2000.<br />
http://www.census.gov<br />
• <strong>Iowa</strong>’s 5.4 percent growth in population from 1990 to 2000 was concentrated in and<br />
around metropolitan areas. Almost 25 percent <strong>of</strong> the state’s population resides in just<br />
four counties: Dallas, Johnson, Linn, and Polk.<br />
• Dallas County posted the greatest gains in population, increasing by 37 percent over<br />
the last ten years. Pocahontas County experienced the largest decline, a loss <strong>of</strong> 9.1<br />
percent <strong>of</strong> its citizens during the same period.<br />
• The most populous county in the state is Polk County, which reported a growth rate<br />
<strong>of</strong> 14.5 percent in the decade <strong>of</strong> the nineties.<br />
• Twenty-two <strong>of</strong> <strong>Iowa</strong>’s 99 counties grew at or above the state rate <strong>of</strong> 5.4 percent, with<br />
nearly half <strong>of</strong> those posting double-digit increases. Forty-five counties reported<br />
declines in population since 1990.<br />
4
Population and Demographics<br />
<strong>Iowa</strong> Population Change<br />
FIGURE 4B — IOWA POPULATION CHANGE BY COUNTY<br />
2000-2002<br />
Pocahontas<br />
Benton<br />
Sac<br />
Fremont<br />
Dallas<br />
Madison<br />
Source:<br />
U.S. Census Bureau, Population Division, Table CO-EST2002-03-19 <strong>Iowa</strong> County Population<br />
Estimates and Population Change: April 1, 2000 to July 1, 2002<br />
• Dallas County showed the largest percentage increase, 8.5 percent, in population<br />
from April 1, 2000 to July 1, 2002. Dallas County experienced growth each year for<br />
the past 12 years.<br />
• Madison County was the second fastest growing county at 3.4 percent and Benton<br />
County was third at 3.1 percent.<br />
• Pocahontas County’s decline in population from April 1, 2000 to July 1, 2002 was<br />
the largest in the state at (3.8 percent). Sac County (3.7 percent) and Fremont County<br />
(3.3 percent) also experienced large declines.<br />
Background<br />
Demographics<br />
5
Population and Demographics<br />
Aging<br />
FIGURE 5B — PERCENT OF POPULATION AGE 65 AND OLDER<br />
BY MIDWEST STATES, 2002<br />
14.8<br />
12.0<br />
14.2<br />
13.4<br />
13.1<br />
13.0<br />
14.7<br />
11.9<br />
13.3<br />
Source:<br />
U.S. Census Bureau, Population Division, 7/1/2002 <strong>State</strong> Population Estimates File.<br />
• <strong>Iowa</strong> showed the second highest percentage <strong>of</strong> population 65 and older in the<br />
midwest in 2002 at 14.7 percent. In the midwest, only North Dakota (14.8<br />
percent) experienced a higher percentage <strong>of</strong> its population 65 and older.<br />
• Florida (17.1), Pennsylvania (15.5), West Virginia (15.3) and North Dakota<br />
(14.8) were the only states with a higher percent <strong>of</strong> population 65 and older than<br />
<strong>Iowa</strong>.<br />
• Alaska showed the smallest percentage <strong>of</strong> its population 65 and older at 6.1<br />
percent.<br />
6
Population and Demographics<br />
Birth Rates<br />
FIGURE 6B — BIRTHS PER THOUSAND POPULATION FOR<br />
MIDWEST STATES, 2000 AND 2001<br />
(12.2<br />
(12.2)<br />
(14.1<br />
(13.8 (12.9<br />
(14.0)<br />
(14.0) (13.1)<br />
(13.0<br />
(14.8<br />
(13.3)<br />
(14.6)<br />
(15.0<br />
(15.2)<br />
(14.5 (13.6<br />
(14.9) (13.9)<br />
U.S. 14.5 - 2001<br />
14.7 - 2000<br />
Source:<br />
Centers for Disease Control and Prevention, National Center for Health Statistics, “National Vital<br />
Statistics Reports”, Vol. 51, Number 2, 12-18-2002.<br />
• All but three midwest states (North Dakota, South Dakota and Nebraska)<br />
showed a decline in their birth rate (births per thousand population) from 2000<br />
to 2001.<br />
• <strong>Iowa</strong>’s birth rate <strong>of</strong> 13.0 was the third lowest <strong>of</strong> the midwest states for 2001 and<br />
remained below the national rate <strong>of</strong> 14.5.<br />
• Utah experienced the highest birth rate (21.8) in the nation for 2001 and<br />
Vermont the lowest (10.6).<br />
Background<br />
Demographics<br />
7
Population and Demographics<br />
<strong>Iowa</strong> Births<br />
FIGURE 7B — BIRTHS PER THOUSAND POPULATION<br />
IOWA BY COUNTY 2001<br />
Pocahontas<br />
Shelby<br />
Adams<br />
Adair<br />
Polk<br />
Source: <strong>Iowa</strong> Department <strong>of</strong> Public Health, Center for Health Statistics, “Vital Statistics <strong>of</strong> <strong>Iowa</strong> 2001”,<br />
Table 39 Live Births Ranked by County Rate Per 1,000 Population, 2001.<br />
Centers for Disease Control and Prevention, National Center for Health Statistics, “National Vital<br />
Statistics Reports”, Vol. 51, Number 2, 12-18-2002.<br />
• Polk County continued to top the state in births per thousand population in 2001<br />
with a birth rate <strong>of</strong> 16.1; this was down slightly from 16.6 in 2000.<br />
• <strong>State</strong>wide, <strong>Iowa</strong>’s birth rate dropped to 13.0 in 2001 down from 13.3 in 2000.<br />
• Counties with the lowest birth rates in the state included Adams (8.6), Shelby<br />
(8.6), Adair (8.1) and Pocahontas (7.7).<br />
8
Population and Demographics<br />
Households with Individuals Under Age 18<br />
FIGURE 8B — HOUSEHOLDS WITH INDIVIDUALS UNDER 18 YEARS OF AGE<br />
2000<br />
Dickinson<br />
Warren<br />
Source: U.S. Census Bureau, Census 2000.<br />
• Warren County had the highest percentage <strong>of</strong> households with persons under 18<br />
(39.9 percent).<br />
• Dickinson County had the lowest percentage <strong>of</strong> households with persons under<br />
18 (27.3 percent).<br />
• <strong>State</strong>wide 33.3 percent <strong>of</strong> <strong>Iowa</strong>’s households had persons under 18.<br />
• Nationally 36.0 percent <strong>of</strong> households had persons under 18.<br />
Background<br />
Demographics<br />
9
Population and Demographics<br />
<strong>Iowa</strong> Immigrants<br />
FIGURE 9B — PROPORTION OF INTERNATIONAL IMMIGRATION TO IOWA<br />
BY COUNTRY OF ORIGIN (50 OR MORE IMMIGRANTS)<br />
1996, 2000 AND 2001<br />
1,600<br />
1,400<br />
1,200<br />
1,000<br />
800<br />
600<br />
400<br />
200<br />
0<br />
1996 2000 2001<br />
Bosnia-Herzegovina<br />
Canada<br />
China, People’s Republic<br />
Germany<br />
India<br />
Korea<br />
Mexico<br />
Philippines<br />
Russia<br />
United Kingdom<br />
Vietnam<br />
Yugoslavia<br />
Other<br />
Source: U.S. Department <strong>of</strong> Homeland Security, Bureau <strong>of</strong> Citizenship and Immigration Services, “2001<br />
Statistical Yearbook <strong>of</strong> the Immigration and Naturalization Service,” “2000 Statistical Yearbook <strong>of</strong> the<br />
Immigration and Naturalization Service,” “1996 Statistical Yearbook <strong>of</strong> the Immigration and<br />
Naturalization Service.”<br />
• Immigrants to <strong>Iowa</strong> reached their highest point in the past 14 years at 5,029 for<br />
2001.<br />
• Immigrants from Bosnia-Herzegovina were 29.4 percent <strong>of</strong> all immigrants to<br />
<strong>Iowa</strong> in 2001. The number increased over 100 percent from the previous year.<br />
Only three states (Florida, Illinois and Missouri) had more immigrants from<br />
Bosnia-Herzegovina than <strong>Iowa</strong> in 2001.<br />
• The top four home countries for immigrants to the United <strong>State</strong>s in 2001 were<br />
Mexico (206,426,), India (70,290), China (56,426) and the Philippines (53,154).<br />
10
Population and Demographics<br />
Migration<br />
<strong>State</strong><br />
Montana<br />
Wyoming<br />
West V irginia<br />
North Dakota<br />
South Dakota<br />
Vermont<br />
Maine<br />
Alaska<br />
New Hampshire<br />
Delaware<br />
M ississippi<br />
Idaho<br />
R hode Island<br />
Louisiana<br />
Arkansas<br />
Nebraska<br />
Alabama<br />
Kentucky<br />
Hawaii<br />
New Mexico<br />
South Carolina<br />
<strong>Iowa</strong> 7,085<br />
Oklahoma<br />
Kansas<br />
M issouri<br />
Wisconsin<br />
Tennessee<br />
Utah<br />
Indiana<br />
Connecticut<br />
M inneso ta<br />
Nevada<br />
Ohio<br />
Oregon<br />
Pennsylvania<br />
Maryland<br />
Michigan<br />
Colorado<br />
Washington<br />
M assachusetts<br />
V irginia<br />
North C arolina<br />
Arizona<br />
Georgia<br />
New Jersey<br />
Illinois<br />
Florida<br />
New York<br />
Texas<br />
California<br />
448<br />
520<br />
718<br />
821<br />
928<br />
962<br />
1,0 01<br />
1,514<br />
2,298<br />
2,565<br />
2,576<br />
3,462<br />
3,935<br />
4,665<br />
5,339<br />
5,483<br />
5,849<br />
6,434<br />
6,513<br />
6,516<br />
8,231<br />
8,835<br />
9,200<br />
10,4 13<br />
10 ,59 2<br />
11,6 43<br />
11,6 89<br />
FIGURE 10B — ESTIMATED NET INTERNATIONAL MIGRATION<br />
2002<br />
12 ,520<br />
16 ,074<br />
16 ,270<br />
16 ,352<br />
16 ,358<br />
16 ,44 9<br />
22,501<br />
24,621<br />
25,678<br />
2 6,118<br />
30,173<br />
32,244<br />
32,551<br />
37,524<br />
39,843<br />
44,606<br />
62,813<br />
74,769<br />
Source:<br />
U.S. Census Bureau, Population Division, <strong>State</strong> Population<br />
Estimates and Estimated Components <strong>of</strong> Change,<br />
July 1, 2002.<br />
• Net international migration is the difference between immigration<br />
to an area and emigration from the same area<br />
during a time period. Immigration and emigration consist<br />
<strong>of</strong> moves where either the origin or the destination is<br />
outside <strong>of</strong> the United <strong>State</strong>s (not including Puerto Rico).<br />
Net international migration includes: (1) net foreign-born<br />
international migration, (2) net movement to/from Puerto<br />
Rico, (3) net movement <strong>of</strong> federal and civilian citizens,<br />
and (4) native-born emigration.<br />
• In 2002, all states had more immigrants entering their<br />
states than leaving but the level declined compared to<br />
2001.<br />
• California continued to top the list in net international<br />
migration in 2002 and Montana remained at the bottom <strong>of</strong><br />
the list.<br />
122 ,48 4<br />
146 ,39 2<br />
16 1,32 5<br />
326,917<br />
Background<br />
Demographics<br />
0 50,000 100,000 150,000 200,000 250,000 300,000 350,000<br />
Migration<br />
11
Economics<br />
<strong>Iowa</strong> Gross <strong>State</strong> Product<br />
FIGURE 11B — IOWA GROSS STATE PRODUCT BY INDUSTRY<br />
2000 AND 2001<br />
Percent <strong>of</strong> Total<br />
Gross <strong>State</strong> Product<br />
25.0<br />
21.9<br />
21.0<br />
Percent <strong>of</strong> Total Gross <strong>State</strong><br />
2000<br />
Product 2000<br />
Percent <strong>of</strong> Total 2001 Gross <strong>State</strong><br />
Product 2001<br />
20.0<br />
16.1 16.0<br />
17.2<br />
17.8<br />
Percent<br />
15.0<br />
10.0<br />
8.4<br />
8.4<br />
7.3<br />
6.9<br />
8.8<br />
9.0<br />
12.0<br />
12.4<br />
5.0<br />
3.9<br />
3.8<br />
4.2<br />
4.3<br />
0.0<br />
Agriculture,<br />
forest., fish<br />
0.2<br />
Mining<br />
0.2<br />
Construction<br />
Manufacturing<br />
Transportation<br />
& utilities<br />
Wholesale<br />
trade<br />
Retail trade<br />
F.I.R.E.<br />
Services<br />
Government<br />
Industry<br />
Source: U.S. Department <strong>of</strong> Commerce, Bureau <strong>of</strong> Economic Analysis, Gross <strong>State</strong> Product 2000 & 2001.<br />
Note: F.I.R.E. - Finance, Insurance and Real Estate.<br />
• <strong>Iowa</strong>’s gross state product increased 1.4 percent from 2000 to 2001.<br />
• Manufacturing continued to make up the largest share <strong>of</strong> the gross state product<br />
in 2001 but was down 4.1 percent from 2000.<br />
• Agriculture, F.I.R.E. and wholesale trade also declined from 2000 in total<br />
dollars.<br />
12
Economics<br />
Average Weekly Wage<br />
FIGURE 12B — AVERAGE WEEKLY WAGE FOR THE MIDWEST REGION<br />
2001<br />
$494<br />
$492<br />
$546<br />
$580<br />
$704<br />
$607<br />
$555<br />
$752<br />
$623<br />
Source:<br />
U.S. Department <strong>of</strong> Commerce, Bureau <strong>of</strong> Labor Statistics.<br />
• <strong>Iowa</strong>’s average weekly wage increased from $537 in 2000 to $555 in 2001, an<br />
increase <strong>of</strong> 3.4 percent.<br />
• North Dakota experienced the largest percentage increase in average weekly<br />
wage from 2000 to 2001 <strong>of</strong> 4.0 percent.<br />
• <strong>Iowa</strong> tied with Minnesota for the second highest percentage increase in the<br />
midwest in average weekly wage from 2000 to 2001.<br />
Background<br />
Demographics<br />
13
Economics<br />
Per Capita Income<br />
FIGURE 13B — PER CAPITA PERSONAL INCOME BY COUNTY<br />
2001<br />
Linn<br />
Johnson<br />
Polk<br />
Taylor<br />
Decatur<br />
Wayne<br />
Davis<br />
Van Buren<br />
Source:<br />
Note:<br />
U.S. Department <strong>of</strong> Commerce, Bureau <strong>of</strong> Economic Analysis, Regional Accounts Data,<br />
Local Area Personal Income.<br />
Per capita personal income includes wages, investment income and transfer payments.<br />
• Per capita personal income varied by county with five counties showing per<br />
capita income below $20,000, 57 counties showing per capita income between<br />
$20,000 and $24,999, and 37 counties showing per capita income greater than<br />
$25,000 in 2001.<br />
• The number <strong>of</strong> counties with per capita income below $20,000 increased to 5 in<br />
2001, up from 3 in 2000. They included: Decatur, Wayne, Davis, Van Buren,<br />
and Taylor.<br />
• The top three counties were Polk, Linn and Johnson, each over $30,000.<br />
14
Social<br />
Children Poverty - <strong>State</strong>s<br />
FIGURE 14B — CHILDREN AT OR BELOW 200 PERCENT OF POVERTY THRESHOLD<br />
MIDWEST STATES 1999-2001 (THREE YEAR AVERAGE)<br />
40.2<br />
32.3<br />
31.7<br />
34.9<br />
23.1<br />
30.3<br />
29.2<br />
32.9<br />
30.9<br />
Source:<br />
Notes:<br />
U.S. Census Bureau, Current Populations Survey, 2000, 2001 and 2002, Annual Demographics<br />
Supplements.<br />
200 percent <strong>of</strong> poverty level is double the income for a poverty threshold.<br />
The poverty threshold varies by family size. In 2001, a family <strong>of</strong> four (parents plus<br />
two children) with an income <strong>of</strong> $17,960 or lower would be in poverty.<br />
• In the midwest, Minnesota reported the lowest percentage <strong>of</strong> children at or below 200<br />
percent <strong>of</strong> the poverty level and <strong>Iowa</strong> reported the second lowest percentage.<br />
• Nationwide Maryland was the lowest with 22.8 percent <strong>of</strong> children at or below 200<br />
percent <strong>of</strong> poverty.<br />
Background<br />
Demographics<br />
15
Social<br />
Education and Earnings<br />
FIGURE 15B — UNITED STATES AVERAGE ANNUAL EARNINGS OF FULL-TIME<br />
WORKERS 25 TO 64 YEARS OLD AND BY EDUCATIONAL ATTAINMENT<br />
2001<br />
Average Annual Earnings<br />
Doctoratal Doctoral degree<br />
Pr<strong>of</strong>essional degree<br />
Master’s degree<br />
Bachelor’s degree<br />
Associate’s degree<br />
Some College<br />
HS HS Graduate, including GED<br />
Not Not High High School Graduate<br />
$41,817<br />
$40,522<br />
$34,003<br />
$26,417<br />
$60,681<br />
$74,721<br />
$94,443<br />
$114,495<br />
Source: U.S. Census Bureau, Current Population Surveys, March 2002.<br />
• Nationally workers with a pr<strong>of</strong>essional degree (M.D., J.D., D.D.S. or D.M.V.) reported<br />
the highest average annual earnings in 2001.<br />
• On average, those with a bachelor’s degree earned 78.5 percent more than workers<br />
with only a high school diploma.<br />
• Workers without a high school diploma continued to report the lowest average annual<br />
earnings.<br />
16
Social<br />
Educational Attainment<br />
TABLE 1B — EDUCATIONAL ATTAINMENT<br />
POPULATION 25 YEARS AND OLDER<br />
MIDWEST STATES 2002<br />
Completed Bachelor’s Midwest National<br />
High School Degree High School High School<br />
<strong>State</strong>/Nation or Higher or Higher Rank Rank<br />
United <strong>State</strong>s 84.1% 26.7% - -<br />
Minnesota 92.2 30.5 1 1<br />
Nebraska 89.8 27.1 2 7<br />
South Dakota 89.2 23.6 3 9<br />
North Dakota 89.0 25.3 4 10<br />
<strong>Iowa</strong> 88.3 23.1 5 12<br />
Missouri 88.1 26.7 6 13<br />
Kansas 87.5 29.1 7 18<br />
Wisconsin 86.8 24.7 8 23<br />
Illinois 85.9 27.3 9 29<br />
Source: U.S. Census Bureau, Current Population Survey March 2002.<br />
• The percentage <strong>of</strong> <strong>Iowa</strong>ns completing high school or higher education increased slightly,<br />
up from 86.1 percent in the 2000 Census to 88.3 percent in 2002.<br />
• <strong>Iowa</strong> ranked fifth in the midwest and 12 th in the nation in percent <strong>of</strong> population 25 and<br />
older completing high school.<br />
• Texas showed the lowest percentage (78.1) <strong>of</strong> its population graduating high school.<br />
Background<br />
Demographics<br />
17
Social<br />
Educational Attainment<br />
Lyon<br />
FIGURE 16B — PERCENT OF POPULATION 25 YEARS AND OLDER<br />
COMPLETING HIGH SCHOOL OR HIGHER<br />
IN IOWA BY COUNTY<br />
2000<br />
Howard<br />
Linn<br />
Crawford<br />
Story<br />
Warren<br />
Johnson<br />
Louisa<br />
Lucas<br />
Davis<br />
Source: U.S. Census Bureau, Census 2000.<br />
• In the 2000 Census, 86.1 percent <strong>of</strong> <strong>Iowa</strong>’s population reported graduating<br />
high school or higher.<br />
• Six counties (Crawford, Davis, Howard, Louisa, Lucas, and Lyon) reported<br />
less than 80.0 percent <strong>of</strong> their population graduating high school or higher.<br />
• Four counties (Johnson, Linn, Story and Warren) reported 90.0 percent or more<br />
<strong>of</strong> their population as high school graduates or higher.<br />
18
Social<br />
Educational Attainment<br />
FIGURE 17B — BACHELORS DEGREE OR HIGHER BY COUNTY<br />
POPULATION 25 YEARS AND OLDER<br />
2000<br />
Story<br />
Johnson<br />
Source: U.S. Census Bureau, Census 2000.<br />
• <strong>State</strong>wide the percentage <strong>of</strong> <strong>Iowa</strong>ns, 25 years or older, reporting a bachelors<br />
degree or higher on the Census 2000 reached 21.2 percent up from 16.9 percent<br />
in 1990.<br />
• Two counties, Story and Johnson, reported over 35.0 percent <strong>of</strong> their population<br />
with a bachelors degree or higher. Both counties are home to a Regents<br />
University.<br />
• Just over half <strong>of</strong> <strong>Iowa</strong>’s counties (51) reported less than 15.0 percent <strong>of</strong> their<br />
population, 25 years and older, with a bachelors degree.<br />
Background<br />
Demographics<br />
19
Social<br />
Educational Attainment<br />
TABLE 2B —BACHELORS DEGREE OR HIGHER<br />
BY AGE GROUP<br />
MIDWEST STATES 2000<br />
<strong>State</strong>/Nation 25+ 25-34 35-44 45-64 65+<br />
U.S. United <strong>State</strong>s 24.4% 27.5% 25.9% 26.4% 15.4%<br />
Illinois 26.1 32.3 28.2 27.3 13.4<br />
<strong>Iowa</strong> 21.2 27.8 22.7 23.1 11.5<br />
Kansas 25.8 29.8 28.3 28.3 14.9<br />
Minnesota 27.4 34.5 29.5 28.7 14.2<br />
Missouri 21.6 26.8 23.4 23.1 11.8<br />
Nebraska 23.7 29.7 25.8 26.2 11.7<br />
North Dakota 22.0 28.8 24.6 24.7 9.8<br />
South Dakota 21.5 27.4 22.8 24.2 11.2<br />
Wisconsin 22.4 27.9 23.5 24.2 12.7<br />
Source: U.S. Census Bureau, Census 2000.<br />
• Nationally 24.4 percent <strong>of</strong> the population aged 25 and older reported a bachelors<br />
degree or higher in the 2000 census.<br />
• In <strong>Iowa</strong> 21.2 percent <strong>of</strong> the population aged 25 and older reported a bachelors<br />
degree or higher.<br />
• The percentage <strong>of</strong> the population reporting a bachelors degree or higher varied by<br />
age with the 25-34 age group reporting the highest percentage for all midwest<br />
states and the nation.<br />
20
Social<br />
Educational Attainment<br />
TABLE 3B — AMOUNT OF COLLEGE<br />
25-64 YEARS OLD<br />
MIDWEST STATES 2000<br />
Some College Associate Bachelors<br />
<strong>State</strong>/Nation No Degree Degree Degree or Higher<br />
United <strong>State</strong>s 22.3% 7.2% 26.5%<br />
Illinois 22.9 7.0 29.0<br />
<strong>Iowa</strong> 23.3 9.0 24.1<br />
Kansas 25.9 6.8 28.7<br />
Minnesota 25.8 8.9 30.5<br />
Missouri 23.7 5.9 24.2<br />
Nebraska 25.9 8.9 27.0<br />
North Dakota 26.6 11.6 25.7<br />
South Dakota 24.7 8.6 24.5<br />
Wisconsin 22.3 8.9 24.9<br />
Source: U.S. Census Bureau, Census 2000.<br />
• <strong>Iowa</strong> was higher than the national average and second highest in the midwest,<br />
9.0 percent, for persons with an associates degree in the 25-64 age category.<br />
• In the midwest, <strong>Iowa</strong> showed the lowest percentage (24.1) <strong>of</strong> population with a<br />
bachelors degree or higher for the 25-64 age category.<br />
Background<br />
Demographics<br />
21
Social<br />
Eligible for Free or Reduced Price Meals<br />
TABLE 4B — PERCENT OF IOWA PUBLIC SCHOOL PK-12 STUDENTS<br />
ELIGIBLE FOR FREE OR REDUCED PRICE MEALS<br />
BY ENROLLMENT CATEGORY<br />
2001-2002 TO 2002-2003<br />
Enrollment 2001-2002 2001-2002 2002-2003 2002-2003<br />
Category Number Percent Number Percent<br />
Social<br />
Eligible for Free or Reduced Price Meals<br />
FIGURE 18B — PERCENT OF IOWA PUBLIC SCHOOL PK-12 STUDENTS<br />
ELIGIBLE FOR FREE OR REDUCED PRICE MEALS BY COUNTY<br />
2002-2003<br />
Crawford<br />
Louisa<br />
Taylor<br />
Ringgold<br />
Wapello<br />
Wayne<br />
Decatur Appanoose<br />
Source:<br />
<strong>Iowa</strong> Department <strong>of</strong> Education, Bureau <strong>of</strong> Planning, Research, and Evaluation, Basic Educational<br />
Data Survey, Free and Reduced Price Meal Eligibility File 2003.<br />
• Decatur County experienced the highest percentage (49.5) <strong>of</strong> students eligible<br />
for free or reduced price meals in 2002-2003.<br />
• Eight counties (Decatur, Wapello, Wayne, Ringgold, Crawford, Taylor, Louisa<br />
and Appanoose) reported over 40.0 percent <strong>of</strong> their students eligible for free or<br />
reduced price meals in 2002-2003 up from four counties in 2001-2002.<br />
Background<br />
Demographics<br />
23
Social<br />
Eligible for Free or Reduced Price Meals<br />
FIGURE 19B — PERCENT OF IOWA PUBLIC SCHOOL PK-12 STUDENTS<br />
ELIGIBLE FOR FREE OR REDUCED PRICE MEALS<br />
1992-1993 TO 2002-2003<br />
Percent Free and Reduced<br />
30<br />
20<br />
10<br />
0<br />
24.8 25.4 25.9 26.0 26.8 27.6 27.5<br />
1992-<br />
1993<br />
1993-<br />
1994<br />
1994-<br />
1995<br />
1995-<br />
1996<br />
1996-<br />
1997<br />
1997-<br />
1998<br />
1998-<br />
1999<br />
26.3 26.7 26.7<br />
1999-<br />
2000<br />
2000-<br />
2001<br />
2001-<br />
2002<br />
28.5<br />
2002-<br />
2003<br />
Year<br />
Source:<br />
<strong>Iowa</strong> Department <strong>of</strong> Education, Bureau <strong>of</strong> Planning, Research, and Evaluation, Basic Educational<br />
Data Survey, Free and Reduced Price Meal Eligibility Files.<br />
• The statewide percentage <strong>of</strong> students eligible for free or reduced priced meals<br />
reached a new 13 year high <strong>of</strong> 28.5 percent in the 2002-2003 school year.<br />
• The individual district percentages ranged from a low <strong>of</strong> 4.8 percent to a high <strong>of</strong><br />
71.2 percent in 2002-2003.<br />
24
Social<br />
Most Livable <strong>State</strong>s<br />
TABLE 5B —TEN MOST LIVABLE STATES<br />
2002 AND 2003<br />
National Rank National Rank<br />
<strong>State</strong> <strong>State</strong> 2002 2002 Rank 2003 2003 Rank<br />
Minnesota 1 1<br />
<strong>Iowa</strong> 2 2<br />
New Hampshire 3 3<br />
Nebraska 6 4<br />
Virginia 4 5<br />
Kansas 13 6<br />
Vermont 18 7<br />
South Dakota 13 8<br />
Massachusetts 5 9<br />
Wisconsin 11 10<br />
Source: Morgan Quinto Press, <strong>State</strong> Rankings 2003.<br />
Note: Based on averaged rankings <strong>of</strong> the following 43 categories:<br />
1. Percent change in number <strong>of</strong> crimes (2000 to 2001); 2. Crime rate; 3. <strong>State</strong> prisoner<br />
incarceration rate; 4. <strong>State</strong> cost <strong>of</strong> living index; 5. Pupil-teacher ratio in public elementary<br />
and secondary schools; 6. Unemployment rate; 7. Percent <strong>of</strong> non-farm employees in<br />
government; 8. Electricity prices; 9. Hazardous waste sites on the national priority list per<br />
10,000 square miles; 10. <strong>State</strong> and local taxes as a percent <strong>of</strong> personal income;<br />
11. Per capita state and local government debt outstanding; 12. Percent <strong>of</strong> population<br />
not covered by health insurance; 13. Births <strong>of</strong> low birthweight as a percent <strong>of</strong> all births;<br />
14. Teenage birth rate; 15. Infant mortality rate; 16. Age-adjusted death rate by suicide;<br />
17. Populations per square mile; 18. Divorce rate; 19. Poverty rate; 20. <strong>State</strong> and local<br />
government spending for welfare programs as a percent <strong>of</strong> all spending; 21. Percent<br />
<strong>of</strong> households receiving food stamps; 22. Deficient bridges as a percent <strong>of</strong> total bridges;<br />
23. Highway fatality rate; 24. Fatalities in alcohol-related crashes as a percent <strong>of</strong> all<br />
highway fatalities; 25. Per capita gross state product; 26. Percent change in per capita<br />
gross state product: 1996 to 2000 (adjusted in constant 1996 dollars); 27. Per capita<br />
personal income; 28. Change in per capita personal income: 2000 to 2001; 29. Median<br />
household income; 30. Public high school graduation rate; 31. Percent <strong>of</strong> population<br />
graduated from high school; 32. Expenditures for education as a percent <strong>of</strong> all state and local<br />
government expenditures; 33. Percent <strong>of</strong> population with a bachelors degree or more;<br />
34. Books in public libraries per capita; 35. Per capita state art agencies’ legislative appropriations;<br />
36. Annual average weekly earnings <strong>of</strong> production workers on manufacturing payrolls;<br />
37. Job growth: 2000 to 2001; 38. Normal daily mean temperature; 39. Percent <strong>of</strong> days that are<br />
sunny; 40. Homeownership rate; 41. Domestic migration <strong>of</strong> population: 2001 to 2002;<br />
42. Marriage rate; and 43. Percent <strong>of</strong> eligible population reported voting.<br />
• <strong>Iowa</strong> was ranked second in the nation as the most livable state in 2003,<br />
the same position it held 2002.<br />
• Minnesota remained at the top <strong>of</strong> the list for the seventh year in a row.<br />
Background<br />
Demographics<br />
25
Social<br />
Health Insurance<br />
TABLE 6B — POPULATION NOT COVERED BY HEALTH INSURANCE<br />
MIDWEST STATES 2001<br />
<strong>State</strong>/Nation <strong>State</strong> Percent Midwest Rank<br />
Illinois United <strong>State</strong>s 13.6 14.6% 1-<br />
Kansas 11.4 2<br />
Missouri Illinois 10.2 13.6 31<br />
North Dakota 9.6 4<br />
Kansas 11.4 2<br />
Nebraska 9.5 5<br />
South Missouri Dakota 9.3 10.2 63<br />
Minnesota 8.0 7<br />
Wisconsin North Dakota 7.7 9.6 84<br />
<strong>Iowa</strong><br />
Nebraska<br />
7.5<br />
9.5<br />
9<br />
5<br />
U.S.<br />
South Dakota<br />
14.6<br />
9.3<br />
-<br />
6<br />
Minnesota 8.0 7<br />
Wisconsin 7.7 8<br />
<strong>Iowa</strong> 7.5 9<br />
Source: U.S. Census Bureau, Current Population Survey, March 2002.<br />
• <strong>Iowa</strong> reported the lowest percentage (7.5) <strong>of</strong> uninsured persons in the midwest<br />
and nation for 2001.<br />
• Nationally 14.6 percent <strong>of</strong> the population lacked insurance coverage in 2001.<br />
• Texas showed the highest level <strong>of</strong> uninsured at 23.4 percent.<br />
26
Social<br />
Working Parents<br />
FIGURE 20B — CHILDREN 6-17 IN FAMILIES<br />
WITH BOTH PARENTS IN THE LABOR FORCE<br />
2000<br />
<strong>State</strong><br />
California<br />
West Virginia<br />
Texas<br />
Arizona<br />
New Mexico<br />
New York<br />
Utah<br />
Louisiana<br />
Kentucky<br />
Alabama<br />
New J ersey<br />
Mississippi<br />
Nevada<br />
Florida<br />
United <strong>State</strong>s<br />
Oklahoma<br />
Arkansas<br />
Illinois<br />
Tennessee<br />
Georgia<br />
Washington<br />
Pennsylvania<br />
Alaska<br />
Idaho<br />
S outh Carolina<br />
Michigan<br />
Oregon<br />
Rhode Island<br />
Massachusetts<br />
North Carolina<br />
Colorado<br />
Virginia<br />
Ohio<br />
Hawaii<br />
Indiana<br />
Connecticut<br />
Missouri<br />
Maryland<br />
Delaware<br />
Kansas<br />
Montana<br />
Maine<br />
Wyoming<br />
New Hampshire<br />
Wisconsin<br />
Nebraska<br />
Minnesota<br />
Vermont<br />
North Dakota<br />
South Dakota<br />
<strong>Iowa</strong><br />
• <strong>Iowa</strong> showed the highest<br />
percentage, 79.4, <strong>of</strong> both parents<br />
in the labor force for the 2000<br />
Census.<br />
• Six midwest states, <strong>Iowa</strong>, South<br />
Dakota, North Dakota,<br />
Minnesota, Nebraska, and<br />
Wisconsin, reported percentages<br />
greater than 75 percent.<br />
• California reported the lowest<br />
percentage, 59.7, <strong>of</strong> both parents<br />
in the labor force for the 2000<br />
Census.<br />
• The nation showed 67.4 percent<br />
<strong>of</strong> both parents in the labor force<br />
for the 2000 Census.<br />
Source: U.S. Census Bureau, Census 2000<br />
Summary File 3, P46 Age <strong>of</strong> Own<br />
Children Under 18 Years in Families<br />
and Subfamilies by Living<br />
Arrangements by Employment Status<br />
<strong>of</strong> Parents.<br />
0.0 10.0 20.0 30.0 40.0 50.0 60.0 70.0 80.0 90.0<br />
Percent<br />
59 . 7<br />
60.0<br />
62.7<br />
62.9<br />
63.5<br />
63.6<br />
63.7<br />
64.9<br />
64.9<br />
65.6<br />
66.5<br />
66.6<br />
66.8<br />
67.4<br />
67.4<br />
67.9<br />
68.0<br />
68.1<br />
68.1<br />
68.4<br />
68.7<br />
68.7<br />
68.9<br />
69.0<br />
69.4<br />
69.8<br />
70. 0<br />
70. 3<br />
70. 3<br />
70. 4<br />
70. 6<br />
70.7<br />
70. 9<br />
71. 0<br />
71.9<br />
71.9<br />
72. 1<br />
73 . 1<br />
73. 5<br />
74. 1<br />
74. 3<br />
74. 3<br />
74. 5<br />
75. 5<br />
77. 1<br />
77. 5<br />
77. 8<br />
78.2<br />
79 . 1<br />
79 . 2<br />
79 . 4<br />
Background<br />
Demographics<br />
27
Social<br />
Out-<strong>of</strong>-Wedlock Births<br />
FIGURE 21B — IOWA, OUT-OF-WEDLOCK BIRTHS AS A PERCENT<br />
OF TOTAL RESIDENT LIVE BIRTHS RATES<br />
1980 TO 2001<br />
35<br />
30<br />
25<br />
20<br />
15<br />
10<br />
19.4 21.0 22.2 23.5 24.6 24.8 25.2 26.3 26.2 27.2 27.5 28.0<br />
28.8<br />
10.2 10.7 11.3 11.9 12.5 13.6 15.0 16.2 17.7<br />
5<br />
0<br />
1980<br />
1981<br />
1982<br />
1983<br />
1984<br />
Percent<br />
1985<br />
1986<br />
1987<br />
1988<br />
1989<br />
1990<br />
1991<br />
1992<br />
1993<br />
1994<br />
1995<br />
1996<br />
1997<br />
1998<br />
1999<br />
2000<br />
2001<br />
Year<br />
Source: <strong>Iowa</strong> Department <strong>of</strong> Public Health, Center for Health Statistics, Vital Statistics <strong>of</strong> <strong>Iowa</strong> 2001.<br />
• Out-<strong>of</strong>-wedlock births increased to 28.8 percent in 2001 continuing the upward<br />
trend since 1974.<br />
• The out-<strong>of</strong>-wedlock birth rate is 27.1 percent for whites and 74.6 percent for<br />
African Americans.<br />
• Nationally the out-<strong>of</strong>-wedlock birth rate increased to 33.5 percent in 2001 up<br />
from 33.2 percent in 2000.<br />
28
INTRODUCTION TO GRADES PK-12<br />
Information presented in The Annual Condition <strong>of</strong> Education Report provides detailed<br />
information on a variety <strong>of</strong> aspects <strong>of</strong> pre-kindergarten through 12 th grade for <strong>Iowa</strong> public and<br />
nonpublic schools. Data reported in most cases reflects the 2002-2003 school year; however,<br />
when information for 2002-2003 isn’t available, the most current information was used.<br />
<strong>Iowa</strong> schools served 526,019 students in 1,500 public and 208 accredited nonpublic schools.<br />
Other highlights <strong>of</strong> the Enrollment Chapter include:<br />
• <strong>Iowa</strong>’s 371 public school districts operated 365 high schools and 812 elementary<br />
schools.<br />
• Of the 371 school districts, 24 sent their high school students to another district<br />
in 2002-2003.<br />
• Slightly less than 80 percent <strong>of</strong> <strong>Iowa</strong>’s high schools had less than 500 students<br />
and 38 percent had less than 200 students.<br />
• Open enrolled students accounted for 4.2 percent <strong>of</strong> the total certified enrollment,<br />
continuing a 13-year upward trend.<br />
• Special education enrollment increased to 64,700 and accounted for 13.3<br />
percent <strong>of</strong> the total certified enrollment.<br />
• English language learner enrollment totaled 13,595 in 2002-2003, and increased<br />
for the 15 th consecutive year.<br />
Slightly more than 45,500 licensed staff provided service to <strong>Iowa</strong>’s public and nonpublic<br />
schools in 2002-2003. There were 33,425 full-time teachers serving public districts and 2,456<br />
are full-time teachers serving nonpublic schools. Other information in the Staff chapter<br />
includes:<br />
• Average salary for public full-time teachers was $39,059 in 2002-2003.<br />
• There were 1,104 beginning full-time public school teachers with an average<br />
salary <strong>of</strong> $27,672.<br />
• There were 1,091 public school full-time principals with an average salary <strong>of</strong><br />
$68,087.<br />
• There were 342 full-time superintendents with an average salary <strong>of</strong> $87,146.<br />
• There were 15 Area Education Agencies (AEAs) that had 2,287 full-time staff<br />
that provided support in emerging education practices, planning, pr<strong>of</strong>essional<br />
development, media and technology services.<br />
• <strong>Iowa</strong>’s pupil-teacher ratio was 15.3 to 1.<br />
%<br />
Elementary/Secondary<br />
Introduction<br />
to Grades PK-12<br />
Average class size increased for three <strong>of</strong> the four grades for which data is collected in 2002-<br />
2003. Kindergarten average class size increased to 18.9 (from 18.6 the previous year); grade<br />
one average class size increased to 18.8 (from 18.5 the previous year); grade two average class<br />
size increased to 19.7 (from 19.4 the previous year); and grade three average class size<br />
remained unchanged at 20.4. Other data in the Program Chapter includes:<br />
• Nearly 30 percent <strong>of</strong> school districts had an organizational structure <strong>of</strong> K-5, 6-<br />
8, and 9-12.<br />
• Hardware and s<strong>of</strong>tware per pupil expenditures combined were $58.72, the<br />
lowest per pupil amount since 1994-1995.<br />
• There were 3.7 students per computer, the lowest amount since this data was<br />
collected.<br />
• Of the 371 school districts in <strong>Iowa</strong>, 341 have been enabled to send Basic<br />
Educational Data Survey (BEDS) data electronically through Project EASIER<br />
(Electronic Access System for <strong>Iowa</strong> Education Records). In the spring <strong>of</strong> 2003,<br />
291 school districts submitted their Spring BEDS data through Project EASIER.<br />
• In 2002-2003, 350 school districts (94.3 percent) <strong>of</strong>fered all-day, everyday,<br />
two-semester kindergarten programs, continuing the growth <strong>of</strong> that trend.<br />
29
Data pertaining to the <strong>Iowa</strong> Tests <strong>of</strong> Basic Skills for students in grades 3 through 8 and the<br />
<strong>Iowa</strong> Tests <strong>of</strong> Educational Development for students in grades 9 through 11 is reported in the<br />
Student Performance Chapter. Other items <strong>of</strong> note from that Chapter:<br />
• The percentage <strong>of</strong> 4 th , 8 th and 11 th grade students achieving in a range <strong>of</strong> 69<br />
percent to 79 percent in the 2001-2003 biennium in reading comprehension and<br />
mathematics.<br />
• The percentage <strong>of</strong> 8 th and 11 th grade students achieving above 77 percent in the<br />
2001-2003 biennium in science status.<br />
• The percentage <strong>of</strong> students considered dropouts for grades 7-12 and the<br />
percentage <strong>of</strong> high school graduates.<br />
• The percentage <strong>of</strong> high school students who intend to pursue postsecondary<br />
education or training.<br />
• The percentage <strong>of</strong> high school students achieving an ACT national average<br />
score or above and the percentage <strong>of</strong> students achieving an ACT score <strong>of</strong> 20 or<br />
above.<br />
• The percentage <strong>of</strong> high school graduates who complete a “core” high school<br />
program <strong>of</strong> four years <strong>of</strong> English-language arts and three or more years each <strong>of</strong><br />
mathematics, science, and social studies.<br />
• Average SAT scores for <strong>Iowa</strong> remained above the national average for both<br />
SAT Verbal and SAT Math.<br />
• In 2002-2003, 11 <strong>of</strong> the 1,500 public schools (0.7 percent) were determined to<br />
be in need <strong>of</strong> assistance under the No Child Left Behind guidelines for <strong>Iowa</strong>.<br />
<strong>Iowa</strong>’s 371 school districts are funded through a combination <strong>of</strong> state, local, and federal<br />
sources. Local school district taxes accounted for almost one-third <strong>of</strong> school district total<br />
general fund revenue while total state aid accounted for just over 56 percent in 2001-2002.<br />
Other information found in the Finance Chapter includes:<br />
• Salaries and benefits were approximately 82 percent <strong>of</strong> the total object category<br />
expenditures in 2001-2002.<br />
• <strong>Iowa</strong>’s average taxable valuation per pupil increased 2.9 percent in 2003-<br />
2004 to $208,711.<br />
• The percent <strong>of</strong> state general fund appropriations spent on K-12 education<br />
was 43.0 percent in 2003-2004.<br />
• The average school district general fund levy was approximately $11.7 per<br />
$1,000 <strong>of</strong> taxable valuation in 2003-2004.<br />
• Forty-two <strong>of</strong> 99 counties (42.4 percent) had enacted a local option sales and<br />
services tax for school infrastructure as <strong>of</strong> June 30, 2003.<br />
• The total <strong>Iowa</strong> elementary and secondary school district budget was<br />
estimated at $3.548 billion in 2003-2004.<br />
Educational data by district, including enrollment, free and reduced price lunch, dropouts,<br />
and graduates, are available at the <strong>Iowa</strong> Department <strong>of</strong> Education web site at:<br />
http://www.state.ia.us/educate/fis/pre/eddata/index.html<br />
30
ENROLLMENT<br />
Enrollment information presented in this section is collected from the Basic Educational Data<br />
Survey (BEDS), certified enrollment, the National Center for Educational Statistics (NCES),<br />
and Special Education counts. Information pertaining to state enrollment totals as well as by<br />
district enrollment categories is summarized in this section. Data included in this section are<br />
enrollment trends, enrollment changes for the nation, distribution <strong>of</strong> public school students<br />
and districts, enrollment distribution by Area Education Agency and counties, racial/ethnic<br />
distribution <strong>of</strong> students, information pertaining to English Language Learners (ELL), open<br />
enrollment, and special education enrollment.<br />
Enrollment Trends<br />
Public school K-12 enrollments continued to decrease in 2002-2003. The decrease represents<br />
the sixth consecutive year <strong>of</strong> declining public school K-12 enrollments from the 1996-1997<br />
school year. During that period, public school K-12 enrollments have declined 18,502<br />
students (3.7 percent). The total public K-12 school enrollment in 2002-2003 was 2,502<br />
students below (-0.5 percent) public school K-12 enrollments in 2001-2002. The 1972-1973<br />
school year had the historical high in public school K-12 enrollment <strong>of</strong> 645,000 (Table 1 and<br />
Figure 1).<br />
udents<br />
Table 1<br />
Elementary/Secondary<br />
Enrollment<br />
IOWA PUBLIC AND NONPUBLIC SCHOOL K-12 ENROLLMENTS<br />
1972-1973 AND 1985-1986 TO 2002-2003<br />
Combined Total<br />
Combined Change From<br />
Year Public Nonpublic Total Previous Year<br />
1972-1973 645,000 66,000 711,000<br />
1985-1986 485,332 49,026 534,358 -24.8%*<br />
1986-1987 481,205 48,520 529,725 -0.9<br />
1987-1988 478,859 47,228 526,087 -0.7<br />
1988-1989 476,771 47,373 524,144 -0.4<br />
1989-1990 478,210 46,033 524,243 0.0<br />
1990-1991 483,399 45,562 528,961 0.9<br />
1991-1992 491,451 45,865 537,316 1.6<br />
1992-1993 495,342 45,229 540,571 0.6<br />
1993-1994 497,009 45,328 542,337 0.3<br />
1994-1995 500,592 44,752 545,344 0.6<br />
1995-1996 504,505 44,563 549,068 0.7<br />
1996-1997 505,523 44,302 549,825 0.1<br />
1997-1998 505,130 43,417 548,547 -0.2<br />
1998-1999 502,534 42,758 545,292 -0.6<br />
1999-2000 498,607 42,280 540,887 -0.8<br />
2000-2001 494,291 41,064 535,355 -1.0<br />
2001-2002 489,523 39,881 529,404 -1.1<br />
2002-2003 487,021 38,998 526,019 -0.6<br />
Source: <strong>Iowa</strong> Department <strong>of</strong> Education, Division <strong>of</strong> Financial and Information Services, Certified Enrollment Files,<br />
and Bureau <strong>of</strong> Planning, Research, and Evaluation, Basic Educational Data Survey, Enrollment Files.<br />
Note: *Base year for comparison. Change from 1972-1973 to 1985-1986.<br />
31
Figure 1<br />
IOWA PUBLIC SCHOOL K-12 ENROLLMENTS<br />
1985-1986 TO 2002-2003<br />
520,000<br />
500,000<br />
480,000<br />
460,000<br />
440,000<br />
485,332<br />
481,205<br />
478,859<br />
476,771<br />
478,210<br />
483,399<br />
491,451<br />
495,342<br />
497,009<br />
500,592<br />
504,505<br />
505,523<br />
505,130<br />
502,534<br />
498,607<br />
494,291<br />
489,523<br />
487,021<br />
420,000<br />
400,000<br />
1985-1986<br />
1986-1987<br />
1987-1988<br />
1988-1989<br />
1989-1990<br />
1990-1991<br />
1991-1992<br />
1992-1993<br />
1993-1994<br />
1994-1995<br />
1995-1996<br />
1996-1997<br />
Number <strong>of</strong> Students<br />
1997-1998<br />
1998-1999<br />
1999-2000<br />
2000-2001<br />
2001-2002<br />
2002-2003<br />
Year<br />
Source:<br />
<strong>Iowa</strong> Department <strong>of</strong> Education, Division <strong>of</strong> Financial and Information Services, Certified Enrollment Files.<br />
Nonpublic K-12 enrollments continued to decline as well. In the 2002-2003 school year,<br />
nonpublic enrollment decreased by 883 students (2.2 percent), continuing the downward<br />
trend shown in Table 1 and Figure 2.<br />
Figure 2<br />
IOWA NONPUBLIC SCHOOL K-12 ENROLLMENTS<br />
1985-1986 TO 2002-2003<br />
50,000<br />
Number <strong>of</strong> Students<br />
45,000<br />
40,000<br />
35,000<br />
49,026<br />
48,520<br />
47,228<br />
47,373<br />
46,033<br />
45,562<br />
45,865<br />
45,229<br />
45,328<br />
44,752<br />
44,563<br />
44,302<br />
43,417<br />
42,758<br />
42,280<br />
41,064<br />
39,881<br />
38,998<br />
30,000<br />
1985-1986<br />
1986-1987<br />
1987-1988<br />
1988-1989<br />
1989-1990<br />
1990-1991<br />
1991-1992<br />
1992-1993<br />
1993-1994<br />
1994-1995<br />
1995-1996<br />
1996-1997<br />
1997-1998<br />
1998-1999<br />
1999-2000<br />
2000-2001<br />
2001-2002<br />
2002-2003<br />
.<br />
32<br />
Source:<br />
Year<br />
<strong>Iowa</strong> Department <strong>of</strong> Education, Bureau <strong>of</strong> Planning, Research, and Evaluation, Basic Educational<br />
Data Survey, Enrollment Files.
Table 2 presents information pertaining to public school enrollments for each grade level<br />
(K-12) for the years 1985-1986, 2001-2002, and 2002-2003. In 2002-2003, nine <strong>of</strong> the grade<br />
levels showed a decrease from the previous year. Kindergarten decreased by 159 students<br />
(-0.5 percent) from the 2001-2002 school year. Kindergarten and grade 1 have the greatest<br />
decreases when comparing data from the 2002-2003 to the 1985-1986 school year. Public<br />
school enrollments for kindergarten have decreased 6,835 (-16.7 percent) and for grade 1 by<br />
5,063 (-13.3 percent). Grades 6 and 7 have shown the largest increase between the years 1985-<br />
1986 and 2002-2003 with each over a 14 percent increase. Although the total public K-12<br />
enrollments have fluctuated from 1985-1986 to 2002-2003, the overall change between those<br />
years was 1,689 (0.3 percent).<br />
Table 2<br />
IOWA PUBLIC SCHOOL ENROLLMENTS BY GRADE LEVEL<br />
1985-1986, 2001-2002 AND 2002-2003<br />
2001-2002 to 1985-1986 to<br />
Grade 2002-2003 2002-2003<br />
Level 1985-1986 2001-2002 2002-2003 % Change % Change<br />
Elementary/Secondary<br />
Enrollment<br />
K 40,925 34,249 34,090 -0.5% -16.7%<br />
1 38,110 32,979 33,047 0.2 -13.3<br />
2 35,387 33,957 32,767 -3.5 -7.4<br />
3 34,508 35,204 33,653 -4.4 -2.5<br />
4 32,977 36,106 34,803 -3.6 5.5<br />
5 33,327 36,729 35,861 -2.4 7.6<br />
6 32,038 37,548 36,581 -2.6 14.2<br />
7 32,653 37,666 37,693 0.1 15.4<br />
8 35,136 37,115 37,281 0.4 6.1<br />
9 39,688 39,818 39,434 -1.0 -0.6<br />
10 39,337 39,126 37,958 -3.0 -3.5<br />
11 37,203 38,443 38,027 -1.1 2.2<br />
12 35,906 36,469 36,728 0.7 2.3<br />
Other* 18,137 14,114 19,098<br />
(NA)<br />
(NA)<br />
<strong>State</strong> 485,332 489,523 487,021 -0.5 0.3<br />
Source:<br />
Note:<br />
<strong>Iowa</strong> Department <strong>of</strong> Education, Bureau <strong>of</strong> Planning, Research, and Evaluation, Basic Educational<br />
Data Survey, Enrollment Files.<br />
*Other refers primarily to special education students not associated with a given grade level.<br />
This is not a count <strong>of</strong> the number <strong>of</strong> special education students in the state.<br />
33
Figure 3 compares the number <strong>of</strong> 12 th graders to the number <strong>of</strong> kindergartners in public<br />
schools for the years 1993 to 2003. This information can provide an indication <strong>of</strong> the<br />
enrollment trends. The number <strong>of</strong> outgoing 12 th graders exceeded the number <strong>of</strong> incoming<br />
kindergartners for the sixth consecutive year. This data corresponds with the declining public<br />
school enrollments provided in Table 1.<br />
Figure 3<br />
IOWA PUBLIC SCHOOL ENROLLMENTS<br />
KINDERGARTEN VS GRADE 12 1993-1994 TO 2002-2003<br />
39,000<br />
38,000<br />
37,000<br />
36,000<br />
Enrollment<br />
35,000<br />
34,000<br />
33,000<br />
32,000<br />
31,000<br />
Kindergarten<br />
Grade 12<br />
30,000<br />
1993-<br />
1994<br />
1994-<br />
1995<br />
1995-<br />
1996<br />
1996-<br />
1997<br />
1997-<br />
1998<br />
1998-<br />
1999<br />
Year Ending<br />
1999-<br />
2000<br />
2000-<br />
2001<br />
2001-<br />
2002<br />
2002-<br />
2003<br />
Source:<br />
<strong>Iowa</strong> Department <strong>of</strong> Education, Bureau <strong>of</strong> Planning, Research, and Evaluation, Basic Educational<br />
Data Survey, Enrollment Files.<br />
The decline in public K-12 enrollment can be seen in the number <strong>of</strong> districts that have moved<br />
into the smaller enrollment categories leading to total enrollment increases in those categories<br />
between 2001-2002 and 2002-2003. The three smallest enrollment categories each had<br />
increases in total enrollments and number <strong>of</strong> districts. The largest enrollment category<br />
(7,500+) had no change in the number <strong>of</strong> districts but did have a slight increase in total<br />
enrollment <strong>of</strong> 101 students (0.1 percent). Although four <strong>of</strong> the seven enrollment categories<br />
had enrollment increases, those increases did not outweigh the total enrollment declines <strong>of</strong><br />
the . three enrollment categories between 600 and 7,499 students. Each <strong>of</strong> those categories had<br />
a total enrollment decrease <strong>of</strong> over 1,000 with the enrollment category 2,500-7,499 showing<br />
a decline <strong>of</strong> 2,123 students (-2.1 percent). Table 3 provides detailed data by enrollment<br />
category for 2001-2002 and 2002-2003.<br />
Table 3<br />
IOWA PUBLIC SCHOOL ENROLLMENT CHANGES<br />
BY ENROLLMENT CATEGORY 2001-2002 AND 2002-2003<br />
Absolute<br />
Enrollment Number 2001-2002 Number <strong>of</strong> 2002-2003 Enrollment Percent<br />
Category <strong>of</strong> Districts Enrollment Districts Enrollment Change Change<br />
Among states in the region, Illinois had the largest public K-12 enrollment and the largest<br />
percentage increase in enrollment between 1991 and 2001 at 11.9 percent (see Table 4 and<br />
Figure 4). All states listed had enrollment increases between 1991 and 2001 below the<br />
national average (13.1 percent). Of the states listed, three states, including <strong>Iowa</strong>, had<br />
enrollment decreases between the years shown.<br />
Table 4<br />
PUBLIC SCHOOL K-12 ENROLLMENT TRENDS FOR IOWA,<br />
THE NATION, AND MIDWEST STATES<br />
1991, 1996 AND 2001<br />
School Year Beginning<br />
Percent Change<br />
Nation and <strong>State</strong> 1991 1996 2001 1991-2001<br />
Nation 42,046,878 45,611,046 47,575,862 13.1%<br />
Illinois 1,848,166 1,973,040 2,068,182 11.9<br />
Missouri 842,965 900,517 892,582 5.9<br />
Wisconsin 814,671 879,559 878,809 7.9<br />
Minnesota 773,571 847,204 845,700 9.3<br />
<strong>Iowa</strong> 491,363 502,941 489,523 -0.4<br />
Kansas 445,390 466,293 468,140 5.1<br />
Nebraska 279,552 291,967 285,022 2.0<br />
South Dakota 131,576 143,331 126,560 -3.8<br />
North Dakota 118,376 120,123 106,047 -10.4<br />
Elementary/Secondary<br />
Enrollment<br />
Source: U.S. Department <strong>of</strong> Education, Digest <strong>of</strong> Education Statistics, 2002.<br />
Figure 4<br />
PUBLIC SCHOOL K-12 ENROLLMENTS FOR IOWA AND<br />
MIDWEST STATES — 2001-2002<br />
2,250,000<br />
2,000,000<br />
2,068,182<br />
Number <strong>of</strong> Students<br />
1,750,000<br />
1,500,000<br />
1,250,000<br />
1,000,000<br />
750,000<br />
500,000<br />
250,000<br />
0<br />
106,047 126,560<br />
North<br />
Dakota<br />
South<br />
Dakota<br />
285,022<br />
468,140<br />
489,523<br />
845,700 878,809 892,582<br />
Nebraska Kansas <strong>Iowa</strong><br />
Minnesota Wisconsin Missouri Illinois<br />
<strong>State</strong><br />
Source: U.S. Department <strong>of</strong> Education, Digest <strong>of</strong> Education Statistics, 2002.<br />
35
<strong>Iowa</strong> K-12 public school enrollment projections for 2003-2004 through 2007-2008 are<br />
presented in Table 5. Enrollment projections are based upon trends observed in the enrollment<br />
changes from grade to grade. Estimated enrollments for grades 1-12 are calculated using an<br />
average cohort survival ratio. Kindergarten enrollments were estimated from an average ratio<br />
<strong>of</strong> kindergarten enrollments to the cohort born five years earlier. The projections show a<br />
continuation <strong>of</strong> the downward trend in total enrollments. The projections also indicate that<br />
the number <strong>of</strong> outgoing grade 12 students will be greater than the number <strong>of</strong> incoming<br />
kindergartners for each year shown.<br />
Table 5<br />
IOWA PUBLIC SCHOOL ENROLLMENT PROJECTIONS BY GRADE LEVEL<br />
2003-2004 TO 2007-2008<br />
Grade<br />
Level 2003-2004 2004-2005 2005-2006 2006-2007 2007-2008<br />
K 34,734 35,256 35,077 34,788 34,844<br />
1 33,523 33,882 34,392 34,217 33,935<br />
2 32,944 33,419 33,777 34,285 34,111<br />
3 32,871 33,049 33,525 33,884 34,394<br />
4 33,781 32,996 33,175 33,653 34,013<br />
5 34,952 33,926 33,138 33,317 33,797<br />
6 37,278 35,359 34,321 33,524 33,705<br />
7 37,359 37,049 36,111 35,051 34,237<br />
8 37,867 37,531 37,220 36,277 35,212<br />
9 40,166 40,797 40,435 40,100 39,084<br />
10 37,960 38,664 39,272 38,923 38,601<br />
11 36,541 36,543 37,220 37,806 37,470<br />
12 36,831 35,392 35,393 36,049 36,617<br />
Other* 18,399 17,859 17,365 16,858 16,331<br />
<strong>State</strong> 484,206 481,722 480,421 478,732 476,351<br />
Source:<br />
Note:<br />
<strong>Iowa</strong> Department <strong>of</strong> Education, Bureau <strong>of</strong> Planning, Research, and Evaluation, Public School<br />
Enrollment Projections.<br />
*Other refers primarily to special education students not associated with a given grade level.<br />
This is not a count <strong>of</strong> the number <strong>of</strong> special education students in the state.<br />
36
Historical and projected <strong>Iowa</strong> public school K-12 enrollments are presented in Table 6. Total<br />
enrollments continued to decline from the 1996-1997 school year. Projections through the<br />
2007-2008 school year show the downward trend is estimated to continue. Projections<br />
indicate that by the 2007-2008 school year, only the kindergarten and grade 1-3 group will<br />
have greater enrollments than their corresponding group in 2002-2003.<br />
Table 6<br />
IOWA PUBLIC SCHOOL K-12 ENROLLMENTS FOR<br />
1993-1994 THROUGH 2002-2003 AND PROJECTED ENROLLMENTS<br />
FOR 2003-2004 THROUGH 2007-2008<br />
GRADE LEVEL<br />
Grand<br />
Year K 1-3 4-5 6-8 9-11 12 Total Other* Total<br />
ENROLLMENTS<br />
Elementary/Secondary<br />
Enrollment<br />
1993-1994 36,311 108,244 73,808 115,010 109,857 32,545 475,775 21,234 497,009<br />
1994-1995 37,402 106,402 73,500 115,534 113,867 34,078 480,783 19,809 500,592<br />
1995-1996 37,629 106,020 73,635 114,665 117,926 34,565 484,440 20,065 504,505<br />
1996-1997 37,101 107,324 71,368 114,295 119,262 35,650 485,000 20,523 505,523<br />
1997-1998 36,486 107,817 69,871 112,447 118,720 36,808 482,149 22,981 505,130<br />
1998-1999 35,772 108,065 70,882 111,332 118,668 37,166 481,885 20,649 502,534<br />
1999-2000 34,596 106,965 72,913 110,092 118,382 37,124 480,072 18,484 498,556<br />
2000-2001 33,977 104,716 73,423 109,738 118,181 36,892 476,927 17,364 494,291<br />
2001-2002 34,249 102,140 72,835 112,329 117,387 36,469 475,409 14,114 489,523<br />
2002-2003 34,090 99,467 70,664 111,565 115,419 36,728 467,923 19,098 487,021<br />
PROJECTED ENROLLMENTS<br />
2003-2004 34,734 99,338 68,733 113,504 114,667 36,831 465,807 18,399 484,206<br />
2004-2005 35,256 100,350 66,922 109,939 116,004 35,392 463,863 17,859 481,722<br />
2005-2006 35,077 101,694 66,313 107,652 116,927 35,393 463,056 17,365 480,421<br />
2006-2007 34,788 102,386 66,970 104,852 116,829 36,049 461,874 16,858 478,732<br />
2007-2008 34,844 102,440 67,810 103,154 115,155 36,617 460,020 16,331 476,351<br />
Source:<br />
Notes:<br />
<strong>Iowa</strong> Department <strong>of</strong> Education, Bureau <strong>of</strong> Planning, Research, and Evaluation, Basic<br />
Educational Data Survey, Enrollment Files, and Public School Enrollment Projections.<br />
All enrollments are as <strong>of</strong> the third Friday in September. The public school enrollment projections are<br />
based upon trends observed in the number <strong>of</strong> students moving from grade to grade. The trend,<br />
calculated as an average cohort survival ratio, was used to estimate enrollments for first through twelfth<br />
grade. Kindergarten enrollments were estimated from an average ratio <strong>of</strong> kindergarten enrollments to<br />
cohorts born five years prior.<br />
*Other refers primarily to special education students not associated with a given grade level.<br />
This is not a count <strong>of</strong> the number <strong>of</strong> special education students in the state.<br />
37
<strong>Iowa</strong> nonpublic school K-12 historical and projected enrollments are shown in Table 7. Total<br />
enrollments have decreased for each year shown and projections estimate that the trend will<br />
continue. The nonpublic enrollment total for 2002-2003 was 38,998 down 883 (2.2 percent)<br />
students from the previous year and 6,330 (14.0 percent) from 1993-1994. The projections<br />
indicate that only the kindergarten group will increase between 2002-2003 and 2003-2004.<br />
Table 7<br />
IOWA NONPUBLIC SCHOOL K-12 ENROLLMENTS<br />
FOR 1993-1994 THROUGH 2002-2003 AND PROJECTED ENROLLMENTS<br />
FOR 2003-2004 THROUGH 2007-2008<br />
GRADE LEVEL<br />
Year K 1-3 4-5 6-8 9-11 12 Total<br />
ENROLLMENTS<br />
1993-1994 3,905 12,613 8,235 10,827 7,499 2,249 45,328<br />
1994-1995 3,976 12,301 8,152 10,397 7,526 2,390 44,742<br />
1995-1996 4,002 12,245 8,107 10,480 7,522 2,193 44,549<br />
PROJECTED ENROLLMENTS<br />
1996-1997 4,096 12,216 7,791 10,362 7,534 2,303 44,302<br />
1997-1998 3,943 12,205 7,598 10,120 7,198 2,353 43,417<br />
1998-1999 3,935 11,919 7,721 9,816 7,066 2,301 42,758<br />
1999-2000 3,888 11,678 7,645 9,773 6,938 2,358 42,280<br />
2000-2001 3,853 11,357 7,434 9,402 6,667 2,230 40,943<br />
2001-2002 3,705 11,154 7,218 9,218 6,442 2,144 39,881<br />
2002-2003 3,585 10,846 6,937 9,124 6,369 2,137 38,998<br />
PROJECTED ENROLLMENTS<br />
2003-2004 3,786 10,698 6,840 8,792 6,283 2,062 38,461<br />
2004-2005 3,843 10,705 6,681 8,594 6,151 2,004 37,978<br />
2005-2006 3,824 10,836 6,506 8,348 6,037 2,002 37,553<br />
2006-2007 3,792 10,910 6,447 8,174 5,826 1,980 37,159<br />
2007-2008 3,798 10,912 6,548 7,993 5,693 1,881 36,825<br />
Source:<br />
Notes:<br />
<strong>Iowa</strong> Department <strong>of</strong> Education, Bureau <strong>of</strong> Planning, Research, and Evaluation, Basic Educational<br />
Data Survey, Enrollment Files and Nonpublic School Enrollment Projections.<br />
All enrollments are as <strong>of</strong> the third Friday in September. The nonpublic school enrollment projections are<br />
based upon trends observed in the number <strong>of</strong> students moving from grade to grade. The trend,<br />
calculated as an average cohort survival ratio, was used to estimate enrollments for first through twelfth<br />
grade. Kindergarten enrollments were estimated from an average ratio <strong>of</strong> kindergarten enrollments to<br />
cohorts born five years prior.<br />
38
Enrollment Changes for the Nation<br />
<strong>Iowa</strong>, along with most <strong>of</strong> the midwest states, experienced a decrease in public enrollments<br />
between 1996 and 2001 (Figure 5). Of the midwest states, only Illinois and Kansas had an<br />
increase in public enrollments in the years shown. Nationally, five states had an increase in<br />
public enrollments greater than 10.0 percent (Nevada, Arizona, Colorado, New Jersey, and<br />
Florida).<br />
Figure 5<br />
PERCENT CHANGE IN PUBLIC ELEMENTARY AND<br />
SECONDARY ENROLLMENT BY STATE<br />
FALL 1996 TO FALL 2001<br />
Elementary/Secondary<br />
Enrollment<br />
Increase <strong>of</strong> more than 10 percent<br />
Increase <strong>of</strong> 5 to 10 percent<br />
Increase <strong>of</strong> less than 5 percent<br />
Decrease<br />
Source: U.S. Department <strong>of</strong> Education, Digest <strong>of</strong> Education Statistics, 2002.<br />
39
Distribution <strong>of</strong> Public School Students and Districts<br />
During the 2002-2003 school year, <strong>Iowa</strong> had 371 school districts, which remained unchanged<br />
from the previous school year. Table 8 and Figures 6 and 7 detail the change in the number<br />
<strong>of</strong> school districts since 1950. Between 1950 and 1970, the number <strong>of</strong> school districts<br />
decreased from 4,652 to 453 a 90.3 percent decrease. The decrease between 1965 and 1970<br />
was due to an <strong>Iowa</strong> law change, which required all operating districts to provide K-12<br />
programs. Currently, just fewer than 70 percent <strong>of</strong> the school districts have less than 1,000<br />
students accounting for 28.3 percent <strong>of</strong> the total students. The nine school districts that fell in<br />
the largest enrollment category account for 27.2 percent <strong>of</strong> the total public K-12 enrollment.<br />
Table 8<br />
NUMBER OF IOWA PUBLIC SCHOOL DISTRICTS<br />
1950-2003<br />
Number <strong>of</strong><br />
Percent Change<br />
School <strong>Iowa</strong> Public School from Previous<br />
Year Ending Districts Year<br />
1950 4,652 —<br />
1955 4,142 -11.0%<br />
1960 1,575 -62.0<br />
1965 1,056 -33.0<br />
1970 453 -57.1<br />
1975 449 -0.9<br />
1980 443 -1.3<br />
1985 437 -1.4<br />
1986 436 -0.2<br />
1987 436 0.0<br />
1988 433 -0.7<br />
1989 431 -0.5<br />
1990 430 -0.2<br />
1991 425 -1.2<br />
1992 418 -1.6<br />
1993 397 -5.0<br />
1994 390 -1.8<br />
1995 384 -1.5<br />
1996 379 -1.3<br />
1997 377 -0.5<br />
1998 375 -0.5<br />
1999 375 0.0<br />
2000 374 -0.3<br />
2001 371 -0.8<br />
2002 371 0.0<br />
2003 371 0.0<br />
Source:<br />
Note:<br />
<strong>Iowa</strong> Department <strong>of</strong> Education, Bureau <strong>of</strong> Planning, Research, and Evaluation, Basic Educational<br />
Data Survey, Address Files and Historical Archives.<br />
Prior to July 1, 1966, <strong>Iowa</strong> allowed schools to operate as non-K-12 school districts.<br />
40
Figure 6<br />
Number <strong>of</strong> School Districts<br />
5,000<br />
4,000<br />
3,000<br />
2,000<br />
1,000<br />
NUMBER OF IOWA PUBLIC SCHOOL DISTRICTS<br />
1950 TO 1985<br />
4,652<br />
4,142<br />
1,575<br />
1,056<br />
453<br />
449<br />
443<br />
437<br />
Elementary/Secondary<br />
Enrollment<br />
0<br />
1950 1955 1960 1965 1970 1975 1980 1985<br />
Year Ending<br />
Source:<br />
Note:<br />
<strong>Iowa</strong> Department <strong>of</strong> Education, Bureau <strong>of</strong> Planning, Research, and Evaluation, Basic Educational<br />
Data Survey, Address Files and Historical Archives.<br />
Prior to July 1, 1966, <strong>Iowa</strong> allowed schools to operate as non-K-12 school districts.<br />
Figure 7<br />
NUMBER OF IOWA PUBLIC SCHOOL DISTRICTS<br />
1986 TO 2003<br />
460<br />
440<br />
Number <strong>of</strong> School Districts<br />
Source:<br />
Note:<br />
420<br />
400<br />
380<br />
360<br />
340<br />
320<br />
436<br />
436<br />
433<br />
431<br />
430<br />
425<br />
418<br />
397<br />
390<br />
1986<br />
1987<br />
1988<br />
1989<br />
1990<br />
1991<br />
1992<br />
1993<br />
1994<br />
<strong>Iowa</strong> Department <strong>of</strong> Education, Bureau <strong>of</strong> Planning, Research, and Evaluation, Basic Educational<br />
Data Survey, Address Files and Historical Archives.<br />
Prior to July 1, 1966, <strong>Iowa</strong> allowed schools to operate as non-K-12 school districts.<br />
384<br />
Year Ending<br />
379<br />
377<br />
375<br />
375<br />
374<br />
371<br />
1995<br />
1996<br />
1997<br />
1998<br />
1999<br />
2000<br />
2001<br />
371<br />
371<br />
2002<br />
2003<br />
41
The distribution <strong>of</strong> <strong>Iowa</strong> public school districts and students by enrollment category is<br />
presented in Table 9 for the 1985-1986, 2001-2002 and 2002-2003 school years. The number<br />
<strong>of</strong> school districts has decreased by 66 and the number <strong>of</strong> students has increased by 1,689 since<br />
1985-1986. The number <strong>of</strong> districts and students in the 600-999 enrollment category has<br />
remained relatively unchanged between 1985-1986 and 2002-2003 with 97 school districts<br />
and 72,595 students in 1985-1986 compared to 98 school districts and 75,279 students in<br />
2002-2003. The three smallest enrollment categories have seen the largest change in the years<br />
shown. The total number <strong>of</strong> school districts for the three smallest enrollment categories has<br />
decreased by 75 (-31.8 percent) and total number <strong>of</strong> students has decreased by 23,202 (-27.1<br />
percent) between 1985-1986 and 2002-2003.<br />
The total number <strong>of</strong> school districts has increased by eight (7.7 percent) and the total number<br />
<strong>of</strong> students has increased by 22,208 (6.8 percent) for the three largest enrollment categories<br />
between 1985-1986 and 2002-2003. Currently there are nine school districts in the largest<br />
enrollment category (7,500+) accounting for 2.4 percent <strong>of</strong> the total number <strong>of</strong> districts, but<br />
there are 132,314 students accounting for 27.2 percent <strong>of</strong> the total enrollment.<br />
Table 9<br />
DISTRIBUTION OF IOWA PUBLIC SCHOOL DISTRICTS AND<br />
STUDENTS BY ENROLLMENT CATEGORY<br />
1985-1986, 2001-2002 AND 2002-2003<br />
1985-1986 2001-2002 2002-2003<br />
Enrollment Districts Students Districts Students Districts Students<br />
Category N % N % N % N % N % N %<br />
Table 11<br />
Source:<br />
IOWA NONPUBLIC SCHOOL DISTRIBUTION BY TYPE<br />
1999-2000 TO 2002-2003<br />
1999-2000 2000-2001 2001-2002 2002-2003<br />
Type <strong>of</strong> School Number Percent Number Percent Number Percent Number Percent<br />
High School 26 12.6% 26 12.3% 26 12.4% 27 13.0%<br />
Elementary School 178 86.4 182 86.3 182 86.7 179 86.1<br />
K-12 School 2 1.0 3 1.4 2 1.0 2 0.9<br />
Total 206 211 210 208<br />
<strong>Iowa</strong> Department <strong>of</strong> Education, Bureau <strong>of</strong> Planning, Research, and Evaluation, Basic Educational<br />
Data Survey, Address Files.<br />
The number <strong>of</strong> public school districts sending high school students to another district<br />
increased to 24 in 2002-2003. These districts no longer <strong>of</strong>fer a high school program for their<br />
students. This was the first increase since the 1992-1993 school year (see Table 12). During<br />
the 2002-2003 school year, 57 school districts participated in some form <strong>of</strong> whole grade<br />
sharing.<br />
Elementary/Secondary<br />
Enrollment<br />
Table 12<br />
PUBLIC SCHOOL DISTRICTS SENDING<br />
HIGH SCHOOL STUDENTS OUT OF DISTRICT<br />
1985-1986 THROUGH 2002-2003<br />
Number <strong>of</strong> Districts Percent <strong>of</strong> Districts<br />
Total Number Sending High Sending High<br />
<strong>of</strong> Districts School Students School Students<br />
Year in <strong>Iowa</strong> Out <strong>of</strong> District Out <strong>of</strong> District<br />
1985-1986 437 2 0.5%<br />
1986-1987 436 7 1.6<br />
1987-1988 436 17 3.9<br />
1988-1989 433 26 6.0<br />
1989-1990 431 42 9.7<br />
1990-1991 430 51 11.9<br />
1991-1992 425 53 12.4<br />
1992-1993 418 56 13.4<br />
1993-1994 397 39 9.8<br />
1994-1995 390 36 9.2<br />
1995-1996 384 31 8.1<br />
1996-1997 379 26 6.9<br />
1997-1998 377 24 6.4<br />
1998-1999 375 24 6.4<br />
1999-2000 375 24 6.4<br />
2000-2001 374 23 6.2<br />
2001-2002 371 21 5.7<br />
2002-2003 371 24 6.5<br />
Source:<br />
<strong>Iowa</strong> Department <strong>of</strong> Education, Bureau <strong>of</strong> Planning, Research, and Evaluation, Basic Educational<br />
Data Survey, Address Files.<br />
43
Table 13 details the enrollment category the public high schools represent for 1998-1999<br />
through 2002-2003. For all the years shown, the greatest number <strong>of</strong> high schools were in the<br />
100-199 enrollment category. That enrollment category has increased by seven since the<br />
1998-1999 school year. High schools with under 700 students accounted for about<br />
86 percent <strong>of</strong> all the high schools in 2002-2003. A total <strong>of</strong> five high schools had enrollments<br />
over 1,700 students for all years shown with the exception <strong>of</strong> 2000-2001. The number <strong>of</strong> high<br />
schools with enrollments less than 100 has increased since 1998-1999, but remained<br />
unchanged between 2001-2002 and 2002-2003.<br />
Table 13<br />
IOWA PUBLIC HIGH SCHOOL ENROLLMENT DISTRIBUTION<br />
1998-1999 THROUGH 2002-2003<br />
2003<br />
2003 Cumulative<br />
Percent Percent<br />
Grades 9-12 1998- 1999- 2000- 2001- 2002- <strong>of</strong> High <strong>of</strong> High<br />
Enrollment 1999 2000 2001 2002 2003 Schools Schools<br />
Enrollment Distribution by Area Education Agency (AEA)<br />
There were 15 Area Education Agencies (AEAs) in the state in 2002-2003. Area Education<br />
Agencies provide instruction and support for local school districts. Starting on July 1, 2003,<br />
AEAs 3 and 5 and AEAs 2, 6, and 7 will each combine into single AEAs to reduce the number<br />
<strong>of</strong> statewide AEAs to 12.<br />
Table 14 and Figure 8 provide enrollment information for public and nonpublic schools by<br />
Area Education Agency. Of the 15 AEAs in 2002-2003, AEA 11 has the highest enrollment<br />
for both public (24.0 percent <strong>of</strong> total public enrollment) and nonpublic schools (20.7 percent<br />
<strong>of</strong> total nonpublic enrollment). AEAs 2, 6, and 7 combined to have 13.7 percent <strong>of</strong> the total<br />
public school students and AEAs 3 and 5 combined to have 7.1 percent <strong>of</strong> the total public<br />
school students in 2002-2003.<br />
Table 14<br />
DISTRIBUTION OF IOWA SCHOOL K-12 ENROLLMENTS BY AEA<br />
2002-2003<br />
Elementary/Secondary<br />
Enrollment<br />
Public School Enrollments Nonpublic School Enrollments Percent <strong>of</strong><br />
Combined<br />
AEA Number* Percent Number Percent Enrollments<br />
1 31,819 6.5% 6,556 16.8% 7.3%<br />
2 20,161 4.1 1,076 2.8 4.0<br />
3 11,261 2.3 1,033 2.6 2.3<br />
4 10,292 2.1 2,946 7.6 2.5<br />
5 23,425 4.8 1,685 4.3 4.8<br />
6 16,076 3.3 356 0.9 3.1<br />
7 30,692 6.3 2,800 7.2 6.4<br />
9 49,579 10.2 3,608 9.3 10.1<br />
10 64,021 13.1 4,678 12.0 13.1<br />
11 117,019 24.0 8,059 20.7 23.8<br />
12 29,928 6.1 3,206 8.2 6.3<br />
13 31,262 6.4 1,234 3.2 6.2<br />
14 11,245 2.3 125 0.3 2.2<br />
15 22,906 4.7 451 1.2 4.4<br />
16 17,337 3.6 1,185 3.0 3.5<br />
<strong>State</strong> 487,021 100.0 38,998 100.0 100.0<br />
Source:<br />
Note:<br />
<strong>Iowa</strong> Department <strong>of</strong> Education, Division <strong>of</strong> Financial and Information Services, Certified Enrollment File,<br />
and Bureau <strong>of</strong> Planning, Research, and Evaluation, Basic Educational Data Survey, Enrollment File.<br />
*Totals may not add due to rounding.<br />
45
Figure 8<br />
K-12 (PUBLIC AND NONPUBLIC) ENROLLMENTS BY AEA<br />
2002-2003<br />
4<br />
13,238<br />
3<br />
12,294<br />
2<br />
21,237<br />
1<br />
38,375<br />
12<br />
33,134<br />
13<br />
32,496<br />
5<br />
25,110<br />
11<br />
125,078<br />
7<br />
33,492<br />
6<br />
16,432<br />
10<br />
68,699<br />
9<br />
53,187<br />
14<br />
11,370<br />
15<br />
23,357<br />
16<br />
18,522<br />
Source:<br />
<strong>Iowa</strong> Department <strong>of</strong> Education, Division <strong>of</strong> Financial and Information Services, Certified Enrollment File,<br />
and Bureau <strong>of</strong> Planning, Research, and Evaluation, Basic Educational Data Survey, Enrollment File.<br />
County Level Enrollments<br />
Public school county level certified enrollments for 2001-2002 and 2002-2003 are presented in<br />
Table 15. Based on the 2000 census, the most populous county in the state also had the largest<br />
enrollment (Polk) while the smallest county in the state had the smallest enrollment (Adams).<br />
Marshall county had the greatest increase (6.0 percent) in enrollment and Tama county had the<br />
greatest decrease in enrollment (-12.1 percent) between 2001-2002 and 2002-2003. Overall<br />
public enrollment decreased 0.5 percent between the two school years shown.<br />
46
Table 15<br />
IOWA PUBLIC SCHOOL CERTIFIED ENROLLMENT BY COUNTY OF RESIDENCE<br />
2001-2002 AND 2002-2003<br />
2003 Enroll-<br />
Percent ment Percent<br />
2002 2003 <strong>of</strong> Change Change<br />
County County Total 2002 2002<br />
Enroll- Enroll- Enroll- to to<br />
County ment ment ment 2003 2003<br />
Adair 1,477 1,457 0.3% (21) -1.4%<br />
Adams 849 846 0.2 (3) -0.4<br />
Allamakee 2,593 2,502 0.5 (91) -3.5<br />
Appanoose 2,278 2,268 0.5 (10) -0.4<br />
Audubon 1,333 1,274 0.3 (59) -4.4<br />
Benton 5,119 5,065 1.0 (54) -1.1<br />
Black Hawk 17,474 17,592 3.6 118 0.7<br />
Boone 4,569 4,524 0.9 (45) -1.0<br />
Bremer 3,927 3,895 0.8 (32) -0.8<br />
Buchanan 3,819 3,532 0.7 (287) -7.5<br />
Buena Vista 3,522 3,553 0.7 31 0.9<br />
Butler 2,734 2,644 0.5 (91) -3.3<br />
Calhoun 1,867 1,820 0.4 (47) -2.5<br />
Carroll 3,154 3,076 0.6 (79) -2.5<br />
Cass 2,560 2,548 0.5 (12) -0.5<br />
Cedar 3,452 3,330 0.7 (122) -3.5<br />
Cerro Gordo 7,165 7,056 1.4 (109) -1.5<br />
Cherokee 2,384 2,263 0.5 (121) -5.1<br />
Chickasaw 2,266 2,232 0.5 (35) -1.5<br />
Clarke 1,770 1,748 0.4 (22) -1.3<br />
Clay 2,946 2,885 0.6 (62) -2.1<br />
Clayton 3,249 3,286 0.7 37 1.1<br />
Clinton 8,904 8,749 1.8 (155) -1.7<br />
Crawford 3,107 3,124 0.6 17 0.6<br />
Dallas 8,039 8,351 1.7 312 3.9<br />
Davis 1,323 1,271 0.3 (52) -3.9<br />
Decatur 1,348 1,348 0.3 -- 0.0<br />
Delaware 3,389 3,219 0.7 (170) -5.0<br />
Des Moines 6,979 6,825 1.4 (154) -2.2<br />
Dickinson 2,635 2,610 0.5 (25) -0.9<br />
Dubuque 11,890 12,096 2.5 206 1.7<br />
Emmet 1,857 1,816 0.4 (41) -2.2<br />
Fayette 3,875 3,973 0.8 98 2.5<br />
Floyd 2,856 2,779 0.6 (77) -2.7<br />
Franklin 1,934 1,918 0.4 (16) -0.8<br />
Fremont 1,495 1,487 0.3 (8) -0.6<br />
Greene 1,981 1,895 0.4 (86) -4.4<br />
Grundy 2,318 2,454 0.5 136 5.9<br />
Guthrie 1,976 1,930 0.4 (46) -2.3<br />
Hamilton 2,890 2,812 0.6 (78) -2.7<br />
Hancock 2,132 2,166 0.4 34 1.6<br />
Hardin 3,234 2,903 0.6 (331) -10.2<br />
Harrison 3,131 3,068 0.6 (63) -2.0<br />
Henry 3,522 3,501 0.7 (21) -0.6<br />
Howard 1,625 1,527 0.3 (98) -6.0<br />
Humboldt 1,814 1,737 0.4 (78) -4.3<br />
Ida 1,503 1,501 0.3 (2) -0.1<br />
<strong>Iowa</strong> 3,029 3,039 0.6 10 0.3<br />
Jackson 3,429 3,445 0.7 16 0.5<br />
Jasper 6,562 6,372 1.3 (190) -2.9<br />
2003 Enroll-<br />
Percent ment Percent<br />
2002 2003 <strong>of</strong> Change Change<br />
County County Total 2002 2002<br />
Enroll- Enroll- Enroll- to to<br />
County ment ment ment 2003 2003<br />
Jefferson 2,332 2,305 0.5% (27) -1.2%<br />
Johnson 14,244 14,324 2.9 80 0.6<br />
Jones 3,347 3,303 0.7 (44) -1.3<br />
Keokuk 2,156 2,134 0.4 (22) -1.0<br />
Kossuth 2,692 2,635 0.5 (57) -2.1<br />
Lee 5,927 5,903 1.2 (24) -0.4<br />
Linn 31,493 31,680 6.5 187 0.6<br />
Louisa 2,554 2,508 0.5 (46) -1.8<br />
Lucas 1,665 1,675 0.3 10 0.6<br />
Lyon 2,014 1,983 0.4 (31) -1.6<br />
Madison 2,760 2,765 0.6 5 0.2<br />
Mahaska 3,782 3,698 0.8 (84) -2.2<br />
Marion 5,543 5,555 1.1 12 0.2<br />
Marshall 7,078 7,503 1.5 425 6.0<br />
Mills 2,802 2,763 0.6 (40) -1.4<br />
Mitchell 1,875 1,835 0.4 (40) -2.1<br />
Monona 1,754 1,718 0.4 (36) -2.0<br />
Monroe 1,402 1,430 0.3 28 2.0<br />
Montgomery 2,107 2,070 0.4 (37) -1.7<br />
Muscatine 8,218 8,152 1.7 (66) -0.8<br />
O’Brien 2,437 2,328 0.5 (109) -4.5<br />
Osceola 1,244 1,264 0.3 20 1.6<br />
Page 2,656 2,607 0.5 (49) -1.9<br />
Palo Alto 1,617 1,546 0.3 (71) -4.4<br />
Plymouth 4,396 4,333 0.9 (63) -1.4<br />
Pocahontas 1,577 1,508 0.3 (69) -4.4<br />
Polk 63,584 64,341 13.2 757 1.2<br />
Pottawattamie 15,790 15,703 3.2 (87) -0.6<br />
Poweshiek 3,121 3,111 0.6 (10) -0.3<br />
Ringgold 941 886 0.2 (55) -5.9<br />
Sac 2,056 2,035 0.4 (22) -1.0<br />
Scott 27,500 27,436 5.6 (64) -0.2<br />
Shelby 2,362 2,331 0.5 (31) -1.3<br />
Sioux 4,238 4,214 0.9 (25) -0.6<br />
Story 10,521 10,423 2.1 (98) -0.9<br />
Tama 3,299 2,901 0.6 (398) -12.1<br />
Taylor 1,219 1,200 0.2 (19) -1.6<br />
Union 2,040 1,985 0.4 (55) -2.7<br />
Van Buren 1,296 1,320 0.3 24 1.9<br />
Wapello 6,084 6,087 1.2 3 0.0<br />
Warren 8,036 8,098 1.7 62 0.8<br />
Washington 3,620 3,644 0.7 24 0.7<br />
Wayne 1,197 1,162 0.2 (35) -2.9<br />
Webster 6,048 5,943 1.2 (105) -1.7<br />
Winnebago 2,214 2,194 0.5 (21) -0.9<br />
Winneshiek 3,114 3,127 0.6 13 0.4<br />
Woodbury 18,256 18,129 3.7 (127) -0.7<br />
Worth 1,343 1,331 0.3 (12) -0.9<br />
Wright 2,688 2,591 0.5 (97) -3.6<br />
Total 489,523 487,021 100.0 (2,502) -0.5<br />
Elementary/Secondary<br />
Enrollment<br />
Source:<br />
<strong>Iowa</strong> Department <strong>of</strong> Education, Division <strong>of</strong> Financial and Information Services, Certified Enrollment<br />
Files.<br />
47
Thirty-four counties reported no nonpublic enrollments during the 2002-2003 school year.<br />
Sioux county had the largest percentage <strong>of</strong> nonpublic enrollment compared to total enrollment<br />
at 37.4 percent. Sioux, Dubuque, Carroll, and Kossuth counties each had over 20.0 percent<br />
<strong>of</strong> nonpublic enrollment compared to total enrollment. Figure 9 shows the nonpublic<br />
enrollment comparison to total enrollment by county.<br />
Figure 9<br />
K-12 NONPUBLIC BEDS ENROLLMENTS BY COUNTY<br />
2002-2003<br />
Kossuth<br />
Sioux<br />
Dubuque<br />
Carroll<br />
Source:<br />
<strong>Iowa</strong> Department <strong>of</strong> Education, Bureau <strong>of</strong> Planning, Research, and Evaluation, Basic Educational<br />
Data Survey, Enrollment File.<br />
Racial/Ethnic Distribution <strong>of</strong> Students<br />
Changes in the racial makeup <strong>of</strong> the total population can also been seen in the racial/ethnic<br />
distribution <strong>of</strong> <strong>Iowa</strong> students. The number <strong>of</strong> immigrants coming to <strong>Iowa</strong> reached the highest<br />
point in 14 years during 2001 (see Figure 9B in Background Demographics). The number<br />
<strong>of</strong> Hispanic students continued to increase. During the 2002-2003 school year, Hispanic<br />
students were the largest minority group accounting for 4.4 percent <strong>of</strong> the public PK-12 total<br />
enrollments and have increased by 425.3 percent since the 1985-1986 school year<br />
(see Table 16). African American students which had previously been the largest minority<br />
group increased slightly from the 2001-2002 school year but were second among the<br />
nonwhite racial/ethnic groups. Whites accounted for 89.0 percent <strong>of</strong> the public school PK-<br />
12 total enrollments, down slightly from the 2001-2002 school year.<br />
48
Table 16<br />
IOWA PUBLIC SCHOOL PK-12 ENROLLMENTS BY RACIAL/ETHNIC GROUP<br />
1985-1986, 2001-2002 AND 2002-2003<br />
%Change %Change<br />
2001-2002 1985-1986<br />
Racial/ 1985-1986 2001-2002 2002-2003 to to<br />
Ethnic Group N % N % N % 2002-2003 2002-2003<br />
American Indian 1,090 0.2% 2,659 0.5% 2,635 0.5% -0.9% 141.7%<br />
Hispanic 4,069 0.8 19,596 4.0 21,375 4.4 9.1 425.3<br />
Asian American 5,310 1.1 8,366 1.7 8,547 1.8 2.2 61.0<br />
African American 12,308 2.5 20,230 4.1 20,629 4.3 2.0 67.6<br />
White 462,555 95.3 438,881 89.6 429,024 89.0 -2.2 -7.2<br />
Total* 485,332 100.0 489,732 100.0 482,210 100.0 -1.5 -0.6<br />
Source:<br />
Notes:<br />
<strong>Iowa</strong> Department <strong>of</strong> Education, Bureau <strong>of</strong> Planning, Research, and Evaluation, Basic Educational<br />
Data Survey, Enrollment Files.<br />
Includes PK through grade 12 and ungraded special education students.<br />
*Figures may not total 100 percent due to rounding.<br />
Elementary/Secondary<br />
Enrollment<br />
White students accounted for 94.5 percent <strong>of</strong> the nonpublic PK-12 total enrollment in 2002-<br />
2003 (Table 17). Hispanic at 2.4 percent was the largest non-white racial/ethnic group while<br />
Asian American was the second largest with 1.6 percent <strong>of</strong> the total enrollment in 2002-2003.<br />
All nonwhite groups have increased by over 85.0 percent since the 1985-1986 school year.<br />
Table 17<br />
IOWA NONPUBLIC SCHOOL PK-12 ENROLLMENTS BY RACIAL/ETHNIC GROUP<br />
1985-1986, 2001-2002 AND 2002-2003<br />
%Change %Change<br />
2001-2002 1985-1986<br />
Racial/ 1985-1986 2001-2002 2002-2003 to to<br />
Ethnic Group N % N % N % 2002-2003 2002-2003<br />
American Indian 42 0.1% 82 0.2% 78 0.2% -4.9% 85.7%<br />
Hispanic 527 1.1 951 2.2 978 2.4 2.8 85.6<br />
Asian American 344 0.7 615 1.4 659 1.6 7.2 91.6<br />
African American 273 0.6 551 1.3 554 1.3 0.5 102.9<br />
White 48,372 97.6 40,220 94.8 39,242 94.5 -2.4 -18.9<br />
Total* 49,558 100.0 42,419 100.0 41,511 100.0 -2.1 -16.2<br />
Source:<br />
Notes:<br />
<strong>Iowa</strong> Department <strong>of</strong> Education, Bureau <strong>of</strong> Planning, Research, and Evaluation, Basic Educational<br />
Data Survey, Enrollment Files.<br />
Includes PK through grade 12 students.<br />
*Figures may not total 100 percent due to rounding.<br />
Nationally the percentage <strong>of</strong> minority enrollments was 38.8 percent in 2000, up from 29.6<br />
percent in 1986 (Table 18). The largest increase in the minority enrollments occurred in the<br />
Hispanic race/ethnicity group, which increased 6.4 percentage points between 1986 and 2000.<br />
In 2000, Hispanics accounted for over 40.0 percent <strong>of</strong> the student population in California,<br />
New Mexico, and Texas. The African American race/ethnicity group remains the largest<br />
minority group at 17.2 percent <strong>of</strong> total enrollment in 2000, up from 16.1 percent in 1986. Five<br />
states including <strong>Iowa</strong> had over 90.0 percent <strong>of</strong> the total enrollment in the White race ethnicity<br />
group.<br />
49
Table 18<br />
ENROLLMENT IN PUBLIC ELEMENTARY AND SECONDARY SCHOOLS,<br />
BY RACE/ETHNICITY AND STATE: FALL 1986 AND FALL 2000<br />
Percent Distribution<br />
fall 1986<br />
Percent Distribution<br />
fall 2000<br />
Minority<br />
Ameri- %tage point<br />
Total Total African can change<br />
<strong>State</strong> or other area White 1 Minority White 1 Minority American Hispanic Asian Indian 1986 to 2000<br />
United <strong>State</strong>s ................... 70.4 29.6 61.2 38.8 17.2 16.3 4.1 1.2 31.1<br />
Alabama .............................. 62.0 38.0 60.8 39.2 36.5 1.3 0.7 0.7 3.2<br />
Alaska .................................. 65.7 34.3 61.5 38.5 4.6 3.4 5.5 25.0 11.9<br />
Arizona ................................ 62.2 37.8 52.8 47.2 4.6 33.9 2.1 6.6 24.9<br />
Arkansas .............................. 74.7 25.3 71.7 28.3 23.3 3.6 0.9 0.5 11.4<br />
California ............................ 53.7 46.3 36.1 63.9 8.5 43.4 11.1 0.9 38.0<br />
Colorado .............................. 78.7 21.3 68.2 31.8 5.7 22.0 2.9 1.2 50.0<br />
Connecticut ......................... 77.2 22.8 70.1 29.9 13.7 13.1 2.8 0.3 31.7<br />
Delaware ............................. 68.3 31.7 60.7 39.3 30.8 6.0 2.3 0.3 23.9<br />
District <strong>of</strong> Columbia ........... 4.0 96.0 4.5 95.5 84.6 9.2 1.6 0.1 -0.5<br />
Florida ................................. 65.4 34.6 53.3 46.7 25.2 19.4 1.9 0.3 35.3<br />
Georgia ................................ 60.7 39.3 54.7 45.3 38.2 4.8 2.2 0.2 15.5<br />
Hawaii ................................. 23.5 76.5 20.4 79.6 2.3 4.5 72.3 0.4 3.9<br />
Idaho .................................... 92.6 7.4 86.0 14.0 0.7 10.7 1.2 1.4 91.8<br />
Illinois ................................. 69.8 30.2 59.8 40.2 21.3 15.4 3.4 0.2 33.0<br />
Indiana ................................. 88.7 11.3 83.6 16.4 11.7 3.5 1.0 0.2 45.1<br />
<strong>Iowa</strong> .................................... 94.6 5.4 90.2 9.8 4.0 3.6 1.7 0.5 81.5<br />
Kansas ................................. 85.6 14.4 78.7 21.3 8.9 8.9 2.2 1.3 46.9<br />
Kentucky ............................. 89.2 10.8 87.5 12.5 10.7 1.0 0.6 0.2 15.7<br />
Louisiana ............................. 56.5 43.5 48.9 51.1 47.8 1.4 1.3 0.6 17.5<br />
Maine ................................... 98.3 1.7 96.5 3.5 1.2 0.6 1.0 0.7 105.9<br />
Maryland ............................. 59.7 40.3 53.4 46.6 37.1 4.8 4.4 0.4 15.9<br />
Massachusetts ..................... 83.7 16.3 76.1 23.9 8.5 10.7 4.4 0.3 46.6<br />
Michigan ............................. 76.4 23.6 73.8 26.2 19.8 3.5 1.8 1.0 10.6<br />
Minnesota ............................ 93.9 6.1 82.9 17.1 6.6 3.4 5.1 2.0 175.8<br />
Mississippi .......................... 43.9 56.1 47.3 52.7 51.1 0.8 0.7 0.1 -6.1<br />
Missouri ............................... 83.4 16.6 79.3 20.7 17.4 1.8 1.2 0.3 24.7<br />
Montana .............................. 92.7 7.3 86.2 13.8 0.6 1.7 1.0 10.5 91.7<br />
Nebraska .............................. 91.4 8.6 83.0 17.0 6.7 7.3 1.5 1.5 97.7<br />
Nevada ................................. 77.4 22.6 56.7 43.3 10.2 25.7 5.7 1.7 91.6<br />
New Hampshire .................. 98.0 2.0 95.5 4.5 1.1 1.8 1.3 0.2 109.5<br />
New Jersey .......................... 69.1 30.9 60.3 39.7 17.8 15.3 6.3 0.2 28.2<br />
New Mexico ........................ 43.1 56.9 35.3 64.7 2.4 50.2 1.1 11.1 13.9<br />
New York ............................ 68.4 31.6 54.9 45.1 20.2 18.5 6.0 0.4 46.3<br />
North Carolina .................... 68.4 31.6 61.0 39.0 31.3 4.4 1.9 1.5 23.7<br />
North Dakota ....................... 92.4 7.6 89.4 10.6 1.0 1.2 0.8 7.6 41.3<br />
Ohio ..................................... 83.1 16.9 80.7 19.3 16.3 1.7 1.1 0.1 14.3<br />
Oklahoma ............................ 79.0 21.0 64.9 35.1 10.8 6.0 1.4 16.9 67.1<br />
Oregon ................................. 89.8 10.2 80.4 19.6 2.9 10.5 4.0 2.1 91.2<br />
Pennsylvania ....................... 84.4 15.6 78.2 21.8 15.1 4.5 2.0 0.1 38.2<br />
Rhode Island ....................... 87.9 12.1 74.3 25.7 7.9 14.0 3.3 0.5 114.2<br />
South Carolina .................... 54.6 45.4 54.9 45.1 42.1 1.9 1.0 0.2 -0.4<br />
South Dakota ....................... 90.6 9.4 86.5 13.5 1.2 1.2 0.9 10.1 42.6<br />
Tennessee ............................ 76.5 23.5 72.4 27.6 24.5 1.8 1.1 0.2 17.9<br />
Texas ................................... 51.0 49.0 42.0 58.0 14.4 40.6 2.7 0.3 18.1<br />
Utah ..................................... 93.7 6.3 85.9 14.1 1.0 8.8 2.7 1.6 120.3<br />
Vermont ............................... 98.4 1.6 96.3 3.7 1.1 0.6 1.4 0.6 117.6<br />
Virginia ............................... 72.6 27.4 63.6 36.4 27.1 4.9 4.1 0.3 32.3<br />
Washington ......................... 84.5 15.5 74.4 25.6 5.3 10.2 7.3 2.7 65.6<br />
West Virginia ...................... 95.9 4.1 94.7 5.3 4.3 0.4 0.5 0.1 29.3<br />
Wisconsin ............................ 86.6 13.4 80.7 19.3 10.0 4.5 3.3 1.4 42.2<br />
Wyoming ............................. 90.7 9.3 87.9 12.1 1.2 6.9 0.9 3.1 30.1<br />
Other Areas<br />
American Samoa ................. — — 0.0 — 0.0 0.0 100.0 - —<br />
Guam ................................... — — 1.7 98.3 0.3 0.2 97.7 0.1 —<br />
Northern Marianas .............. — — 0.3 99.7 0.0 0.0 99.7 0.0 —<br />
Puerto Rico .......................... — — 0.0 — 0.0 100.0 0.0 0.0 —<br />
Virgin Islands ...................... — — 0.8 99.2 85.8 13.1 0.2 0.1 —<br />
50<br />
Source: U.S. Department <strong>of</strong> Education, Digest <strong>of</strong> Education Statistics, 2002.<br />
Notes: 1<br />
Excludes persons <strong>of</strong> Hispanic origin.<br />
—Data not available.<br />
The 1986-87 data were derived from the 1986 Elementary and Secondary School Civil Rights<br />
sample survey <strong>of</strong> public school districts. Because <strong>of</strong> rounding, details may not add to totals.
Weighted English Language Learners and<br />
Total English Language Learners<br />
The increase in immigrants in <strong>Iowa</strong> has led to an increase in languages spoken in the state.<br />
This is reflected in school districts as well. English Language Learners (ELL), also referred<br />
to as Limited English Pr<strong>of</strong>icient (LEP), have increased substantially in the last ten years.<br />
The Code <strong>of</strong> <strong>Iowa</strong>, Chapter 280.4, defines limited English pr<strong>of</strong>icient students as follows: “a<br />
student’s language background is in a language other than English, and the student’s<br />
pr<strong>of</strong>iciency in English is such that the probability <strong>of</strong> the student’s academic success in an<br />
English-only classroom is below that <strong>of</strong> an academically successful peer with an English<br />
language background”.<br />
Two types <strong>of</strong> ELL students are reported. Eligible ELL students receive a weighting <strong>of</strong> 0.22<br />
for purposes <strong>of</strong> school foundation funding. School districts may receive additional funding<br />
for these weighted ELL students for three years. The other type <strong>of</strong> ELL students include any<br />
public or nonpublic PK-12 ELL students who no longer qualify for additional funding for<br />
their school district because they have exceeded the three-year limit.<br />
Weighted English Language Learners<br />
Elementary/Secondary<br />
Enrollment<br />
<strong>State</strong>wide the number <strong>of</strong> weighted ELL students has increased 1.6 percent between 2001-<br />
2002 and 2002-2003 and 139.5 percent between 1993-1994 and 2002-2003. All enrollment<br />
categories except the less than 250 category had increases <strong>of</strong> over 100.0 percent since the<br />
1993-1994 school year. Between 2001-2002 and 2002-2003, only the 1,000-2,499 had a<br />
decrease in weighted ELL students. The percent <strong>of</strong> weighted ELL enrollment to basic<br />
enrollment has increased from 0.8 percent in 1993-1994 to 1.9 percent in 2002-2003 (see<br />
Table 19).<br />
Table 19<br />
DISTRIBUTION OF IOWA WEIGHTED ENGLISH LANGUAGE LEARNERS 1<br />
BY ENROLLMENT CATEGORY<br />
1993-1994, 2001-2002 AND 2002-2003<br />
1993-1994 2001-2002 2002-2003<br />
Percent Change in<br />
Weighted LEP Enrollment<br />
Weighted Weighted Weighted 2001-2002 1993-1994<br />
Enrollment Basic ELL Basic ELL Basic ELL to to<br />
Category Enrollment Enrollment Enrollment Enrollment Enrollment Enrollment 2002-2003 2002-2003<br />
Total English Language Learners<br />
Figure 10 provides yearly totals for <strong>Iowa</strong> public and nonpublic total English language<br />
learners from 1986 to 2003. The total ELL weighting increased 1.0 percent between 2001-<br />
2002 and 2002-2003 and 331.6 percent since 1986. The 2002-2003 increase <strong>of</strong> 135 was the<br />
smallest annual increase since 1988.<br />
Figure 10<br />
PK-12 ENROLLMENTS OF TOTAL ENGLISH LANGUAGE LEARNERS<br />
IOWA PUBLIC AND NONPUBLIC STUDENTS<br />
1985-1986 TO 2002-2003<br />
14,000<br />
13,460<br />
13,595<br />
Number <strong>of</strong> Students<br />
13,000<br />
12,000<br />
11,000<br />
10,000<br />
9,000<br />
8,000<br />
7,000<br />
6,000<br />
5,000<br />
4,000<br />
3,000<br />
3,150<br />
2,932<br />
2,669<br />
3,119<br />
3,529<br />
3,725<br />
4,240<br />
4,419<br />
4,744<br />
5,629<br />
6,846<br />
7,474<br />
8,193<br />
9,160<br />
10,310<br />
11,436<br />
2,000<br />
1,000<br />
0<br />
1986<br />
1987<br />
1988<br />
1989<br />
1990<br />
1991<br />
1992<br />
1993<br />
1994<br />
1995<br />
1996<br />
1997<br />
1998<br />
1999<br />
2000<br />
2001<br />
2002<br />
2003<br />
Year Ending<br />
Source:<br />
<strong>Iowa</strong> Department <strong>of</strong> Education, Bureau <strong>of</strong> Planning, Research, and Evaluation, Basic Educational<br />
Data Survey, English Language Learners Student File.<br />
During the 2002-2003 school year, over 80 languages were represented as the primary<br />
language for all the ELL students in the state. Spanish accounted for 71.2 percent <strong>of</strong> the ELL<br />
total in 2002-2003, up from 67.1 percent the previous school year. Bosnian and Vietnamese<br />
were at 8.1 percent and 5.1 percent <strong>of</strong> the ELL total respectively. Russian showed a 75.5<br />
percent increase from 2001-2002 to 2002-2003 going from 53 ELL students to 93. Information<br />
detailing all the ELL primary languages for PK-12 public and nonpublic students is provided<br />
in Table 20.<br />
52
Table 20<br />
% <strong>of</strong> Total ELL<br />
Language 1985-1986 1999-2000 2000-2001 2001-2002 2002-2003 Students 2002-2003<br />
Spanish 807 6,187 7,128 9,038 9,679 71.2%<br />
Bosnian 0 283 369 1,114 1,105 8.1<br />
Vietnamese 439 760 768 726 697 5.1<br />
Serbo-Croatian 0 979 556 540 465 3.4<br />
Laotian; Pha Xa Lao 548 400 411 433 424 3.1<br />
Arabic 26 75 82 158 169 1.2<br />
German 24 206 153 119 113 0.8<br />
Russian 0 68 65 53 93 0.7<br />
Chinese; Zhongwen 89 108 80 93 88 0.6<br />
Cambodian; Khmer 239 99 101 105 86 0.6<br />
Hmong 101 46 29 31 52 0.4<br />
Korean; Choson-O 136 96 76 73 51 0.4<br />
French 20 21 31 50 49 0.4<br />
Croatian; Hrvatski 0 7 10 33 37 0.3<br />
Japanese; Nihongo 0 31 40 40 35 0.3<br />
Thai 333 19 23 13 34 0.3<br />
Albanian; Shqip 0 34 44 38 32 0.2<br />
Somali 0 26 28 30 32 0.2<br />
Swahili 0 16 22 27 30 0.2<br />
Persian; Farsi 0 4 4 5 24 0.2<br />
Hindi 0 20 6 11 19 0.1<br />
Sundanese 0 8 13 34 19 0.1<br />
Ukrainian 0 19 15 18 19 0.1<br />
Thai Dam 0 0 142 0 12 0.1<br />
Kirghiz; Kyrgyz 0 0 0 3 11 0.1<br />
Tagalog 0 9 4 9 11 0.1<br />
Urdu 0 7 8 3 11 0.1<br />
Hebrew; Iwrith 0 4 1 0 10 0.1<br />
Nuer 0 104 6 13 10 0.1<br />
Serbian; Srpski 0 6 434 13 9 0.1<br />
Amharic 0 2 5 10 8 0.1<br />
Faroese 0 0 1 0 8 0.1<br />
Oriya 0 0 0 0 8 0.1<br />
Portuguese 0 11 10 11 8 0.1<br />
Punjabi; Panjabi 0 14 10 3 8 0.1<br />
Tibetan; Bodskad 0 1 5 6 8 0.1<br />
Afrikaans 0 5 3 18 7
Open Enrollment<br />
Open enrollment for public students is provided under <strong>Iowa</strong> Code 282.18. Parents may enroll<br />
their children in a district outside <strong>of</strong> the district in which they reside. The Open Enrollment<br />
Act was implemented during the 1989-1990 school year and states: “It is the goal <strong>of</strong> the<br />
general assembly to permit a wide range <strong>of</strong> educational choices for children enrolled in<br />
schools in this state and to maximize ability to use those choices.It is therefore the intent that<br />
this section be construed broadly to maximize parental choice and access to educational<br />
opportunities which are not available to children because <strong>of</strong> where they live.<br />
For the school year commencing July 1, 1989, and each succeeding school year, a parent or<br />
guardian residing in a school district may enroll the parent’s or guardian’s child in a public<br />
school in another school district in the manner provided in this section.”<br />
The number <strong>of</strong> open enrolled students has increased every year since the legislation was<br />
enacted. During the 2002-2003 school year, 4.2 percent <strong>of</strong> the total enrollment was open<br />
enrolled, up from 3.97 percent the previous school year. The total number <strong>of</strong> open enrolled<br />
students topped 20,000 for the first time in 2002-2003 (Table 21 and Figure 11).<br />
Table 21<br />
NUMBER OF OPEN ENROLLED IOWA<br />
K-12 PUBLIC STUDENTS<br />
1990-1991 THROUGH 2002-2003<br />
Open Enrolled<br />
Number <strong>of</strong><br />
Students as a<br />
Students Total Certified Percent <strong>of</strong> Total<br />
Year Open Enrolled Enrollment Enrollment<br />
1990-1991 2,757 483,399 0.6%<br />
1991-1992 5,227 491,451 1.1<br />
1992-1993 7,427 495,342 1.5<br />
1993-1994 9,330 497,009 1.9<br />
1994-1995 10,860 500,592 2.2<br />
1995-1996 12,502 504,505 2.5<br />
1996-1997 13,959 505,523 2.8<br />
1997-1998 15,220 505,130 3.0<br />
1998-1999 16,130 502,534 3.2<br />
1999-2000 17,169 498,607 3.4<br />
2000-2001 18,554 494,291 3.8<br />
2001-2002 19,436 489,523 4.0<br />
2002-2003 20,471 487,021 4.2<br />
Source:<br />
<strong>Iowa</strong> Department <strong>of</strong> Education, Division <strong>of</strong> Financial and Information Services, Certified Enrollment<br />
Files.<br />
54
Figure 11<br />
Number <strong>of</strong> Students<br />
30,000<br />
25,000<br />
20,000<br />
15,000<br />
10,000<br />
5,000<br />
2,757<br />
5,227<br />
IOWA OPEN ENROLLMENT TREND<br />
1990-1991 THROUGH 2002-2003<br />
7,427<br />
9,330<br />
10,860<br />
12,502<br />
13,959<br />
15,220<br />
16,130<br />
17,169<br />
18,554<br />
19,436<br />
20,471<br />
Elementary/Secondary<br />
Enrollment<br />
0<br />
1991 1992 1993 1994 1995 1996 1997 1998 1999 2000 2001 2002 2003<br />
Year Ending<br />
Source:<br />
<strong>Iowa</strong> Department <strong>of</strong> Education, Division <strong>of</strong> Financial and Information Services, Certified Enrollment<br />
Files.<br />
Table 22 provides data on the net enrollment change by enrollment category. The 1,000-2,499<br />
enrollment category continued to have the largest net open enrollment change among all the<br />
enrollment categories. As in previous years, open enrollment results in a net loss in the two<br />
smallest enrollment categories (less than 250 and 250-399) and the largest enrollment<br />
category (7,500+).<br />
Table 22<br />
NET OPEN ENROLLMENT CHANGE IN IOWA PUBLIC SCHOOLS<br />
BY ENROLLMENT CATEGORY<br />
1990-1991 AND 1997-1998 TO 2002-2003<br />
Net Enrollment Change<br />
Number <strong>of</strong><br />
Students<br />
Open Enrolled<br />
Enrollment 1990- 1997- 1998- 1999- 2000- 2001- 2002- 2002-<br />
Category 1991 1998 1999 2000 2001 2002 2003 2003<br />
Special Education Enrollment<br />
Special education and children requiring special education are defined in <strong>Iowa</strong> Code 256B.2.<br />
The Code definition <strong>of</strong> children requiring special education states: “persons under twentyone<br />
years <strong>of</strong> age, including children under five years <strong>of</strong> age, who have a disability in obtaining<br />
an education because <strong>of</strong> a head injury, autism, behavioral disorder, or physical, mental,<br />
communication, or learning disability, as defined by the rules <strong>of</strong> the department <strong>of</strong> education.”<br />
Special education is defined as: “classroom, home, hospital, institutional, or other instruction<br />
designed to meet the needs <strong>of</strong> children requiring special education…”<br />
Table 23 details two trends that continued for special education enrollments during the 2002-<br />
2003 school year. Total special education enrollment continued to increase, up 1.0 percent<br />
from the 2001-2002 school year. Also, special education enrollment as a percentage <strong>of</strong> total<br />
certified enrollment continued to increase moving from 13.1 percent in 2001-2002 to 13.3<br />
percent in 2002-2003. Figure 12 shows the upward trend in special education as a percentage<br />
<strong>of</strong> certified enrollment since the year ending 1986.<br />
Table 23<br />
SPECIAL EDUCATION ENROLLMENT IN IOWA PUBLIC SCHOOLS<br />
1985-1986 THROUGH 2002-2003<br />
Annual % Special Annual % Special Ed.<br />
Certified Change in Education Change in Enrollment as a<br />
Year Enrollment Cert. Enrollment Enrollment Spec. Ed. Enrollment % <strong>of</strong> Cert. Enr.<br />
1985-1986 485,332 — 41,892 — 8.6%<br />
1986-1987 481,205 -0.9% 42,360 1.1% 8.8<br />
1987-1988 478,859 -0.5 42,625 0.6 8.9<br />
1988-1989 476,771 -0.4 43,290 1.6 9.1<br />
1989-1990 478,210 0.3 44,585 3.0 9.3<br />
1990-1991 483,399 1.1 46,593 4.5 9.6<br />
1991-1992 491,451 1.7 48,201 3.5 9.8<br />
1992-1993 495,342 0.8 49,848 3.4 10.1<br />
1993-1994 497,009 0.3 51,022 2.4 10.3<br />
1994-1995 500,592 0.7 53,151 4.2 10.6<br />
1995-1996 504,505 0.8 55,514 4.5 11.0<br />
1996-1997 505,523 0.2 57,845 4.2 11.4<br />
1997-1998 505,130 -0.1 59,711 3.2 11.8<br />
1998-1999 502,534 -0.5 61,079 2.3 12.2<br />
1999-2000 498,607 -0.8 62,536 2.4 12.5<br />
2000-2001 494,291 -0.9 63,392 1.4 12.8<br />
2001-2002 489,523 -1.0 64,044 1.0 13.1<br />
2002-2003 487,021 -0.5 64,700 1.0 13.3<br />
Sources: <strong>Iowa</strong> Department <strong>of</strong> Education, Division <strong>of</strong> Financial and Information Services, Certified<br />
Enrollment Files and Division <strong>of</strong> Early Childhood, Elementary, and Secondary<br />
Education, Bureau <strong>of</strong> Children, Family, and Community Services, December 1 Special<br />
Education Files.<br />
56
Figure 12<br />
SPECIAL EDUCATION ENROLLMENT IN IOWA PUBLIC SCHOOLS<br />
Percent<br />
100<br />
AS A PERCENT OF TOTAL CERTIFIED ENROLLMENT<br />
1985-1986 THROUGH 2002-2003<br />
90<br />
80<br />
70<br />
60<br />
50<br />
40<br />
30<br />
20<br />
10<br />
8.6<br />
8.8<br />
8.9<br />
9.1<br />
9.3<br />
9.6<br />
9.8<br />
10.1<br />
10.3<br />
10.6<br />
11.0<br />
11.4<br />
11.8<br />
12.2<br />
12.5<br />
12.8<br />
13.1<br />
13.3<br />
Elementary/Secondary<br />
Enrollment<br />
0<br />
86 87 88 89 90 91 92 93 94 95 96 97 98 99 00 01 02 03<br />
Year Ending<br />
Sources: <strong>Iowa</strong> Department <strong>of</strong> Education, Division <strong>of</strong> Financial and Information Services, Certified Enrollment<br />
Files, and Division <strong>of</strong> Early Childhood, Elementary, and Secondary Education, Bureau <strong>of</strong> Children<br />
Family, and Community Services, December 1 Special Education Files.<br />
57
STAFF<br />
In this section, data on licensed staff for <strong>Iowa</strong>’s schools for the 2002-2003 school year and the<br />
1985-1986 base year are presented. Summaries <strong>of</strong> the data are presented on the state level as<br />
well as by enrollment categories and area education agency. National and regional state<br />
comparative data are also presented when available. The data includes characteristics <strong>of</strong> staff<br />
such as age, race/ethnicity, gender, experience, and salary. Data are presented for teachers,<br />
principals, superintendents, other licensed positions, and some non-licensed staff. The<br />
number <strong>of</strong> instructional aides and pupil-teacher ratios for public schools are also included.<br />
Teacher Characteristics<br />
At the beginning <strong>of</strong> each school year, information on licensed staff is collected from schools<br />
through the Licensed Staff Detail report on the Basic Educational Data Survey (BEDS). A<br />
maximum <strong>of</strong> ten position assignments may be reported to accurately reflect the duties <strong>of</strong> the<br />
staff. Data on full-time teachers is presented in this section. Full-time teachers are defined as<br />
staff who reported a position code <strong>of</strong> teacher for at least one <strong>of</strong> their positions, have a full-time<br />
contract, have a regular salary <strong>of</strong> at least $24,500 and have at least 180 contract days. A total<br />
<strong>of</strong> 5,468 teachers reported serving in other positions, such as administrative and student<br />
support services in 2002-2003. These additional duties may impact their reported salary since<br />
salary is not reported separately for each additional position.<br />
Elementary/Secondary<br />
An overview <strong>of</strong> <strong>Iowa</strong> full-time teachers in public and nonpublic schools is presented in<br />
Table 24. There is not a great difference in the change in characteristics between 2001-2002<br />
and 2002-2003 for both public and nonpublic teachers. When 2002-2003 is compared with<br />
1985-1986 the data show that the average age and experience <strong>of</strong> teachers has increased. The<br />
average age <strong>of</strong> full-time public school teachers was 2.5 years greater with an additional 1.2<br />
years <strong>of</strong> total experience in 2002-2003. The percentage <strong>of</strong> females increased from 63.5 percent<br />
to 71.5 percent. The percentage <strong>of</strong> minority teachers remains small, at 1.8 percent in 2002-<br />
2003. The percentage <strong>of</strong> teachers with advanced degrees has decreased since 1985-1986.<br />
Twenty-nine percent <strong>of</strong> public school teachers had advanced degrees in 1985-1986 while 26.7<br />
percent had advanced degrees in 2002-2003.<br />
Trends in the nonpublic school teacher data are similar to the public school teacher data. There<br />
were no significant differences between 2001-2002 and 2002-2003 teacher characteristics for<br />
nonpublic full-time teachers. The average age increased from 36.6 to 41.0 and the average<br />
total experience increased from 11.5 to 13.0 between 1985-1986 and 2002-2003. The percent<br />
<strong>of</strong> full-time female teachers continued to be larger for nonpublic schools than public schools,<br />
80.3 percent compared with 71.5 percent. There was a smaller percent <strong>of</strong> full-time minority<br />
teachers in nonpublic schools than public schools. Minorities accounted for 0.6 percent <strong>of</strong> the<br />
full-time teachers in nonpublic schools and 1.8 percent in public schools.<br />
Table 25 reports the number <strong>of</strong> full-time teachers, the percent with advanced degrees, the<br />
percent females, the percent minority, the average total years <strong>of</strong> experience, the average years<br />
<strong>of</strong> district experience, and the average age <strong>of</strong> full-time public school teachers in 2002-2003<br />
by enrollment category. The districts in the smallest enrollment category had the smallest<br />
percent <strong>of</strong> teachers with advanced degrees, 9.5 percent, while districts in the largest<br />
enrollment category had the largest percent <strong>of</strong> teachers with advanced degrees, 37.6 percent.<br />
The percent <strong>of</strong> minority teachers differed from enrollment category to enrollment category.<br />
The 400-599 enrollment category had the smallest percent <strong>of</strong> minority teachers with 0.5<br />
percent. The 7,500+ enrollment category had the largest percent <strong>of</strong> minority teachers with 4.3<br />
percent.<br />
Staff<br />
59
Table 24<br />
CHARACTERISTICS OF IOWA FULL-TIME TEACHERS<br />
1985-86, 2001-2002 AND 2002-2003<br />
Public Nonpublic<br />
1985- 2001- 2002- 1985- 2001- 2002-<br />
Characteristics 1986 2002 2003 1986 2002 2003<br />
Average Age 39.9 42.3 42.4 36.6 40.9 41.0<br />
Percent Female 63.5% 71.1% 71.5% 77.5% 80.9% 80.3%<br />
Percent Minority 1.2% 1.7% 1.8% 0.5% 0.6% 0.6%<br />
Percent Advanced Degree 29.0% 26.8% 26.7% 16.0% 13.9% 14.3%<br />
Average Total Experience 13.9 15.0 15.1 11.5 12.7 13.0<br />
Average District Experience 10.6 11.8 11.9 5.7 9.0 9.4<br />
Number <strong>of</strong> Full-Time Teachers 30,499 33,878 33,425 2,419 2,466 2,456<br />
Source:<br />
Note:<br />
<strong>Iowa</strong> Department <strong>of</strong> Education, Bureau <strong>of</strong> Planning, Research, and Evaluation, Basic Educational Data<br />
Survey, Staff Files.<br />
Includes AEA teachers.<br />
Table 25<br />
ADVANCED DEGREE AND EXPERIENCE OF IOWA FULL-TIME<br />
PUBLIC SCHOOL TEACHERS BY ENROLLMENT CATEGORY<br />
2002-2003<br />
Number <strong>of</strong> Percent with Average Avg. Years<br />
Enrollment Full-Time Advanced Percent Percent Years Total District Average<br />
Category Teachers Degree Females Minority Experience Experience Age<br />
Teacher Age and Experience<br />
The number <strong>of</strong> full-time public school teachers broken down by age category for 1992-1993<br />
and 2002-2003 is presented in Table 26 and Figure 13. The distribution <strong>of</strong> teachers in age<br />
categories has changed in the past ten years. The percentage <strong>of</strong> teachers age 35 and younger<br />
increased from 26.8 percent to 30.9 percent and the percentage <strong>of</strong> those age 46-55 also<br />
increased. The percentage <strong>of</strong> teachers age 36-45 decreased from 38.2 percent in 1992-1993<br />
to 33.5 percent in 2002-2003 while the percentage <strong>of</strong> teachers age 56 and older decreased<br />
slightly (9.7 percent in 1992-1993 versus 9.3 percent in 2002-2003).<br />
Table 26<br />
IOWA FULL-TIME PUBLIC SCHOOL TEACHER AGE DISTRIBUTIONS<br />
1992-1993 AND 2002-2003<br />
1992-1993 2002-2003<br />
Cumulative Cumulative Cumulative Cumulative<br />
Age Interval Number Total Percent Percent Number Total Percent Percent<br />
Elementary/Secondary<br />
25 and Under 1,614 1,614 5.3% 5.3% 2,458 2,458 7.4% 7.4%<br />
26-30 3,152 4,766 10.4 15.8 3,876 6,334 11.6 18.9<br />
31-35 3,355 8,121 11.1 26.8 3,980 10,314 11.9 30.9<br />
36-40 4,909 13,030 16.2 43.1 3,655 13,969 10.9 41.8<br />
41-45 6,665 19,695 22.0 65.1 4,223 18,192 12.6 54.4<br />
46-50 4,329 24,024 14.3 79.4 5,481 23,673 16.4 70.8<br />
51-55 3,283 27,307 10.9 90.3 6,657 30,330 19.9 90.7<br />
56-60 2,234 29,541 7.4 97.7 2,503 32,833 7.5 98.2<br />
61-65 640 30,181 2.1 99.8 534 33,367 1.6 99.8<br />
Over 65 70 30,251 0.2 100.0 58 33,425 0.2 100.0<br />
Source:<br />
Note:<br />
<strong>Iowa</strong> Department <strong>of</strong> Education, Bureau <strong>of</strong> Planning, Research, and Evaluation, Basic Educational Data<br />
Survey, Staff Files.<br />
Includes AEA teachers.<br />
Staff<br />
61
Figure 13<br />
IOWA FULL-TIME PUBLIC SCHOOL TEACHER AGE DISTRIBUTIONS<br />
1992-1993 AND 2002-2003<br />
7,000<br />
6,000<br />
5,000<br />
Number <strong>of</strong> Teachers<br />
4,000<br />
3,000<br />
2,000<br />
1,000<br />
0<br />
1992-1993<br />
2002-2003<br />
65<br />
Age<br />
Source:<br />
Note:<br />
<strong>Iowa</strong> Department <strong>of</strong> Education, Bureau <strong>of</strong> Planning, Research, and Evaluation, Basic Educational<br />
Data Survey, Staff Files.<br />
Includes AEA teachers.<br />
Teachers in <strong>Iowa</strong> public schools who are covered by the <strong>Iowa</strong> Public Employee Retirement<br />
System (IPERS) are eligible to receive full retirement benefits if they are at least 55 years <strong>of</strong><br />
age and the sum <strong>of</strong> their age and total IPERS covered employment is equal to or greater<br />
than 88. Table 27 and Figure 14 report the combined age and experience distribution for fulltime<br />
teachers in <strong>Iowa</strong> in 1992-1993 and 2002-2003. The percentage <strong>of</strong> teachers in the 88+<br />
category decreased by 0.9 percentage points in the past decade, while the percentage <strong>of</strong><br />
teachers with combined age and experience <strong>of</strong> 71-87 years increased by 8.5 percentage points.<br />
Table 27<br />
COMBINED AGE AND EXPERIENCE DISTRIBUTION OF IOWA<br />
FULL-TIME PUBLIC SCHOOL TEACHERS<br />
1992-1993 AND 2002-2003<br />
1992-1993 2002-2003<br />
Combined Age<br />
and Experience Cumulative Cumulative Cumulative Cumulative<br />
Interval Number Total Percent Percent Number Total Percent Percent<br />
30 and Under 2,591 2,591 8.6% 8.6% 3,749 3,749 11.2% 11.2%<br />
31-40 3,817 6,408 12.6 21.2 4,954 8,703 14.8 26.0<br />
41-50 4,530 10,938 15.0 36.2 4,503 13,206 13.5 39.5<br />
51-60 6,225 17,163 20.6 56.7 4,765 17,971 14.3 53.8<br />
61-70 5,650 22,813 18.7 75.4 4,723 22,694 14.1 67.9<br />
71-80 3,572 26,385 11.8 87.2 5,642 28,336 16.9 84.8<br />
81-87 1,980 28,365 6.5 93.8 3,325 31,661 9.9 94.7<br />
88+ 1,886 30,251 6.2 100.0 1,764 33,425 5.3 100.0<br />
Source:<br />
Note:<br />
<strong>Iowa</strong> Department <strong>of</strong> Education, Bureau <strong>of</strong> Planning, Research, and Evaluation, Basic Educational<br />
Data Survey, Staff Files.<br />
Includes AEA teachers.<br />
62
Figure 14<br />
DISTRIBUTION OF IOWA FULL-TIME PUBLIC SCHOOL TEACHERS<br />
Number <strong>of</strong> Teachers<br />
7,000<br />
6,000<br />
5,000<br />
4,000<br />
3,000<br />
2,000<br />
1,000<br />
COMBINED AGE AND EXPERIENCE<br />
1992-1993 AND 2002-2003<br />
1992-1993<br />
2002-2003<br />
Elementary/Secondary<br />
0<br />
Beginning Full-time Public School Teachers<br />
Information about beginning teachers is collected on the third Friday in September for Fall<br />
BEDS. A beginning teacher is defined as someone in their first year <strong>of</strong> teaching. Table 31<br />
includes information about beginning teachers from 1997-1998 to 2002-2003. The number<br />
<strong>of</strong> beginning full-time teachers increased from 1,133 to 1,660 between 1997-1998 and 2000-<br />
2001, but decreased to 1,104 in 2002-2003. For 2002-2003, the minimum salary for full-time<br />
public school teachers was $24,500. The average salary increased approximately $5,000<br />
since 1997-1998. The percent <strong>of</strong> minority beginning full-time teachers increased 1.0<br />
percentage points in 2002-2003. The percent <strong>of</strong> beginning teachers with advanced degrees<br />
decreased from 6.1 percent in 2001-2002 to 4.9 percent in 2002-2003.<br />
Table 31<br />
CHARACTERISTICS OF BEGINNING FULL-TIME<br />
TEACHERS IN IOWA PUBLIC SCHOOLS<br />
1997-1998 THROUGH 2002-2003<br />
Elementary/Secondary<br />
1997- 1998- 1999- 2000- 2001- 2002-<br />
Characteristics 1998 1999 2000 2001 2002 2003<br />
Average Age 28.4 28.2 28.7 28.5 28.5 27.3<br />
Percent Female 67.7% 71.9% 72.6% 71.6% 72.3% 72.7%<br />
Percent Minority 3.2% 3.6% 2.1% 2.8% 1.7% 2.7%<br />
Percent Advanced Degree 3.0% 6.7% 7.1% 5.9% 6.1% 4.9%<br />
Average Salary** $22,712 $24,132 $25,275 $26,058 $27,553 $27,672<br />
Number <strong>of</strong> Beginning<br />
F-T Teachers* 1,133 1,258 1,616 1,660 1,443 1,104<br />
Percent <strong>of</strong> Beginning<br />
F-T Teachers* 3.5% 3.9% 4.9% 4.9% 4.3% 3.3%<br />
Source:<br />
Notes:<br />
.<br />
<strong>Iowa</strong> Department <strong>of</strong> Education, Bureau <strong>of</strong> Planning, Research, and Evaluation, Basic Educational Data<br />
Survey, Staff Files.<br />
*F-T indicates full-time.<br />
Includes AEA teachers.<br />
Figures for 1999-2000 to 2002-2003 represent average salaries for full-time public school staff in this<br />
group with teaching position codes.<br />
Approximately 149 full-time public school staff with teaching position codes also reported that they<br />
served in the capacity <strong>of</strong> administrator and/or student support services personnel. Average salaries<br />
for these individuals would include salaries for these additional responsibilities as well.<br />
**Salary does not include Phase III funds.<br />
Staff<br />
65
Table 32 shows the distribution <strong>of</strong> beginning full-time teachers as a percentage <strong>of</strong> full-time<br />
public school teachers by enrollment category for 1997-1998 through 2002-2003. The<br />
percentage <strong>of</strong> beginning full-time teachers as a percentage <strong>of</strong> total full-time teachers varies<br />
by enrollment category. The enrollment category <strong>of</strong> 250-399 had the largest percentage <strong>of</strong><br />
beginning teachers as a percentage <strong>of</strong> total full-time teachers, 4.5 percent, and the enrollment<br />
categories <strong>of</strong> 1,000-2,499 and 7,500+ had the smallest percentage <strong>of</strong> beginning teachers as<br />
a percentage <strong>of</strong> total full-time teachers, 3.0 percent. The percentage <strong>of</strong> beginning teachers as<br />
a percentage <strong>of</strong> total full-time teachers decreased for all enrollment categories between 2001-<br />
2002 and 2002-2003, while the percentage <strong>of</strong> beginning teachers as a percentage <strong>of</strong> total fulltime<br />
teachers at the AEAs increased to 4.7 percent.<br />
Table 32<br />
IOWA FULL-TIME BEGINNING TEACHERS AS A PERCENTAGE<br />
OF TOTAL FULL-TIME PUBLIC SCHOOL TEACHERS<br />
1997-1998 THROUGH 2002-2003<br />
Beginning F-T* Teachers<br />
Number <strong>of</strong> Beginning F-T* Teachers as a % <strong>of</strong> Total F-T* Teachers<br />
Year<br />
Year<br />
Enrollment 1997- 1998- 1999- 2000- 2001- 2002- 1997- 1998- 1999- 2000- 2001- 2002-<br />
Category 1998 1999 2000 2001 2002 2003 1998 1999 2000 2001 2002 2003<br />
Minority Teacher Characteristics<br />
Minority teachers accounted for 1.8 percent <strong>of</strong> the full-time teachers in <strong>Iowa</strong> in 2002-2003.<br />
Compared with non-minority teachers, minority teachers were on average about 2 years<br />
younger (Table 33). The percentage <strong>of</strong> teachers with advanced degrees was higher for<br />
minority teachers than for non-minority teachers, 27.8 percent compared with 26.7 percent.<br />
The average district experience and average total experience were greater for non-minority<br />
teachers. There was no significant difference in minority and non-minority teacher average<br />
salary.<br />
Table 33<br />
CHARACTERISTICS OF IOWA FULL-TIME PUBLIC SCHOOL TEACHERS<br />
BY MINORITY AND NON-MINORITY GROUPS<br />
2002-2003<br />
Elementary/Secondary<br />
Characteristics Non-Minority Minority<br />
Number 32,825 600<br />
Percent 98.2% 1.8%<br />
Average Age 42.4 40.5<br />
Percent Female 71.6% 67.2%<br />
Percent Advanced Degree 26.7% 27.8%<br />
Average Total Experience 15.2 11.8<br />
Average District Experience 11.9 9.1<br />
Average Salary* $39,057 $39,135<br />
Source:<br />
Notes:<br />
<strong>Iowa</strong> Department <strong>of</strong> Education, Bureau <strong>of</strong> Planning, Research, and Evaluation, Basic Educational<br />
Data Survey, Staff File.<br />
Includes AEA teachers.<br />
*Salary does not include Phase III funds.<br />
Figures for 2002-2003 represent average salaries for full-time public school staff with at least<br />
one teaching position code. 5,468 full-time public school staff in 2002-2003 with teaching position<br />
codes also reported that they served in the capacity <strong>of</strong> administrator and/or student support<br />
services personnel. Average salaries for those staff include salaries for these additional<br />
responsibilities as well.<br />
Staff<br />
67
Teacher Salaries<br />
Salaries for licensed staff are reported through the Fall Basic Educational Data Survey.<br />
Benefits are not included in the reported salary, but salary for extra duties such as yearbook<br />
sponsorship and coaching may be included. Also, 5,468 licensed staff with teaching positions<br />
reported having administrative and supportive assignments and/or positions, which could<br />
inflate the teacher salary figures in 2002-2003.<br />
In 2002-2003, full-time teachers were required to have a minimum salary <strong>of</strong> $24,500 and<br />
minimum contract length <strong>of</strong> 180 days. The average salary <strong>of</strong> full-time public school teachers<br />
in 2002-2003 was $39,059, an increase <strong>of</strong> 2.2 percent from 2001-2002 and an increase <strong>of</strong> 80.1<br />
percent from 1985-1986.<br />
Average teacher salaries increased with the size <strong>of</strong> the enrollment category (Table 34). The<br />
enrollment category <strong>of</strong> less than 250 students had the smallest average salary, $31,042. The<br />
largest average salary was $42,779 for the enrollment category <strong>of</strong> 7,500 or more students.<br />
Table 34<br />
AVERAGE SALARIES OF IOWA FULL-TIME PUBLIC SCHOOL<br />
TEACHERS BY ENROLLMENT CATEGORY<br />
1985-1986, 2001-2002 AND 2002-2003<br />
Percent Percent<br />
Salary Salary<br />
Change Change<br />
1985-1986 2001-2002<br />
Enrollment Average Salary* to to<br />
Category 1985-1986 2001-2002 2002-2003 2002-2003 2002-2003<br />
Tables 35 through 37 present public school teacher information by years <strong>of</strong> total experience<br />
and advanced degree status. For all categories, average salary increased with the size <strong>of</strong> the<br />
enrollment category in 2002-2003. In 2002-2003, full-time teachers at the baccalaureate<br />
degree level and more then ten years <strong>of</strong> total experience had an average salary <strong>of</strong> $40,940,<br />
which was about $11,000 higher than teachers at the same degree level and five or less years<br />
<strong>of</strong> experience ($29,800). For teachers with advanced degrees, the average salary was $34,974<br />
for teachers with total experience <strong>of</strong> five or less years and $48,339 for teachers with total<br />
experience <strong>of</strong> more than ten years. The difference in average salaries between teachers at the<br />
baccalaureate degree level and teachers with advanced degrees was $7,399 for teachers with<br />
more then ten years experience which was a greater difference than teachers with five or less<br />
years <strong>of</strong> experience, $5,174.<br />
Table 35<br />
AVERAGE SALARY COMPARISON FOR IOWA PUBLIC SCHOOL<br />
FULL-TIME TEACHERS WITH TOTAL EXPERIENCE<br />
OF FIVE YEARS OR LESS<br />
1985-1986 VS. 2002-2003<br />
Elementary/Secondary<br />
Average Salary Average Salary Number <strong>of</strong> Teachers<br />
Baccalaureate Advanced Baccalaureate Advanced<br />
Enrollment Degree Level Degree Level Degree Degree<br />
Category 1985-1986 2002-2003 1985-1986 2002-2003 2002-2003 2002-2003<br />
Table 36<br />
AVERAGE SALARY COMPARISON FOR IOWA PUBLIC SCHOOL<br />
FULL-TIME TEACHERS WITH TOTAL EXPERIENCE OF<br />
SIX TO TEN YEARS<br />
1985-1986 VS. 2002-2003<br />
Average Salary Average Salary Number <strong>of</strong> Teachers<br />
Baccalaureate Advanced Baccalaureate Advanced<br />
Enrollment Degree Level Degree Level Degree Degree<br />
Category 1985-1986 2002-2003 1985-1986 2002-2003 2002-2003 2002-2003<br />
Average Regular Salary vs. Average Total Salary<br />
Regular salary is the portion <strong>of</strong> contract salary that is paid for direct position responsibilities.<br />
The total salary <strong>of</strong> teachers includes salary paid for extra curricular and extra duties that go<br />
beyond the salary paid for teaching: such as, coaching, yearbook sponsorship, and supervision<br />
<strong>of</strong> school organizations (such as student council) along with regular salary. The average total<br />
salary <strong>of</strong> full-time teachers and average regular salary <strong>of</strong> full-time teachers for 2001-2002 and<br />
2002-2003 are presented in Table 38. Regular salary data was not collected in 2000-2001. The<br />
average total salary was approximately 3 percent higher than average regular salary in both<br />
2001-2002 and 2002-2003.<br />
On average, almost 3 percent <strong>of</strong> teachers’ total salary was for the extra duties other than<br />
teaching.<br />
Table 38<br />
AVERAGE FULL-TIME TEACHER REGULAR SALARY VS.<br />
AVERAGE FULL-TIME TEACHER TOTAL SALARY<br />
2000-2001 THROUGH 2002-2003<br />
Elementary/Secondary<br />
2000-2001* 2001-2002 2002-2003<br />
Average Regular Salary NA $37,243 $38,000<br />
Average Total Salary $36,480 $38,230 $39,059<br />
Difference NA $987 $1,059<br />
Percent Total Salary Greater<br />
Than Regular Salary NA 2.7% 2.8%<br />
Source: <strong>Iowa</strong> Department <strong>of</strong> Education, Bureau <strong>of</strong> Planning, Research, and Evaluation, Basic Educational<br />
Data Survey, Staff Files.<br />
Notes: Includes AEA teachers.<br />
Figures represent average salaries for full-time public school teachers staff with<br />
teaching position codes. In all years, approximately 5,000 full-time public school staff with<br />
teaching position codes also reported that they served in the capacity <strong>of</strong> administrator and/or<br />
student support services personnel. Average salaries for these staff include salaries for these<br />
additional responsibilities as well. Salary does not include Phase III funds.<br />
*Regular salary not available for 2000-2001.<br />
Staff<br />
71
Teacher Salary Comparisons – Nation and Midwest <strong>State</strong>s<br />
Based on the National Education Association’s, Rankings <strong>of</strong> the <strong>State</strong>s and Estimates <strong>of</strong><br />
School Statistics, the average teacher salaries are presented in Table 39 and Figure 15. In<br />
2002-2003, <strong>Iowa</strong> ranked 35 th in the nation, dropping one spot from the 2001-2002 school<br />
year. <strong>Iowa</strong> ranked fourth among the nine midwest states listed in 2001-2002 and 2002-2003.<br />
Table ntage 39 <strong>of</strong> teachers with advanced degrees, 18.0 percent (Table 39).<br />
AVERAGE SALARIES OF PUBLIC SCHOOL TEACHERS<br />
FOR IOWA AND MIDWEST STATES<br />
2001-2002 AND 2002-2003<br />
Nation and 2001-2002 2002-2003<br />
<strong>State</strong> Salary National Rank Salary National Rank<br />
Nation $44,683 $45,822<br />
<strong>Iowa</strong>* 38,230 34 39,059 35<br />
Illinois 49,435 9 51,289 8<br />
Kansas 37,093 41 38,123 40<br />
Minnesota 42,194 22 42,833** 23<br />
Missouri 37,996 35 38,826** 36<br />
Nebraska 36,236 46 37,896 42<br />
North Dakota 32,253 50 33,210** 50<br />
South Dakota 31,295 51 32,416 51<br />
Wisconsin 42,232 21 42,871 22<br />
Source:<br />
Notes:<br />
National Education Association, Rankings <strong>of</strong> the <strong>State</strong>s and Estimates <strong>of</strong> School Statistics.<br />
*Salary does not include Phase III funds. **Data are estimated by NEA.<br />
Figures for <strong>Iowa</strong> represent average salaries for full-time public school staff with teaching position<br />
codes. Approximately 5,000 full-time public school staff in 2001-2002 and 2002-2003 with teaching<br />
position codes also reported that they served in the capacity <strong>of</strong> administrator and/or student support<br />
services personnel. Average salaries for these staff include salaries for these additional responsibilities as well.<br />
Figure 15<br />
AVERAGE SALARIES OF FULL-TIME PUBLIC SCHOOL TEACHERS<br />
FOR IOWA AND THE NATION, 1985-1986 TO 2002-2003<br />
Salary<br />
$50,000<br />
$45,000<br />
$40,000<br />
$35,000<br />
$30,000<br />
$25,000<br />
$20,000<br />
$15,000<br />
$10,000<br />
$5,000<br />
$0<br />
$25,201<br />
$26,556<br />
$28,029<br />
$29,570<br />
$31,361<br />
$33,123<br />
$34,054<br />
$35,017<br />
$35,723<br />
$36,874<br />
$21,690<br />
$22,615<br />
$24,847<br />
$25,778<br />
$26,747<br />
$27,977<br />
$29,202<br />
$30,130<br />
$30,760<br />
$31,511<br />
$37,560<br />
$38,509<br />
$39,454<br />
$40,582<br />
$41,575<br />
$43,335<br />
$44,683<br />
$45,822<br />
$32,372<br />
$33,272<br />
$34,084<br />
$35,007<br />
$35,678<br />
$36,479<br />
$38,230<br />
$39,059<br />
<strong>Iowa</strong> Nation<br />
86 87 88 89 90 91 92 93 94 95 96 97 98 99 00 01 02 03<br />
Year Ending<br />
72<br />
Source: National Education Association, Rankings <strong>of</strong> the <strong>State</strong>s and Estimates <strong>of</strong> School Statistics.<br />
Note: Figures for <strong>Iowa</strong> 2002-2003 represent average salaries for full-time public school staff with<br />
teaching position codes. Approximately 5,000 full-time public school staff in 2002-2003<br />
with teaching position codes also reported that they served in the capacity <strong>of</strong> administrator<br />
and/or student support services personnel. Average salaries for these staff include salaries for<br />
these additional responsibilities as well.
Teacher Salaries by Area Education Agency<br />
In 2002-2003, there were 15 Area Education Agencies (AEAs) in the state <strong>of</strong> <strong>Iowa</strong> that<br />
provided services to local school districts. Figure 16 shows the average salary <strong>of</strong> full-time<br />
public school teachers by AEA. Table 40 also presents the average salary <strong>of</strong> full-time public<br />
school teachers by AEA along with other characteristics. In 2002-2003, 45.9 percent <strong>of</strong> the<br />
teachers were employed in AEAs 9, 10 and 11. Teachers serving within AEAs 1, 2, 3, 4, 5,<br />
6, 13, 14, 15 and 16 had average teacher salaries that were less than the state average <strong>of</strong><br />
$39,059. The average salaries had a range <strong>of</strong> $6,508 with the low at $34,618 (AEA 14) and<br />
the high at $41,126 (AEA 9). Average years <strong>of</strong> total experience was lowest within AEA 11<br />
(13.8 years) and highest within AEA 1 (16.8 years). AEA 12 had the highest percentage <strong>of</strong><br />
full-time teachers with an advanced degree, 31.5 percent and AEA 2 had the lowest percentage<br />
<strong>of</strong> teachers with advanced degrees, 17.6 percent (Table 40).<br />
Figure 16<br />
AVERAGE SALARIES OF FULL-TIME PUBLIC SCHOOL TEACHERS<br />
BY AEA, 2002-2003<br />
Elementary/Secondary<br />
Source: <strong>Iowa</strong> Department <strong>of</strong> Education, Bureau <strong>of</strong> Planning, Research, and Evaluation, Basic Educational<br />
Data Survey, Staff File.<br />
Notes: Salaries do not include Phase III funds.<br />
Includes AEA teachers.<br />
Figures for <strong>Iowa</strong> 2002-2003 represent average salaries for full-time public school staff with teaching<br />
position codes. 5,468 full-time public school staff in 2002-2003 with teaching position codes<br />
also reported that they served in the capacity <strong>of</strong> administrator and/or student support services<br />
personnel. Average salaries for these staff include salaries for these additional responsibilities as well.<br />
Staff<br />
73
Table 40<br />
AVERAGE SALARIES OF FULL-TIME IOWA<br />
PUBLIC SCHOOL TEACHERS BY AEA 2002-2003<br />
Average Average Percent<br />
Percent <strong>of</strong> Average Total District with Advanced<br />
AEA Number Teachers Salary Experience Experience Degree<br />
1 2,143 6.4% $39,035 16.8 13.7 26.3%<br />
2 1,466 4.4 37,613 15.0 11.8 17.6<br />
3 833 2.5 37,954 15.7 11.9 20.4<br />
4 732 2.2 38,532 16.6 12.9 19.1<br />
5 1,746 5.2 36,798 15.5 12.1 18.3<br />
6 1,102 3.3 37,674 15.2 11.8 20.0<br />
7 2,093 6.3 39,498 16.2 12.6 27.0<br />
9 3,319 9.9 41,126 15.7 13.0 30.4<br />
10 4,124 12.3 39,694 14.2 10.5 30.0<br />
11 7,809 23.4 39,962 13.8 10.6 28.4<br />
12 2,089 6.2 39,950 15.9 12.7 31.5<br />
13 2,231 6.7 38,350 15.9 12.7 27.6<br />
14 874 2.6 34,618 15.2 11.8 21.5<br />
15 1,648 4.9 36,259 15.1 12.2 25.5<br />
16 1,216 3.6 38,813 16.3 13.4 27.5<br />
<strong>State</strong> 33,425 100.0 39,059 15.1 11.9 26.7<br />
Source: <strong>Iowa</strong> Department <strong>of</strong> Education, Bureau <strong>of</strong> Planning, Research, and Evaluation, Basic Educational<br />
Data Survey, Staff File.<br />
Notes: Salaries do not include Phase III funds.<br />
Includes AEA teachers.<br />
Figures for <strong>Iowa</strong> 2002-2003 represent average salaries for full-time public school staff with teaching<br />
position codes. 5,468 full-time public school staff in 2002-2003 with teaching position codes also<br />
reported that they served in the capacity <strong>of</strong> administrator and/or student support services<br />
personnel. Average salaries for these staff include salaries for these additional responsibilities as well.<br />
74
Teacher Salary Comparisons with Other<br />
Occupational Groups<br />
The U.S. Bureau <strong>of</strong> Labor Statistics calculates state occupational wage estimates for a variety<br />
<strong>of</strong> occupational groups. Wage estimates for a selection <strong>of</strong> the occupational groups requiring<br />
baccalaureate degrees in the state <strong>of</strong> <strong>Iowa</strong> for years 2000 and 2001 are presented in Table 41.<br />
The average teacher salary in <strong>Iowa</strong> increased by 2.2 percent between 2000 and 2001. The<br />
accountant and auditor average salary had the greatest increase <strong>of</strong> the occupations listed<br />
during the same time period, 8 percent. In 2001, child, family and school social workers and<br />
interior designers had a lower average salary than teachers did.<br />
Table 41<br />
IOWA SALARY COMPARISONS BY OCCUPATION<br />
2000 AND 2001<br />
Elementary/Secondary<br />
Average Salary Percent Change<br />
Occupation 2000 2001 2000 to 2001<br />
Electrical Engineer $59,960 $62,120 3.6%<br />
Computer S<strong>of</strong>tware Engineer, Applications 65,140 65,710 0.9<br />
Air Traffic Controller 60,200 63,020 4.7<br />
Civil Engineer 56,190 57,470 2.3<br />
Computer Programmer 49,710 50,820 2.2<br />
Speech-Language Pathologist/Audiologist 45,060 46,050 2.2<br />
Accountant & Auditor 39,300 42,440 8.0<br />
Teacher* 35,678 36,479 2.2<br />
Registered Nurse 37,410 39,130 4.6<br />
Child, Family and School Social Worker 32,640 34,570 5.9<br />
Interior Designer 33,230 34,630 4.2<br />
Source:<br />
Note:<br />
U.S. Bureau <strong>of</strong> Labor Statistics, <strong>State</strong> Occupational Employment and Wage Estimates, <strong>Iowa</strong>,<br />
2000 and 2001.<br />
*Teacher average salaries were based on <strong>Iowa</strong> Department <strong>of</strong> Education, Basic Educational<br />
Data Survey, Staff Files.<br />
Staff<br />
75
Teacher Salaries and the Consumer<br />
Price Index (CPI)<br />
The consumer price index (CPI) measures the change in prices over time. It compares the cost<br />
for a collection <strong>of</strong> goods in one year to the cost <strong>of</strong> the same goods the following year. A<br />
comparison <strong>of</strong> changes in the average salary <strong>of</strong> full-time public school teachers in <strong>Iowa</strong> and<br />
in the nation to the CPI is presented in Table 42. For both <strong>Iowa</strong> and the nation, the percentage<br />
increase in average teacher salary over the previous school year was greater than the annual<br />
increase in CPI for 7 <strong>of</strong> the 12 years reported.<br />
Table 42<br />
CHANGE IN FULL-TIME PUBLIC SCHOOL TEACHERS COMPARED TO<br />
CHANGES IN THE CONSUMER PRICE INDEX<br />
1990-1991 THROUGH 2002-2003<br />
<strong>Iowa</strong> Nation<br />
Percent Change Percent Change Percent Change<br />
Average from Previous Average from Previous in CPI from<br />
Year Salary Year Salary Year Previous Year<br />
1990-1991 $27,977 4.6% $33,123 5.6% 4.2%<br />
1991-1992 29,202 4.4 34,054 2.8 3.0<br />
1992-1993 30,130 3.2 35,017 2.8 3.0<br />
1993-1994 30,760 2.1 35,723 2.0 2.6<br />
1994-1995 31,511 2.4 36,874 3.2 2.8<br />
1995-1996 32,372 2.7 37,560 1.9 3.0<br />
1996-1997 33,272 2.8 38,509 2.5 2.3<br />
1997-1998 34,084 2.4 39,454 2.5 1.6<br />
1998-1999 35,007 2.7 40,582 2.9 2.2<br />
1999-2000 35,678 1.9 41,724 2.8 3.4<br />
2000-2001 36,479 2.2 43,335 3.9 2.8<br />
2001-2002 38,230 4.8 44,683 3.1 1.6<br />
2002-2003 39,059 2.2 45,822 2.5<br />
Sources: National Education Association, Rankings <strong>of</strong> the <strong>State</strong>s, U.S. Bureau <strong>of</strong> Labor, Bureau <strong>of</strong> Labor<br />
Statistics, Consumer Price Index, All Urban Consumers, and <strong>Iowa</strong> Department <strong>of</strong> Education, Bureau<br />
<strong>of</strong> Planning, Research, and Evaluation, Basic Educational Data Survey, Staff Files.<br />
Note: Figures for <strong>Iowa</strong> 1999-2000 to 2002-2003 represent average salaries for full-time public school staff<br />
with teaching position codes. Approximately 5,000 full-time public school staff in 1999-2000 and 2002-<br />
2003 with teaching position codes also reported that they served in the capacity <strong>of</strong> administrator and/<br />
or student support services personnel. Average salaries for these staff include salaries for these<br />
additional responsibilities as well.<br />
76
Beginning Teacher Salary Comparisons<br />
with Midwest <strong>State</strong>s<br />
Average teacher salaries for the midwest states as reported by the American Federation <strong>of</strong><br />
Teachers (AFT) for the 2000-2001 school year are presented in Table 43. The average<br />
beginning teacher salary in <strong>Iowa</strong> was $26,058, which was $2,928 lower than the national<br />
average <strong>of</strong> $28,986. Illinois had the highest average beginning teacher salary ($31,222) and<br />
was the only midwest state with average beginning teacher salary greater than the national<br />
average. North Dakota had the lowest average beginning teacher salary at $20,675.<br />
Table 43<br />
COMPARISON OF BEGINNING FULL-TIME PUBLIC<br />
SCHOOL TEACHER SALARIES, 2000-2001<br />
Elementary/Secondary<br />
Average<br />
Percent Beginning<br />
Average Average Beginning Salary as<br />
Beginning Teacher Salary Percent <strong>of</strong><br />
Average Average Salary Salary Above/Below Average<br />
Beginning Teacher Rank Among Rank Among National Teacher<br />
Nation and <strong>State</strong> Salary Salary Nine <strong>State</strong>s Nine <strong>State</strong>s Average Salary<br />
Nation $28,986 $43,250 67.0%<br />
<strong>Iowa</strong> 26,058 36,479 5 4 -10.1% 71.4<br />
Illinois 31,222 47,865 1 1 7.7 65.2<br />
Kansas 26,010 35,766 6 5 -10.3 72.7<br />
Minnesota 27,003 42,212 3 2 -6.8 64.0<br />
Missouri 27,173 35,091 2 6 -6.3 77.4<br />
Nebraska 24,356 34,258 7 7 -16.0 71.1<br />
North Dakota 20,675 30,891 9 8 -28.7 66.9<br />
South Dakota 22,457 30,265 8 9 -22.5 74.2<br />
Wisconsin 26,232 40,939 4 3 -9.5 64.1<br />
Source:<br />
American Federation <strong>of</strong> Teachers, http://www.aft.org/research/survey01/salarysurvey01.pdf.<br />
Staff<br />
77
Characteristics <strong>of</strong> Principals<br />
Beginning Teacher Salaries Compared to Expected<br />
Beginning Salaries in Other Occupations<br />
Table 44 lists the expected salaries <strong>of</strong> college graduates hired in the spring in the United<br />
<strong>State</strong>s in 1990, 1992, 1994, 1996, 1998, 2000, and 2001 for various occupations. The<br />
expected salary <strong>of</strong> teachers remained the lowest <strong>of</strong> the occupations listed at $28,986 in 2001.<br />
The highest expected salary was for college graduates entering an engineering occupation,<br />
$50,033. Graduates entering engineering, math/statistics, and computer science occupations<br />
had expected salaries that were over $45,000.<br />
Table 44<br />
BEGINNING TEACHER SALARIES AND EXPECTED SALARIES OF COLLEGE<br />
GRADUATES TO BE HIRED IN THE SPRING IN THE UNITED STATES<br />
1990, 1992, 1994, 1996, 1998, 2000 AND 2001<br />
Year<br />
Occupational Area 1990 1992 1994 1996 1998 2000 2001<br />
Teaching $20,529 $22,171 $23,231 $24,285 $25,735 $27,989 $28,986<br />
Engineering 32,304 35,064 35,736 38,481 42,862 47,112 50,033<br />
Accounting 27,408 28,440 28,860 29,960 33,702 37,688 40,779<br />
Sales/Marketing 27,828 27,144 28,452 30,714 33,252 37,946 40,033<br />
Business Administration 26,496 27,024 27,768 30,140 34,831 40,242 41,892<br />
Liberal Arts 26,244 26,472 27,852 29,979 33,600 36,201 37,143<br />
Chemistry 29,088 30,048 30,960 33,938 36,036 38,210 41,190<br />
Math/Statistics 28,944 28,944 31,392 33,279 40,523 46,744 49,548<br />
Economics/Finance 26,712 27,072 29,484 31,754 36,658 41,102 44,390<br />
Computer Science 29,100 31,488 31,728 35,481 40,920 46,495 49,749<br />
Source:<br />
American Federation <strong>of</strong> Teachers, http://www.aft.org/research/survey01/salarysurvey01.pdf.<br />
78
Characteristics <strong>of</strong> Principals<br />
Characteristics <strong>of</strong> principals in public and nonpublic schools are presented in Table 45. The<br />
biggest change was the percentage <strong>of</strong> female public school principals with an increase from<br />
8.7 percent to 33.3 percent between 1985-1986 and 2002-2003.<br />
The number <strong>of</strong> principals decreased for public and nonpublic schools between 1985-1986<br />
and 2002-2003. The number <strong>of</strong> principals in nonpublic schools decreased by 43.5 percent,<br />
from 177 to 100. The number <strong>of</strong> public school principals decreased from 1,223 to 1,091, a<br />
decrease <strong>of</strong> 10.8 percent. While the percentage <strong>of</strong> female principals increased in public<br />
schools, the percentage <strong>of</strong> female principals in nonpublic schools decreased from 49.5<br />
percent in 1985-1986 to 45.0 percent in 2002-2003. The percentage <strong>of</strong> minority public school<br />
principals increased from 1.6 percent in 1985-1986 to 3.7 percent in 2002-2003. There were<br />
no reported minority principals in nonpublic schools in 2002-2003.<br />
Table 45<br />
CHARACTERISTICS OF IOWA FULL-TIME PRINCIPALS<br />
1985-1986, 2001-2002 AND 2002-2003<br />
Elementary/Secondary<br />
Public<br />
Nonpublic<br />
Characteristics 1985-86 2001-02 2002-03 1985-86 2001-02 2002-03<br />
Average Age 46.6 48.0 47.8 46.0 48.9 48.1<br />
Percent Female 8.7% 32.5% 33.3% 49.5% 48.0% 45.0%<br />
Percent Minority 1.6% 3.2% 3.7% 0% 1.0% 0.0%<br />
Average Total Experience 21.9 22.4 22.0 21.5 23.3 23.1<br />
Average District Experience 13.2 11.7 11.4 6.0 9.0 9.3<br />
Number <strong>of</strong> Principals 1,223 1,108 1,091 177 102 100<br />
Source:<br />
Note:<br />
<strong>Iowa</strong> Department <strong>of</strong> Education, Bureau <strong>of</strong> Planning, Research, and Evaluation, Basic Educational<br />
Data Survey, Staff Files.<br />
Figures for public schools include AEA principals.<br />
Staff<br />
79
Principal Age and Experience<br />
As seen in Table 46 and Figure 17, the age <strong>of</strong> public school principals increased between<br />
1992-1993 and 2002-2003. In 1992-1993, about 37 percent <strong>of</strong> full-time principals were over<br />
50 years old and in 2002-2003 about 45 percent <strong>of</strong> full-time principals were over 50 years old.<br />
Table 47 and Figure 18 show the same trend for the combined age and total years <strong>of</strong><br />
experience for public school principals.<br />
Table 46<br />
AGE DISTRIBUTION OF IOWA FULL-TIME PUBLIC SCHOOL PRINCIPALS<br />
1992-1993 AND 2002-2003<br />
1992-1993 2002-2003<br />
Age Cumulative Cumulative Cumulative Cumulative<br />
Interval Number Total Percent Percent Number Total Percent Percent<br />
25-30 12 12 1.0% 1.0% 15 15 1.4% 1.4%<br />
31-35 73 85 6.1 7.1 84 99 7.7 9.1<br />
36-40 172 257 14.4 21.5 125 224 11.5 20.5<br />
41-45 266 523 22.3 43.8 156 380 14.3 34.8<br />
46-50 233 756 19.5 63.3 223 603 20.4 55.3<br />
51-55 202 958 16.9 80.2 330 933 30.2 85.5<br />
56-60 182 1,140 15.2 95.5 128 1,061 11.7 97.3<br />
61-65 51 1,191 4.3 99.7 29 1,090 2.7 99.9<br />
Over 65 3 1,194 0.3 100.0 1 1,091 0.1 100.0<br />
Source:<br />
Note:<br />
<strong>Iowa</strong> Department <strong>of</strong> Education, Bureau <strong>of</strong> Planning, Research, and Evaluation, Basic Educational<br />
Data Survey, Staff Files.<br />
Includes AEA principals.<br />
Figure 17<br />
AGE DISTRIBUTION OF IOWA FULL-TIME<br />
PUBLIC SCHOOL PRINCIPALS<br />
1992-1993 AND 2002-2003<br />
350<br />
300<br />
Number <strong>of</strong> Principals<br />
250<br />
200<br />
150<br />
100<br />
50<br />
0<br />
1992-1993<br />
2002-2003<br />
25-30 31-35 36-40 41-45 46-50 51-55 56-60 61-65 >65<br />
Age<br />
Source:<br />
Note:<br />
<strong>Iowa</strong> Department <strong>of</strong> Education, Bureau <strong>of</strong> Planning, Research, and Evaluation, Basic Educational<br />
Data Survey, Staff Files.<br />
Includes AEA principals.<br />
80
Table 47<br />
COMBINED AGE AND EXPERIENCE DISTRIBUTION OF IOWA<br />
FULL-TIME PUBLIC SCHOOL PRINCIPALS<br />
1992-1993 AND 2002-2003<br />
1992-1993 2002-2003<br />
Combined Age<br />
and Experience Cumulative Cumulative Cumulative Cumulative<br />
Interval Number Total Percent Percent Number Total Percent Percent<br />
Principal Salaries<br />
The average salary <strong>of</strong> full-time public school principals in <strong>Iowa</strong> increased by 92.8 percent<br />
from 1985-1986 to 2002-2003. Between 2001-2002 and 2002-2003, the average salary<br />
increased by 2.6 percent. Principals who served in a district with enrollment less than 250<br />
experienced the greatest increase in average salary, 5.0 percent, between 2001-2002 and<br />
2002-2003. The average salaries <strong>of</strong> principals in 2002-2003 had a range <strong>of</strong> $17,577, with a<br />
low <strong>of</strong> $58,165 in enrollment category less than 250 and a high <strong>of</strong> $75,742 in enrollment<br />
category 7,500+ (Table 48).<br />
Table 48<br />
AVERAGE SALARY OF IOWA FULL-TIME PUBLIC SCHOOL<br />
PRINCIPALS BY ENROLLMENT CATEGORY<br />
1985-1986, 2001-2002 AND 2002-2003<br />
Average Salary<br />
Percent Average<br />
Number <strong>of</strong> Salary Change<br />
Enrollment Principals 2001-2002 to<br />
Category 1985-1986 2001-2002 2002-2003 2002-2003 2002-2003<br />
Characteristics <strong>of</strong> Superintendents<br />
Table 49 contains the characteristics <strong>of</strong> superintendents in 1985-1986, 2001-2002, and 2002-<br />
2003. Between 1985-1986 and 2002-2003, there were a number <strong>of</strong> district reorganizations that<br />
account for the decrease in the number <strong>of</strong> superintendents from 425 in 1985-1986 to 342 in<br />
2002-2003. Also, in 2002-2003 there were 28 districts who shared superintendents and some<br />
superintendents who worked part-time. During the same time period, the average age <strong>of</strong><br />
superintendents increased from 48.7 years to 51.9 years. The percentage <strong>of</strong> full-time female<br />
superintendents increased from 1.6 percent to 9.6 percent. Along with the increase in the<br />
percentage <strong>of</strong> females superintendents, the percentage <strong>of</strong> minority superintendents increased<br />
from 0 to 1.5 percent.<br />
Table 49<br />
CHARACTERISTICS OF IOWA FULL-TIME PUBLIC<br />
SCHOOL SUPERINTENDENTS —1985-1986, 2001-2002 AND 2002-2003<br />
Characteristics 1985-1986 2001-2002* 2002-2003<br />
Elementary/Secondary<br />
Average Age 48.7 52.0 51.9<br />
Percent Female 1.6% 8.2% 9.6%<br />
Percent Minority 0.0% 1.5% 1.5%<br />
Percent Specialist/Doctorate Degree 46.9% 61.0% 59.6%<br />
Average Total Experience 23.6 26.7 26.6<br />
Average District Experience 8.8 7.6 6.8<br />
Number 425 328 342<br />
Source:<br />
Note:<br />
<strong>Iowa</strong> Department <strong>of</strong> Education, Bureau <strong>of</strong> Planning, Research, and Evaluation, Basic Educational<br />
Data Survey, Staff Files.<br />
Although every district is required to have a superintendent, a number <strong>of</strong> smaller districts share<br />
superintendents.<br />
*In 2001-2002, shared-time superintendents were counted as part-time.<br />
Superintendent Age and Experience<br />
As seen in Table 50 and Figure 19, the average age <strong>of</strong> superintendents increased in the past<br />
decade. In 1992-1993, 54.3 percent were 50 years old and younger and in 2002-2003, that<br />
percentage was 35.4 percent. In the same time period, the percent <strong>of</strong> superintendents over 60<br />
years old increased from 5.0 percent to 8.2 percent.<br />
Table 50<br />
AGE DISTRIBUTION OF IOWA FULL-TIME PUBLIC SCHOOL SUPERINTENDENTS<br />
1992-1993 AND 2002-2003<br />
1992-1993 2002-2003<br />
Age Cumulative Cumulative Cumulative Cumulative<br />
Interval Number Total Percent Percent Number Total Percent Percent<br />
21-35 5 5 1.5% 1.5% 4 4 1.2% 1.2%<br />
36-40 22 27 6.5 8.0 13 17 3.8 5.0<br />
41-45 60 87 17.7 25.7 40 57 11.7 16.7<br />
46-50 97 184 28.6 54.3 64 121 18.7 35.4<br />
51-55 60 244 17.7 72.0 117 238 34.2 69.6<br />
56-60 78 322 23.0 95.0 76 314 22.2 91.8<br />
61-65 16 338 4.7 99.7 25 339 7.3 99.1<br />
Over 65 1 339 0.3 100.0 3 342 0.9 100.0<br />
Staff<br />
Source:<br />
Note:<br />
<strong>Iowa</strong> Department <strong>of</strong> Education, Bureau <strong>of</strong> Planning, Research, and Evaluation, Basic Educational<br />
Data Survey, Staff Files.<br />
Although every district is required to have a superintendent, a number <strong>of</strong> smaller districts share<br />
superintendents.<br />
83
Figure 19<br />
AGE DISTRIBUTION OF IOWA FULL-TIME PUBLIC<br />
SCHOOL SUPERINTENDENTS<br />
1992-1993 AND 2002-2003<br />
140<br />
120<br />
Number <strong>of</strong> Superintendents<br />
100<br />
80<br />
60<br />
40<br />
20<br />
0<br />
1992-1993<br />
2002-2003<br />
21-35 36-40 41-45 46-50 51-55 56-60 61-65 >65<br />
Combined Age and Experience<br />
Source:<br />
<strong>Iowa</strong> Department <strong>of</strong> Education, Bureau <strong>of</strong> Planning, Research, and Evaluation, Basic Educational<br />
Data Survey, Staff Files.<br />
Superintendents are eligible for the same retirement benefits as teachers and other administrators.<br />
They are able to retire under IPERS with full benefits when their combined age and<br />
experience is at least 88 years. Table 51 and Figure 20 present the combined age and experience<br />
distribution <strong>of</strong> full-time public school superintendents. In 2002-2003, 26.0 percent <strong>of</strong> fulltime<br />
superintendents were eligible for IPERS retirement benefits.<br />
Table 51<br />
COMBINED AGE AND EXPERIENCE DISTRIBUTION OF IOWA FULL-TIME<br />
PUBLIC SCHOOL SUPERINTENDENTS<br />
1992-1993 AND 2002-2003<br />
Combined Age<br />
1992-1993 2002-2003<br />
and Experience Cumulative Cumulative Cumulative Cumulative<br />
Interval Number Total Percent Percent Number Total Percent Percent<br />
30-40 1 1 0.3% 0.3% 1 1 0.3% 0.3%<br />
41-50 14 15 4.1 4.4 9 10 2.6 2.9<br />
51-60 38 53 11.2 15.6 26 36 7.6 10.5<br />
61-70 78 131 23.0 38.6 50 86 14.6 25.1<br />
71-80 84 215 24.8 63.4 88 174 25.7 50.9<br />
81-87 39 254 11.5 74.9 79 253 23.1 74.0<br />
88+ 85 339 25.1 100.0 89 342 26.0 100.0<br />
84<br />
Source:<br />
Note:<br />
<strong>Iowa</strong> Department <strong>of</strong> Education, Bureau <strong>of</strong> Planning, Research, and Evaluation, Basic Educational<br />
Data Survey, Staff Files.<br />
Although every district is required to have a superintendent, a number <strong>of</strong> smaller districts share<br />
superintendents.
Figure 20<br />
COMBINED AGE AND EXPERIENCE OF IOWA FULL-TIME<br />
PUBLIC SCHOOL SUPERINTENDENTS<br />
1992-1993 AND 2002-2003<br />
Number <strong>of</strong> Superintendents<br />
100<br />
90<br />
80<br />
70<br />
60<br />
50<br />
40<br />
30<br />
20<br />
10<br />
1992-1993<br />
2002-2003<br />
Elementary/Secondary<br />
0<br />
30-40 41-30 51-60 61-70 71-80 81-87 88+<br />
Combined Age and Experience<br />
Source:<br />
<strong>Iowa</strong> Department <strong>of</strong> Education, Bureau <strong>of</strong> Planning, Research, and Evaluation, Basic Educational<br />
Data Survey, Staff Files.<br />
Superintendent Salaries<br />
The average salary <strong>of</strong> superintendents in 2002-2003 was $87,146. This was an increase <strong>of</strong><br />
114.1 percent since 1985-1986 and an increase <strong>of</strong> 3.4 percent from 2001-2002. Average<br />
salaries increased as enrollment category size increased, from $63,406 for the smallest<br />
enrollment category to $131,534 for the largest enrollment category (Table 52).<br />
Table 52<br />
AVERAGE SALARY OF IOWA FULL-TIME PUBLIC SCHOOL<br />
SUPERINTENDENTS BY ENROLLMENT CATEGORY<br />
1985-86, 2001-2002, AND 2002-2003<br />
2002-2003 % Change % Change<br />
Number <strong>of</strong> in Avg. Salary in Avg. Salary<br />
Enrollment Average Salary<br />
Full-time 1985-1986 to 2001-2002 to<br />
Category 1985-1986 2001-2002* 2002-2003 Superintendents 2002-2003 2002-2003<br />
Teacher, Principal, and Superintendent<br />
Salary Comparisons<br />
Figure 21 presents the annual percentage increases in average salaries for teachers, principals<br />
and superintendents from 1992-1993 to 2002-2003. For most years, including 2002-2003,<br />
superintendents salary had the greatest percentage increase and teacher salary had the smallest<br />
percentage increase..<br />
Figure 21<br />
ANNUAL PERCENTAGE INCREASES IN AVERAGE SALARIES FOR IOWA<br />
FULL-TIME PUBLIC SCHOOL TEACHERS, PRINCIPALS, AND SUPERINTENDENTS<br />
1992-1993 TO 2002-2003<br />
6<br />
5<br />
Teachers Principals Superintendents<br />
5.3<br />
4.8<br />
4.5<br />
5.5<br />
Percent<br />
4<br />
3<br />
2<br />
2.1<br />
2.6<br />
3.0<br />
2.4<br />
3.4<br />
3.9<br />
2.7<br />
3.2<br />
4.0<br />
2.8<br />
3.9<br />
3.9<br />
2.4<br />
3.3<br />
3.8<br />
2.7<br />
3.1<br />
4.1<br />
1.9<br />
3.8<br />
3.6<br />
2.2<br />
3.9<br />
2.2<br />
2.6<br />
3.4<br />
1<br />
0<br />
93 vs 94 94 vs 95 95 vs 96 96 vs 97 97 vs 98 98 vs 99 99 vs 00 00 vs 01 01 vs 02 02 vs 03<br />
Year Ending<br />
Source:<br />
Notes:<br />
<strong>Iowa</strong> Department <strong>of</strong> Education, Bureau <strong>of</strong> Planning, Research, and Evaluation, Basic Educational<br />
Data Survey, Staff Files.<br />
Salary does not include Phase III funds.<br />
Figures for 2002-2003 represent average salaries for full-time public school staff with<br />
teaching position codes. Approximately 5,000 full-time public school staff in 2002-2003<br />
with teaching position codes also reported that they served in the capacity <strong>of</strong> administrator and/or student<br />
support services personnel. Average salaries for these staff include salaries for these additional<br />
responsibilities as well.<br />
86
Average salaries by enrollment category for teachers, principals and superintendents are listed<br />
in Table 53. In 2002-2003, salaries for teachers, principals and superintendents increased as<br />
enrollment category size increased, with the smallest average salary in the smallest enrollment<br />
category and the largest average salary in the largest enrollment category. Superintendents<br />
salary had the largest range in salary, $68,128. Between 1985-1986 and 2002-2003 average<br />
salary <strong>of</strong> teachers increased by 80.1 percent, average salary <strong>of</strong> principals increased by 92.8<br />
percent and average salary <strong>of</strong> superintendents increased by 114.1 percent.<br />
Table 53<br />
AVERAGE SALARY COMPARISON OF IOWA FULL-TIME PUBLIC SCHOOL<br />
TEACHERS, PRINCIPALS, AND SUPERINTENDENTS BY ENROLLMENT CATEGORY<br />
1985-1986 AND 2002-2003<br />
Enrollment 1985-1986 2002-2003<br />
Category Teachers Principals Superintendents Teachers* Principals Superintendents<br />
Gender Comparison<br />
Table 54 compares full-time public school teachers by gender and Table 55 compares fulltime<br />
public school principals by gender. The majority <strong>of</strong> the teachers were female in 2002-<br />
2003, 23,902 females compared to 9,523 males. The average age was approximately the<br />
same for female and male teachers. There was a larger percent <strong>of</strong> male minority teachers (2.1<br />
percent) than female minority teachers (1.7 percent). Also, there was a larger percent <strong>of</strong> males<br />
with advanced degrees. The percentage <strong>of</strong> males with advanced degrees was 29.1 percent and<br />
the percentage <strong>of</strong> females with advanced degrees was 25.1 percent. Average years <strong>of</strong> total<br />
experience and average years <strong>of</strong> district experience were greater for males than females. The<br />
average salary for males was $40,931, which was higher than the average salary for females,<br />
$38,313.<br />
Table 54<br />
GENDER COMPARISON OF IOWA FULL-TIME<br />
PUBLIC SCHOOL TEACHERS — 2002-2003<br />
Characteristics Female Male<br />
Average Age 42.3 42.2<br />
Percent Minority 1.7% 2.1%<br />
Percent Advanced Degree 25.1% 29.1%<br />
Average Total Experience 14.7 16.2<br />
Average District Experience 11.5 12.8<br />
Average Salary* $38,313 $40,931<br />
Number 23,902 9,523<br />
Source:<br />
Notes:<br />
<strong>Iowa</strong> Department <strong>of</strong> Education, Bureau <strong>of</strong> Planning, Research, and Evaluation, Basic Educational<br />
Data Survey, Staff File.<br />
*Salary does not include Phase III funds. Includes AEA teachers.<br />
Figures for 2002-2003 represent average salaries for full-time public school staff with teaching<br />
position codes. Approximately 5,000 full-time public school staff in 2002-2003 with teaching<br />
position codes also reported that they served in the capacity <strong>of</strong> administrator and/or student<br />
support services personnel. Average salaries for these staff include salaries for these<br />
additional responsibilities as well.<br />
As can be seen in Table 55, males accounted for about two-thirds <strong>of</strong> the full-time public school<br />
principals in 2002-2003. The percent <strong>of</strong> minority principals was higher for females than<br />
males, 4.1 percent versus 3.4 percent. The average ages <strong>of</strong> male and female principals were<br />
similar, but male principals had more district experience, 11.6 years versus 10.9 years. There<br />
was a higher percent <strong>of</strong> female principals with advanced degrees than male principals, 95.9<br />
percent compared with 91.6 percent. Male principals had a higher average salary than female<br />
principals, $68,481 compared with $67,298.<br />
88
Table 55<br />
Source:<br />
Note:<br />
GENDER COMPARISON OF IOWA FULL-TIME<br />
PUBLIC SCHOOL PRINCIPALS — 2002-2003<br />
Characteristics Female Male<br />
Average Age 47.9 47.8<br />
Percent Minority 4.1% 3.4%<br />
Percent Advanced Degree 95.9% 91.6%<br />
Average Total Experience 20.6 22.8<br />
Average District Experience 10.9 11.6<br />
Average Salary $67,298 $68,481<br />
Number 363 728<br />
<strong>Iowa</strong> Department <strong>of</strong> Education, Bureau <strong>of</strong> Planning, Research, and Evaluation, Basic Educational<br />
Data Survey, Staff File.<br />
Includes AEA principals.<br />
Elementary/Secondary<br />
Area Education Agency Licensed Staff<br />
Area<br />
In <strong>Iowa</strong> there were 15 Area Education Agencies (AEAs) in 2002-2003 with personnel who<br />
develop and provide programs, services, leadership in school improvement, pr<strong>of</strong>essional<br />
development, emerging educational practices, school-community planning, curriculum,<br />
special education, school technology, and media services. The characteristics <strong>of</strong> these staff<br />
members are presented in Table 56. Females made up 79.3 percent <strong>of</strong> AEA staff and minorities<br />
made up 1.4 percent <strong>of</strong> AEA staff. Eighty-one percent <strong>of</strong> the AEA staff held advanced degrees.<br />
The average years <strong>of</strong> total experience was 17.9 years and the average contract length was 198.2<br />
days. The average age <strong>of</strong> AEA staff was 45.7 years. On average, AEA licensed staff had a<br />
salary <strong>of</strong> $46,399. In 2002-2003, the 2,287 full-time licensed AEA staff included administrative<br />
staff, teachers, psychologists, consultants, speech language pathologists, clinicians,<br />
social workers and others (Table 57).<br />
Table 56<br />
CHARACTERISTICS OF IOWA FULL-TIME LICENSED AEA STAFF<br />
2002-2003<br />
Characteristics<br />
Percent Female 79.3%<br />
Percent Minority 1.4%<br />
Percent Staff with Advanced Degrees 81.0%<br />
Average Years Total Experience 17.9<br />
Average Number <strong>of</strong> Contract Days 198.2<br />
Average Age 45.7<br />
Average Salary $46,399<br />
Number 2,287<br />
Staff<br />
Source:<br />
<strong>Iowa</strong> Department <strong>of</strong> Education, Bureau <strong>of</strong> Planning, Research, and Evaluation, Basic Educational<br />
Data Survey, Staff File.<br />
89
Table 57<br />
NUMBER OF IOWA FULL-TIME AEA LICENSED STAFF<br />
BY POSITION, 2002-2003<br />
Position Number Percent*<br />
Administrative Assistant 3 0.1<br />
Administrator 24 1.0<br />
Assistant Dean/Director 4 0.2<br />
Clinician 176 7.7<br />
Consultant 484 21.2<br />
Coordinator 92 4.0<br />
Counselor 1 0.0<br />
Department Head 11 0.5<br />
Director 36 1.6<br />
Educational Strategist 10 0.4<br />
Home Intervention PK Teacher 59 2.6<br />
Instructor 41 1.8<br />
Integrated Teacher 33 1.4<br />
Itinerant Teacher 71 3.1<br />
Librarian 7 0.3<br />
Manager 2 0.1<br />
Pre School Teacher 22 1.0<br />
Principal 5 0.2<br />
Psychologist 289 12.6<br />
Resource Teacher 57 2.5<br />
School Social Worker 209 9.1<br />
School Audiologist 30 1.3<br />
Self-Contained Teacher 122 5.3<br />
Special Education Nurse 4 0.2<br />
Speech Language Pathologist 313 13.7<br />
Special Education Delivery System Personnel 12 0.5<br />
Specialist 17 0.7<br />
Supervisor 37 1.6<br />
Teacher 34 1.5<br />
Therapist 82 3.6<br />
%<br />
Total 2,287 100.0 %<br />
Source:<br />
Note:<br />
<strong>Iowa</strong> Department <strong>of</strong> Education, Bureau <strong>of</strong> Planning, Research, and Evaluation, Basic Educational<br />
Data Survey, Staff File.<br />
*Figures may not total 100 percent due to rounding.<br />
90
The distribution <strong>of</strong> <strong>Iowa</strong> public school districts and public and nonpublic school full-time<br />
licensed staff by AEAs are listed in Table 58. Figure 22 shows the number <strong>of</strong> public school<br />
full-time licensed staff by AEA. A total <strong>of</strong> 14.8 percent <strong>of</strong> districts were served by AEA 11<br />
with 23.5 percent <strong>of</strong> the public school licensed staff and 19 percent <strong>of</strong> the nonpublic school<br />
licensed staff. The smallest percent <strong>of</strong> districts were served by AEA 16, 3.6 percent <strong>of</strong> public<br />
school licensed staff and 3.7 percent <strong>of</strong> nonpublic licensed staff.<br />
Figure 22<br />
NUMBER OF PUBLIC SCHOOL FULL-TIME LICENSED STAFF<br />
BY AEA, 2002-2003<br />
Elementary/Secondary<br />
Source:<br />
Note:<br />
<strong>Iowa</strong> Department <strong>of</strong> Education, Bureau <strong>of</strong> Planning, Research, and Evaluation, Basic Educational<br />
Data Survey, Staff File.<br />
AEA full-time licensed staff are included.<br />
Staff<br />
91
Table 58<br />
DISTRIBUTION OF IOWA PUBLIC AND NON-PUBLIC SCHOOL TOTAL<br />
FULL-TIME LICENSED STAFF BY AEAS<br />
2002-2003<br />
AEA Districts Public School Licensed Staff* Nonpublic School Licensed Staff<br />
N % N % N %<br />
1 25 6.7% 2,533 6.4% 463 16.0%<br />
2 24 6.5 1,722 4.4 88 3.0<br />
3 18 4.8 974 2.5 80 2.8<br />
4 14 3.8 849 2.2 200 6.9<br />
5 31 8.3 2,077 5.3 147 5.1<br />
6 14 3.8 1,312 3.3 30 1.0<br />
7 23 6.2 2,466 6.2 239 8.2<br />
9 22 5.9 3,927 10.0 269 9.2<br />
10 33 8.9 4,910 12.4 328 11.3<br />
11 55 14.8 9,272 23.5 552 19.0<br />
12 24 6.5 2,408 6.1 253 8.7<br />
13 31 8.4 2,641 6.7 99 3.4<br />
14 20 5.4 1,038 2.6 10 0.3<br />
15 24 6.5 1,920 4.9 44 1.5<br />
16 13 3.5 1,411 3.6 108 3.7<br />
<strong>State</strong> 371 100.0 39,460 100.0 2,910 100.0<br />
Source:<br />
Note:<br />
<strong>Iowa</strong> Department <strong>of</strong> Education, Bureau <strong>of</strong> Planning, Research, and Evaluation, Basic Educational<br />
Data Survey, Staff File<br />
*AEA full-time licensed staff are included. Figures may not total 100 percent due to rounding.<br />
Instructional Aides<br />
Instructional aides are non-licensed staff members who assist teachers in the classroom.<br />
Between 1985-1986 and 2002-2003 the number <strong>of</strong> full-time equivalent (FTE) instructional<br />
aides increased by 199.7 percent, from 2,668.6 to 7,996.5 instructional aides. The number <strong>of</strong><br />
FTE instructional aides varied by enrollment category. For schools with enrollment between<br />
600 and 999 students, the number <strong>of</strong> FTE instructional aides increased the most <strong>of</strong> all<br />
enrollment categories, 371.6 percent (Table 59). Between 2001-2002 and 2002-2003, the total<br />
number <strong>of</strong> instructional aides decreased 4.3 percent.<br />
Table 59<br />
INSTRUCTIONAL AIDES IN IOWA PUBLIC SCHOOLS<br />
1985-1986, 2001-2002 AND 2002-2003<br />
Number <strong>of</strong> Full-time Equivalent (FTE) Aides<br />
% Change % Change<br />
in FTE Aides in FTE Aides<br />
Enrollment 1985-1986 to 2001-2002 to<br />
Category 1985-1986 2001-2002 2002-2003 2002-2003 2002-2003<br />
Pupil-Teacher Ratios<br />
Figures 23 and 24 and Table 60 present pupil-teacher ratios for <strong>Iowa</strong> public schools. The state<br />
ratio in 2002-2003 did not follow the recent trend <strong>of</strong> declining pupil-teacher ratios. The pupilteacher<br />
ratio increased from 14.9 to 15.3 between 2001-2002 and 2002-2003. Pupil-teacher<br />
ratios tended to trend upward by enrollment category with the smallest ratio, 10.3, for schools<br />
with enrollment less than 250 students and the largest ratios, over 16.6, for schools with<br />
enrollment <strong>of</strong> 2,500 students or more.<br />
Figure 23<br />
20.0<br />
19.0<br />
IOWA PUBLIC SCHOOL K-12 PUPIL-TEACHER RATIOS<br />
1986 AND 1996-2003<br />
Elementary/Secondary<br />
Pupil-Teacher Ratio<br />
18.0<br />
17.0<br />
16.0<br />
15.0<br />
14.0<br />
13.0<br />
16.6<br />
16.6<br />
16.5<br />
16.4<br />
16.0<br />
15.8<br />
15.8<br />
14.9<br />
15.3<br />
12.0<br />
11.0<br />
10.0<br />
//<br />
1986 1996 1997 1998 1999 2000 2001 2002 2003<br />
Year Ending<br />
Source:<br />
Staff<br />
Note:<br />
<strong>Iowa</strong> Department <strong>of</strong> Education, Bureau <strong>of</strong> Planning, Research, and Evaluation, Basic Educational<br />
Data Survey, Enrollment Files.<br />
Pupil-teacher ratios do not include special education teachers or ungraded special education students.<br />
93
Figure 24<br />
K-12 PUPIL-TEACHER RATIOS FOR IOWA PUBLIC SCHOOLS<br />
BY ENROLLMENT CATEGORY<br />
1985-1986, 2001-2002 AND 2002-2003<br />
25.0<br />
1985-1986<br />
2001-2002<br />
2002-2003<br />
20.0<br />
16.6<br />
19.5<br />
Pupil-Teacher Ratio<br />
16.6<br />
16.8<br />
16.6<br />
16.6<br />
18.6<br />
15.0<br />
10.0<br />
10.3<br />
10.2<br />
10.3<br />
13.0<br />
12.0<br />
11.8<br />
14.3<br />
12.9<br />
13.2<br />
15.5<br />
14.1<br />
14.2<br />
15.0<br />
15.5<br />
15.7<br />
14.9<br />
15.3<br />
5.0<br />
0.0<br />
Table 60<br />
K-12 PUPIL-TEACHER RATIOS FOR IOWA PUBLIC SCHOOLS<br />
BY ENROLLMENT CATEGORY<br />
2002-2003<br />
Enrollment Number <strong>of</strong> Number <strong>of</strong><br />
Category Students FTE Teachers Ratio<br />
PROGRAM<br />
The Program chapter <strong>of</strong> The Annual Condition <strong>of</strong> Education Report includes information<br />
pertaining to school district organizational structure, curriculum unit <strong>of</strong>ferings, enrollments<br />
for foreign language, higher level mathematics, higher level science, and computer-related<br />
courses, graduation requirements for mathematics and science, class size statistics in grades<br />
kindergarten through three, and early childhood education information on preschool enrollments<br />
and kindergarten type. Also included in the Program chapter is the technology section that<br />
details information regarding expenditures for computer hardware and s<strong>of</strong>tware, availability<br />
<strong>of</strong> computers for school districts, and school district participation in Project EASIER<br />
(Electronic Access System for <strong>Iowa</strong> Education Records)<br />
School District Organizational Structure<br />
School district organizational structure in <strong>Iowa</strong> public school districts is displayed in<br />
Tables 61 and 62. In 1985-1986 the most common school district organizational structure was<br />
the K-6, 7-12 (38.9 percent). In 2002-2003 the K-6, 7-12 organizational structure was used in<br />
1.9 percent <strong>of</strong> school districts. In most cases, the traditional junior-senior high school<br />
structures <strong>of</strong> 7-12 have been replaced with middle school and grade 9-12 structures. The K-<br />
5, 6-8, 9-12 structure had the highest percentage <strong>of</strong> districts (29.6 percent) in 2002-2003.<br />
Preschool was not predominant in the 1985-1986 school district organizational structure but<br />
in 2002-2003 preschool was in nine <strong>of</strong> the 19 organizational structures.<br />
Table 61<br />
Source:<br />
ORGANIZATIONAL STRUCTURES IN IOWA PUBLIC SCHOOL DISTRICTS<br />
1985-1986<br />
Structure<br />
(Grade Level Included)<br />
Percent <strong>of</strong><br />
Districts<br />
K-6, 7-12 38.9%<br />
K-5, 6-8, 9-12 18.6<br />
K-6, 7-8, 9-12 14.2<br />
K-4, 5-8, 9-12 10.8<br />
K-6, 7-9, 10-12 7.8<br />
K-8, 9-12 7.1<br />
K-5, 6-12 0.5<br />
K-3, 4-6, 7-12 0.5<br />
PK-2, 3-5, 6-8, 9-12 0.5<br />
K-7, 8-12 0.5<br />
K-3, 4-6, 7-8, 9-12 0.2<br />
K-4, 5-6, 7-9, 10-12 0.2<br />
K-3, 4-8, 9-12 0.2<br />
100.0<br />
<strong>Iowa</strong> Department <strong>of</strong> Education, Bureau <strong>of</strong> Planning, Research, and Evaluation, Basic Educational<br />
Data Survey, Policies and Procedures File.<br />
97Program
Table 62<br />
ORGANIZATIONAL STRUCTURES IN IOWA PUBLIC SCHOOL DISTRICTS<br />
2002-2003<br />
Structure<br />
(Grade Levels Included)<br />
Percent <strong>of</strong><br />
Districts<br />
K-5, 6-8, 9-12 29.6%<br />
PK-5, 6-8, 9-12 10.0<br />
K-6, 7-8, 9-12 27.0<br />
K-4, 5-8, 9-12 11.9<br />
PK-4, 5-8, 9-12 3.5<br />
PK-6, 7-8, 9-12 9.7<br />
K-6, 7-12 1.9<br />
K-6, 7-9, 10-12 1.1<br />
K-4, 5-6, 7-8, 9-12 1.1<br />
PK-6, 7-12 1.1<br />
K-3, 4-8, 9-12 0.8<br />
PK-6, 7-9, 10-12 0.5<br />
K-3, 4-5, 6-8, 9-12
Curriculum Unit Offerings<br />
Average curriculum units <strong>of</strong>fered and taught by district enrollment category using the same<br />
title with different level courses is displayed in Table 63 for 1985-1986 and 2000-2001 through<br />
2002-2003. For all courses shown, the number <strong>of</strong> units shown by enrollment category<br />
decreases by the size <strong>of</strong> the enrollment category. In general, the number <strong>of</strong> units for all courses<br />
shown statewide has increased for every year shown. Between 1985-1986 and 2002-2003<br />
English/language arts increased 3.1 units (44.9 percent), mathematics increased 2.3 units (31.9<br />
percent), science increased 1.9 units (33.9 percent), social studies increased 2.4 units (49.0<br />
percent), and foreign language increased 2.3 units (63.9 percent).<br />
Table 63<br />
AVERAGE CURRICULUM UNITS OFFERED AND TAUGHT<br />
BY DISTRICT ENROLLMENT CATEGORY<br />
1985-1986 AND 2000-2001 TO 2002-2003<br />
SAME TITLE/DIFFERENT LEVEL - COUNTED AS SEPARATE COURSES<br />
Min Units 600- 1,000- 2,500-<br />
IA Standards
Table 64 presents average curriculum units <strong>of</strong>fered and taught by district enrollment size<br />
category using the title <strong>of</strong> the course as the determining factor in the units (course level doesn’t<br />
determine unique units) for 2000-2001 to 2002-2003. For all years shown, the number <strong>of</strong> units<br />
<strong>of</strong>fered and taught in district enrollment categories with 1,000 or more students was above the<br />
state average for each class shown. The state average for units has increased for each class for<br />
all years shown with the exception <strong>of</strong> foreign language between 2000-2001 and 2001-2002<br />
and science between 2001-2002 and 2002-2003.<br />
Table 64<br />
AVERAGE CURRICULUM UNITS OFFERED AND TAUGHT<br />
BY DISTRICT ENROLLMENT CATEGORY<br />
2000-2001 TO 2002-2003<br />
SAME TITLE/DIFFERENT LEVEL - COUNTED AS SAME COURSE<br />
Min Units 600- 1,000- 2,500-<br />
IA Standards
Courses reported as honors level and the number <strong>of</strong> units <strong>of</strong>fered and taught are reported by<br />
enrollment category in Table 65 for 2000-2001 to 2002-2003. Science courses had the highest<br />
unit values statewide in 2002-2003.Enrollment categories over 2,500 <strong>of</strong>fered more honors<br />
level units than the state average for all courses listed in each year shown.<br />
Table 65<br />
AVERAGE UNITS HONORS COURSES OFFERED AND TAUGHT BY<br />
DISTRICT ENROLLMENT CATEGORY — 2000-2001 TO 2002-2003<br />
Foreign Language Enrollments<br />
Total public school grade 9-12 foreign language enrollments by enrollment category is shown<br />
in Table 66 for 1985-1986 and 2000-2001 through 2002-2003. The Department does not<br />
collect grade levels <strong>of</strong> students, specific courses and the estimated percentage <strong>of</strong> students<br />
enrolled in foreign language courses is calculated by dividing the total enrollment in foreign<br />
language courses by the enrollment for grades 9-12. In 2002-2003, 51.8 percent <strong>of</strong> students<br />
were enrolled in foreign language courses, up from 30.8 percent in 1985-1986. Two<br />
enrollment categories (1,000-2,499 and 2,500-7,499) were above the state average while the<br />
rest were below 50.0 percent in 2002-2003. Overall, the percentage <strong>of</strong> students enrolled in<br />
foreign language courses increased slightly between 2001-2002 and 2002-2003.<br />
Table 66<br />
TOTAL IOWA PUBLIC SCHOOL GRADE 9-12 ENROLLMENT IN ALL FOREIGN<br />
LANGUAGE COURSES BY ENROLLMENT CATEGORY<br />
1985-1986, 2000-2001 TO 2002-2003<br />
1985-1986 2000-2001 2001-2002 2002-2003<br />
Number <strong>of</strong> Estimated % Number <strong>of</strong> Estimated % Number <strong>of</strong> Estimated % Number <strong>of</strong> Estimated %<br />
Enrollment Students <strong>of</strong> Students Students <strong>of</strong> Students Students <strong>of</strong> Students Students <strong>of</strong> Students<br />
Category Enrolled Enrolled Enrolled Enrolled Enrolled Enrolled Enrolled Enrolled<br />
< 250 658 20.4% 519 44.4% 44341.4% 462 48.9%<br />
250-399 1,667 18.2 2,055 42.8 2,107 43.3 2,621 45.0<br />
400-599 2,769 18.9 6,291 45.36,590 47.9 6,072 48.7<br />
600-999 5,079 21.8 12,509 48.5 12,299 49.5 12,54349.6<br />
1,000-2,499 10,536 30.2 22,096 54.7 22,073 55.3 22,224 56.2<br />
2,500-7,499 13,018 42.7 16,078 52.6 16,223 53.6 16,871 56.2<br />
7,500+ 13,064 35.9 21,761 56.6 19,645 50.1 18,028 47.4<br />
<strong>State</strong> 46,791 30.8 81,309 52.4 79,380 51.6 78,821 51.8<br />
Source:<br />
Note:<br />
<strong>Iowa</strong> Department <strong>of</strong> Education, Bureau <strong>of</strong> Planning, Research, and Evaluation, Basic Educational<br />
Data Survey, Curriculum and Enrollment Files.<br />
Estimated percents are based on the assumption that foreign language courses are normally taken<br />
in grades 9-12.<br />
Table 67 details foreign language enrollments by course for 1985-1986 and 2000-2001 to<br />
2002-2003. Spanish, French, and German accounted for 97.9 percent <strong>of</strong> the foreign language<br />
students enrolled in 2002-2003, continuing the trend for the years shown. Spanish continued<br />
to have the highest enrollment <strong>of</strong> the foreign languages and continued to increase in the<br />
percentage <strong>of</strong> students enrolled. In 2002-2003, Spanish had 79.5 percent <strong>of</strong> the students<br />
enrolled in foreign language, up 1.5 percentage points from 2001-2002 and 19.9 percentage<br />
points from 1985-1986.<br />
Table 67<br />
FOREIGN LANGUAGE ENROLLMENT IN IOWA PUBLIC SCHOOLS<br />
GRADES 9-12 — 1985-1986, 2000-2001 TO 2002-2003<br />
1985-1986 2000-2001 2001-2002 2002-2003<br />
Number <strong>of</strong> % <strong>of</strong> Foreign Number <strong>of</strong> % <strong>of</strong> Foreign Number <strong>of</strong> % <strong>of</strong> Foreign Number <strong>of</strong> % <strong>of</strong> Foreign<br />
Students Language Students Language Students Language Students Language<br />
Language Enrolled Enrollment Enrolled Enrollment Enrolled Enrollment Enrolled Enrollment<br />
Spanish 27,89359.6% 62,212 76.5% 61,947 78.0% 62,652 79.5%<br />
French 12,837 27.4 11,308 13.9 10,174 12.8 9,248 11.7<br />
German 5,462 11.7 6,221 7.7 5,582 7.0 5,265 6.7<br />
Japanese 21 0.0 4930.6 544 0.7 592 0.8<br />
Russian 102 0.2 185 0.2 144 0.2 54 0.1<br />
Latin 4430.9 98 0.1 88 0.1 102 0.1<br />
Chinese 0 0.0 96 0.1 116 0.1 90 0.1<br />
Italian 16 0.0 122 0.2 111 0.1 1430.2<br />
Other 17 0.0 574 0.7 674 0.8 675 0.9<br />
102<br />
Total 46,791 100.00 81,309 100.00 79,380 100.00 78,821 100.00<br />
Source: <strong>Iowa</strong> Department <strong>of</strong> Education, Bureau <strong>of</strong> Planning, Research, and Evaluation, Basic Educational<br />
Data Survey, Curriculum Files.
Higher Level Mathematics Enrollments<br />
Table 68 provides information regarding enrollments in higher level mathematics by enrollment<br />
category. Enrollments in higher level mathematics include the number <strong>of</strong> high school students<br />
and the estimated percent <strong>of</strong> students enrolled in calculus and trigonometry in <strong>Iowa</strong> public<br />
schools. Estimated percentages were calculated by dividing the number <strong>of</strong> students enrolled<br />
in higher level mathematics courses by the number <strong>of</strong> public school students in grades 11 and<br />
12. Higher level mathematics enrollments have remained at approximately 19.0 percent for<br />
the last three school years, which is almost double the percentage from 1985-1986. The<br />
percentage <strong>of</strong> students enrolled in higher level mathematics has remained below 14.0 percent<br />
for all years shown in the less than 250 students enrollment category and has been over 5.0<br />
percentage points below the state average for the last three school years. The 1,000-2,499<br />
enrollment category had the highest percentage <strong>of</strong> students enrolled for all enrollment<br />
categories for 2000-2001 through 2002-2003.<br />
Table 68<br />
IOWA PUBLIC SCHOOL ENROLLMENT IN HIGHER LEVEL MATHEMATICS<br />
BY ENROLLMENT CATEGORY — 1985-1986, 2000-2001 TO 2002-2003<br />
250- 400- 600- 1,000- 2,500-<br />
< 250 399 599 999 2,499 7,499 7,500+ <strong>State</strong><br />
1985-1986<br />
Total Number <strong>of</strong> Districts 52 90 95 97 71 24 8 437<br />
# Districts Operating High School 50 89 95 97 71 24 8 434<br />
Number <strong>of</strong> Districts Offering<br />
Higher Level Math 17 20 33 37 40 18 8 173<br />
Pupils Enrolled in Higher Level Math 93 140 355 603 1,551 1,766 2,603 7,111<br />
Percent Females Enrolled in<br />
Higher Level Math 44.1% 44.3% 44.5% 43.0% 44.6% 45.1% 46.1% 45.1%<br />
Estimated % <strong>of</strong> all Pupils Enrolled 6.0% 3.1% 4.9% 5.3% 9.2% 12.1% 15.3% 9.7%<br />
2000-2001<br />
Total Number <strong>of</strong> Districts 32 46 80 101 81 24 9 373<br />
#Districts Operating High School 14 41 80 101 81 24 9 350<br />
Number <strong>of</strong> Districts Offering<br />
Higher Level Math 8 32 75 89 77 23 9 313<br />
Pupils Enrolled in Higher Level Math 69 368 1,153 2,186 4,075 2,845 3,507 14,203<br />
Percent Females Enrolled in<br />
Higher Level Math 63.8% 56.8% 51.3% 51.7% 49.4% 49.1% 49.0% 50.0%<br />
Estimated % <strong>of</strong> all Pupils Enrolled 11.2% 15.2% 16.8% 17.4% 20.8% 19.3% 19.9% 19.1%<br />
Program<br />
2001-2002<br />
Total Number <strong>of</strong> Districts 32 46 81 98 81 24 9 371<br />
# Districts Operating High School 13 43 81 98 81 24 9 349<br />
Number <strong>of</strong> Districts Offering<br />
Higher Level Math 8 35 73 88 75 24 9 312<br />
Pupils Enrolled in Higher Level Math 58 413 1,143 2,170 4,064 2,800 3,507 14,155<br />
Percent Females Enrolled in<br />
Higher Level Math 53.4% 54.2% 50.5% 49.2% 48.2% 45.3% 48.3% 48.2%<br />
Estimated % <strong>of</strong> all Pupils Enrolled 10.2% 16.5% 16.6% 17.6% 20.7% 19.0% 19.2% 18.9%<br />
2002-2003<br />
Total Number <strong>of</strong> Districts 33 54 71 101 79 24 9 371<br />
# Districts Operating High School 12 51 71 101 79 24 9 347<br />
Number <strong>of</strong> Districts Offering<br />
Higher Level Math 9 41 67 91 75 24 9 316<br />
Pupils Enrolled in Higher Level Math 71 527 1,120 2,226 4,031 3,125 3,403 14,503<br />
Percent Females Enrolled in<br />
Higher Level Math 47.9% 54.5% 47.7% 51.2% 49.4% 48.5% 46.8% 48.9%<br />
Estimated % <strong>of</strong> all Pupils Enrolled 13.8% 18.0% 17.9% 17.3% 20.5% 21.2% 19.1% 19.4%<br />
Source:<br />
Notes:<br />
<strong>Iowa</strong> Department <strong>of</strong> Education, Bureau <strong>of</strong> Planning, Research, and Evaluation, Basic Educational<br />
Data Survey, Curriculum and Enrollment Files.<br />
Estimated percents are based on the assumption that higher level mathematics courses are<br />
normally taken in grades 11 and 12. Includes calculus and trigonometry.<br />
103
Higher Level Science Enrollments<br />
Tables 69 and 70 display higher level science enrollments and the estimated percent <strong>of</strong> public<br />
high school students enrolled in chemistry and physics. The estimated percentage <strong>of</strong> students<br />
enrolled in chemistry is calculated by dividing the number <strong>of</strong> students in grade 11 by the<br />
number <strong>of</strong> students enrolled in chemistry. The percentage <strong>of</strong> students enrolled in physics is<br />
estimated by dividing the number <strong>of</strong> students in grade 12 by the number <strong>of</strong> students enrolled<br />
in physics.<br />
Chemistry<br />
The statewide percentage <strong>of</strong> students in grade 11 has remained at 64 percent the last two<br />
school years. In 2002-2003, all enrollment categories were above 60 percent enrolled in<br />
chemistry with the exception <strong>of</strong> the 250-399 enrollment category at 59.2 percent. During the<br />
last three school years (2000-2001 to 2002-2003), more females have been enrolled in<br />
chemistry courses than males statewide. Between 1985-1986 and 2002-2003, the percentage<br />
<strong>of</strong> students enrolled in chemistry has increased 16.0 percentage points. All enrollment<br />
categories have increased the percentage <strong>of</strong> students enrolled in chemistry in that same<br />
timeframe (Table 69).<br />
Table 69<br />
IOWA PUBLIC SCHOOL ENROLLMENT IN CHEMISTRY<br />
BY ENROLLMENT CATEGORY 1985-1986, 2000-2001 TO 2002-2003<br />
250- 400- 600- 1,000- 2,500-<br />
< 250 399 599 999 12,499 7,499 7,500+ <strong>State</strong><br />
1985-1986<br />
Total Number <strong>of</strong> Districts 52 90 95 97 71 24 8 437<br />
Number Districts Operating High School 50 89 95 97 71 24 8 434<br />
Number <strong>of</strong> Districts Offering Chemistry 40 73 87 96 71 24 8 399<br />
Pupils Enrolled in Chemistry 413 971 1,690 2,946 3,969 4,283 3,673 17,945<br />
Percent Females Enrolled in Chemistry 50.6% 51.3% 52.0% 51.0% 49.3% 48.8% 47.5% 49.5%<br />
Estimated % <strong>of</strong> all Pupils Enrolled 55.4% 42.4% 46.0% 51.5% 46.3% 57.8% 41.8% 48.2%<br />
2000-2001<br />
Total Number <strong>of</strong> Districts 32 46 80 101 81 24 9 373<br />
Number Districts Operating High School 14 41 80 101 81 24 9 350<br />
Number <strong>of</strong> Districts Offering Chemistry 10 37 78 99 80 24 9 337<br />
Pupils Enrolled in Chemistry 124 689 1,998 4,041 6,464 4,901 6,328 24,545<br />
Percent Females Enrolled in Chemistry 43.5% 56.6% 55.6% 55.1% 54.5% 51.4% 52.5% 53.6%<br />
Estimated % <strong>of</strong> all Pupils Enrolled 44.8% 55.7% 58.9% 64.8% 65.5% 65.4% 69.7% 65.3%<br />
2001-2002<br />
Total Number <strong>of</strong> Districts 32 46 81 98 81 24 9 371<br />
Number Districts Operating High School 13 43 81 98 81 24 9 349<br />
Number <strong>of</strong> Districts Offering Chemistry 11 41 80 98 80 24 9 343<br />
Pupils Enrolled in Chemistry 153 747 2,065 4,163 6,566 5,055 5,874 24,623<br />
Percent Females Enrolled in Chemistry 60.8% 56.1% 52.9% 54.7% 53.8% 53.1% 51.3% 53.2%<br />
Estimated % <strong>of</strong> all Pupils Enrolled 57.3% 59.9% 58.3% 65.9% 65.2% 66.9% 62.3% 64.1%<br />
2002-2003<br />
Total Number <strong>of</strong> Districts 33 54 71 101 79 24 9 371<br />
Number Districts Operating High School 12 51 71 101 79 24 9 347<br />
Number <strong>of</strong> Districts Offering Chemistry 10 47 70 99 79 24 9 338<br />
Pupils Enrolled in Chemistry 145 857 1,877 4,294 6,532 4,986 5,721 24,412<br />
Percent Females Enrolled in Chemistry 55.2% 53.1% 53.6% 53.0% 53.7% 50.5% 52.6% 52.7%<br />
Estimated % <strong>of</strong> all Pupils Enrolled 60.2% 59.2% 61.7% 66.2% 65.8% 66.2% 61.2% 64.2%<br />
Source: <strong>Iowa</strong> Department <strong>of</strong> Education, Bureau <strong>of</strong> Planning, Research, and Evaluation, Basic Educational<br />
Data Survey, Curriculum and Enrollment Files.<br />
Note: Estimated percents are based on the assumption that chemistry courses are normally taken in grade 11.<br />
104
Physics<br />
Table 70 provides information pertaining to physics enrollments by enrollment category for<br />
1985-1986 and 2000-2001 through 2002-2003. <strong>State</strong>wide, the percentage <strong>of</strong> students enrolled<br />
in physics has decreased slightly from 28.9 percent in 2000-2001 to 27.5 percent in 2002-<br />
2003. On average, the percentage <strong>of</strong> females enrolled in physics has been at or below 45.0<br />
percent for all years shown for the state.<br />
Table 70<br />
IOWA PUBLIC SCHOOL ENROLLMENT IN PHYSICS<br />
BY ENROLLMENT CATEGORY — 1985-1986, 2000-2001 TO 2002-2003<br />
250- 400- 600- 1,000- 2,500-<br />
< 250 399 599 999 2,499 2,499 7,500+ <strong>State</strong><br />
1985-1986<br />
Total Number <strong>of</strong> Districts 52 90 95 97 71 24 8 437<br />
Number Districts Operating High School 50 89 95 97 71 24 8 434<br />
Number <strong>of</strong> Districts Offering Physics 32 71 86 91 71 24 8 383<br />
Pupils Enrolled in Physics 191 683 897 1,216 1,737 2,303 2,024 9,051<br />
Percent Females Enrolled in Physics 47.6% 36.2% 38.8% 40.2% 37.2% 40.9% 38.4% 39.1%<br />
Estimated % <strong>of</strong> all Pupils Enrolled 23.4% 30.6% 25.0% 21.6% 21.1% 32.0% 24.6% 25.2%<br />
2000-2001<br />
Total Number <strong>of</strong> Districts 32 46 80 101 81 24 9 373<br />
Number Districts Operating High School 14 41 80 101 81 24 9 350<br />
Number <strong>of</strong> Districts Offering Physics 9 35 75 98 78 24 9 328<br />
Pupils Enrolled in Physics 60 280 870 1,616 2,439 2,178 3,237 10,680<br />
Percent Females Enrolled in Physics 58.3% 48.6% 46.4% 47.0% 43.5% 44.3% 44.5% 45.0%<br />
Estimated % <strong>of</strong> all Pupils Enrolled 17.7% 23.8% 25.0% 25.4% 25.1% 30.2% 37.7% 28.9%<br />
Program<br />
2001-2002<br />
Total Number <strong>of</strong> Districts 32 46 81 98 81 24 9 371<br />
Number Districts Operating High School 13 43 81 98 81 24 9 349<br />
Number <strong>of</strong> Districts Offering Physics 7 37 76 93 78 24 9 324<br />
Pupils Enrolled in Physics 72 313 839 1,611 2,464 2,048 2,928 10,275<br />
Percent Females Enrolled in Physics 48.6% 47.9% 47.3% 50.5% 44.4% 42.4% 43.5% 45.1%<br />
Estimated % <strong>of</strong> all Pupils Enrolled 23.9% 24.8% 25.0% 26.9% 25.7% 28.5% 33.2% 28.2%<br />
2002-2003<br />
Total Number <strong>of</strong> Districts 33 54 71 101 79 24 9 371<br />
Number Districts Operating High School 12 51 71 101 79 24 9 347<br />
Number <strong>of</strong> Districts Offering Physics 10 41 68 96 75 24 9 323<br />
Pupils Enrolled in Physics 54 346 731 1,431 2,577 2,074 2,897 10,110<br />
Percent Females Enrolled in Physics 53.7% 46.5% 44.5% 42.8% 42.9% 45.7% 43.1% 43.8%<br />
Estimated % <strong>of</strong> all Pupils Enrolled 19.7% 23.3% 22.7% 22.5% 26.6% 28.7% 34.2% 27.5%<br />
Source: <strong>Iowa</strong> Department <strong>of</strong> Education, Bureau <strong>of</strong> Planning, Research, and Evaluation, Basic Educational<br />
Data Survey, Curriculum and Enrollment Files.<br />
Note: Estimated percents are based on the assumption that physics courses are normally taken in grade 12.<br />
105
Computer-Related Course Enrollments<br />
Public school enrollment in computer-related courses by enrollment category is detailed in<br />
Table 71. The percentage <strong>of</strong> students enrolled in computer-related courses is estimated by<br />
dividing the total number <strong>of</strong> students enrolled in grades 9-12 by the number <strong>of</strong> students<br />
enrolled in computer-related courses. The statewide percentage <strong>of</strong> students enrolled in<br />
computer-related courses has increased from 12.1 percent in 1985-1986 to 23.3 percent in<br />
2002-2003. The statewide percentage has decreased slightly the last two years, from 24.4<br />
percent in 2000-2001 to 23.8 percent in 2001-2002 and to 23.3 percent in 2002-2003. For the<br />
last three years (2000-2001 through 2002-2003) the 2,500-7,499 enrollment category had the<br />
lowest percentage <strong>of</strong> students enrolled in computer-related courses with each year below 20<br />
percent. <strong>State</strong>wide, a higher percentage <strong>of</strong> males were enrolled in computer-related courses<br />
for all years shown. For the years 2000-2001 to 2002-2003, all enrollment categories with<br />
fewer than 2,500 students had a higher percentage <strong>of</strong> computer-related course students than<br />
the state average while the enrollment categories with 2,500 or more students had percentages<br />
below the state average.<br />
Table 71<br />
IOWA PUBLIC SCHOOL ENROLLMENT IN COMPUTER-RELATED<br />
COURSES BY ENROLLMENT CATEGORY<br />
1985-1986, 2000-2001 TO 2002-2003<br />
250- 400- 600- 1,000- 2,500-<br />
Graduation Requirements for Mathematics and Science<br />
<strong>Iowa</strong> public high school graduation requirements are collected by the Department <strong>of</strong><br />
Education through the Basic Educational Data Survey (BEDS). <strong>Iowa</strong> Administrative<br />
Code 12.5(14) defines one course unit earned meets at least 200 minutes per week for 36<br />
weeks or is taught for the equivalent <strong>of</strong> 120 hours <strong>of</strong> instruction. For example, a class that<br />
meets one 50 minute period a day for both semesters is normally given two local credits, but<br />
would receive one course unit.<br />
The average number <strong>of</strong> graduation requirement units for mathematics and science by<br />
enrollment category for 1985-1986 and 1999-2000 through 2002-2003 is shown in Table 72.<br />
Between 2001-2002 and 2002-2003, the average state mathematics graduation requirements<br />
increased by 0.02 units while the average state science graduation requirements decreased<br />
0.13 units. On average, all enrollment categories required more than 2.0 units <strong>of</strong> mathematics<br />
in 2002-2003, up from two enrollment categories that had an average <strong>of</strong> 2.0 or greater in 1985-<br />
1986. On average, the five smallest enrollment categories required more than 2.0 units <strong>of</strong><br />
science for graduation while the two largest enrollment categories were slightly below 2.0 in<br />
2002-2003. In 1985-1986, no enrollment category had an average required science unit over<br />
2.0.<br />
Table 72<br />
AVERAGE NUMBER OF MATHEMATICS AND SCIENCE UNITS REQUIRED<br />
FOR GRADUATION IN IOWA PUBLIC SCHOOLS<br />
1985-1986 AND 1999-2000 THROUGH 2002-2003<br />
Mathematics<br />
Science<br />
Enrollment 1985- 1999- 2000- 2001- 2002- 1985- 1999- 2000- 2001- 2002-<br />
Category 1986 2000 2001 2002 2003 1986 2000 2001 2002 2003<br />
The frequency distribution <strong>of</strong> mathematics and science units required for graduation in<br />
displayed in Tables 73 and 74. In 2002-2003, the most frequent number <strong>of</strong> units required for<br />
graduation was 2.0 for both mathematics (67.1 percent) and science (75.5 percent) among the<br />
school districts. Ninety-two school districts (26.5 percent) required 3.0 or more units <strong>of</strong><br />
mathematics for graduation and 58 (16.7 percent) required 3.0 or more units <strong>of</strong> science for<br />
graduation.<br />
Table 73<br />
FREQUENCY DISTRIBUTION OF MATHEMATICS UNITS REQUIRED FOR<br />
GRADUATION BY IOWA PUBLIC SCHOOL DISTRICTS 2002-2003<br />
Units Required Number <strong>of</strong> Percent <strong>of</strong> Cumulative<br />
for Graduation Districts Districts Percent<br />
1.0 2 0.6% 0.6%<br />
1.3 1 0.3 0.9<br />
1.5 2 0.6 1.5<br />
2.0 233 67.1 68.6<br />
2.3 1 0.3 68.9<br />
2.5 16 4.6 73.5<br />
3.0 91 26.2 99.7<br />
4.0 1 0.3 100.0<br />
Source:<br />
Note:<br />
<strong>Iowa</strong> Department <strong>of</strong> Education, Bureau <strong>of</strong> Planning, Research, and Evaluation, Basic Educational<br />
Data Survey, Policies and Procedures File.<br />
The number <strong>of</strong> districts represents those districts providing high school programs and does not include<br />
districts sending high school students to other districts as a part <strong>of</strong> whole-grade sharing.<br />
Table 74<br />
FREQUENCY DISTRIBUTION OF SCIENCE UNITS REQUIRED FOR<br />
GRADUATION BY IOWA PUBLIC SCHOOL DISTRICTS<br />
2002-2003<br />
Units Required Number <strong>of</strong> Percent <strong>of</strong> Cumulative<br />
for Graduation Districts Districts Percent<br />
1.0 9 2.6% 2.6%<br />
1.5 1 0.3 2.9<br />
2.0 262 75.5 78.4<br />
2.3 2 0.6 79.0<br />
2.5 15 4.3 83.3<br />
3.0 57 16.4 99.7<br />
4.0 1 0.3 100.0<br />
Source:<br />
Note:<br />
<strong>Iowa</strong> Department <strong>of</strong> Education, Bureau <strong>of</strong> Planning, Research, and Evaluation, Basic Educational<br />
Data Survey, Policies and Procedures File.<br />
The number <strong>of</strong> districts represents those districts providing high school programs and does not include<br />
districts sending high school students to other districts as a part <strong>of</strong> whole-grade sharing.<br />
108
Class Size<br />
Chapter 256D, through House File 743 in 1999, established the <strong>Iowa</strong> Early Intervention<br />
Block Grant Program to fund class size reduction for <strong>Iowa</strong> public schools for early<br />
elementary grades. One <strong>of</strong> the program goals was the reduction <strong>of</strong> average class size in basic<br />
skills instruction for kindergarten through third grade to 17 students per teacher. In addition,<br />
the program’s goals were to provide direction and resources for early intervention efforts by<br />
school districts to achieve a higher level <strong>of</strong> student success in the basic skills, especially<br />
reading skills, and increase communication and accountability regarding student performance.<br />
Program allocations were: $10 million in FY 2000; $20 million in FY 2001; $30 million in<br />
FY 2002; and $30 million in FY 2003. House File 759 as enacted in the 2001 Second<br />
Extraordinary Session (November 2001) provided that districts could use funds received for<br />
the <strong>Iowa</strong> Early Intervention Block Grant Program for any general fund purpose. The<br />
expanded use <strong>of</strong> these funds was limited to the 2001-2002 year. Approximately $1.0 million<br />
were moved from the class size reduction funds to general fund purposes. Thirty-three<br />
districts made such adjustments to their expenditures. Federal appropriations through the<br />
U.S. Department <strong>of</strong> Education’s Class Size Reduction Program were: $9.4 million in<br />
FY 2000; $10.2 million in FY 2001; $12.8 million in FY 2002; and $12.8 million in FY 2003.<br />
<strong>Iowa</strong> public school districts report class size data on the <strong>Iowa</strong> Department <strong>of</strong> Education’s<br />
Basic Educational Data Survey (BEDS) each fall for kindergarten, first, second, and third<br />
grade classrooms. Districts also report data for nontraditional classrooms, and classrooms<br />
which combine students from different grades, for example K-5 classrooms. For each<br />
homeroom classroom, districts reported the number <strong>of</strong> students, teachers and aides. Special<br />
education, Title 1 and other pull-out classrooms were excluded. Special education, art, music,<br />
physical education and other specialty teachers were excluded from the total number <strong>of</strong><br />
teachers.<br />
Average class size was calculated by dividing the number <strong>of</strong> students by the number <strong>of</strong><br />
classroom sections for each grade level kindergarten through third grade. Students in<br />
combination classrooms were excluded from average class size calculations. For example,<br />
students in a second-third grade combination classroom were not included in the average<br />
class size for a second or third grade.<br />
Limitations<br />
Program<br />
According to HF 743, funds received under the <strong>Iowa</strong> Early Intervention Block Grant Program<br />
could be used to:<br />
• hire additional licensed instructional staff;<br />
• provide additional support for students, including before and after school<br />
programs, tutoring, and intensive summer programs;<br />
• acquire and administer diagnostic reading assessments;<br />
• implement research-based instructional intervention programs for students<br />
needing additional support;<br />
• implement all-day, everyday kindergarten programs; and<br />
• provide classroom teachers with intensive training programs to improve<br />
reading instruction and pr<strong>of</strong>essional development in best practices, including,<br />
but not limited to, training programs related to instruction to increase students’<br />
phonemic awareness, reading abilities and comprehension skills.<br />
The data provided in this report is a one-time snapshot <strong>of</strong> the classroom. Additional teachers<br />
and aides hired, or classroom sections added during the second semester were not included<br />
in the report.<br />
109
Findings<br />
A comparison <strong>of</strong> average class size by grade for the past five school years is provided in<br />
Table 75 and Figure 25. Average class size remained the same for third grade from 2001-<br />
2002 to 2002-2003 and increased slightly for kindergarten through second grade. This was<br />
the first increase in the five years under review. Grades one and two increased to their<br />
2000-2001 average. All grades remain below their 1998-1999 level.<br />
Table 75<br />
IOWA PUBLIC SCHOOL DISTRICT<br />
AVERAGE CLASS SIZES FOR GRADES K-3<br />
1998-1999 TO 2002-2003<br />
Grade 1998-1999 1999-2000 2000-2001 2001-2002 2002-2003<br />
Kindergarten 19.7 19.0 18.6 18.6 18.9<br />
1 20.1 19.4 18.8 18.5 18.8<br />
2 20.7 20.1 19.7 19.4 19.7<br />
3 21.7 20.8 20.6 20.4 20.4<br />
Source:<br />
<strong>Iowa</strong> Department <strong>of</strong> Education, Bureau <strong>of</strong> Planning, Research, and Evaluation, Basic Educational Data<br />
Survey, Class Size Survey Files.<br />
Figure 25<br />
IOWA PUBLIC SCHOOL DISTRICT AVERAGE CLASS SIZES FOR GRADES K-3<br />
1998-1999 TO 2002-2003<br />
1998-1999 1999-2000 2000-2001 2001-2002 2002-2003<br />
25<br />
20<br />
19.7<br />
19.0<br />
18.6<br />
18.6<br />
18.9<br />
20.1<br />
19.4<br />
18.8<br />
18.5<br />
18.8<br />
20.7<br />
20.1<br />
19.7<br />
19.4<br />
19.7<br />
21.7<br />
20.8<br />
20.6<br />
20.4<br />
20.4<br />
Class Size<br />
15<br />
10<br />
5<br />
0<br />
Kindergarten 1 2 3<br />
Grade<br />
Source:<br />
<strong>Iowa</strong> Department <strong>of</strong> Education, Bureau <strong>of</strong> Planning, Research, and Evaluation, Basic Educational Data<br />
Survey, Class Size Survey Files.<br />
110
The percentage change in BEDS enrollment for kindergarten through third grade was greater<br />
than the percentage change in average class size for each grade level (see Tables 76 and 77).<br />
For example, second grade BEDS enrollment declined by 8.6 percent from 1998-1999 to<br />
2002-2003 but average class size declined by 4.8 percent during the same period.<br />
Table 76<br />
IOWA PUBLIC SCHOOL BEDS ENROLLMENT FOR<br />
KINDERGARTEN THROUGH GRADE 3<br />
1998-1999 AND 2002-2003<br />
Absolute<br />
1998-1999 2002-2003 Difference in Percent Change<br />
Grade Enrollment Enrollment Enrollment in Enrollment<br />
Kindergarten 35,772 34,090 -1,682 -4.7%<br />
1 35,699 33,047 -2,652 -7.4<br />
2 35,866 32,767 -3,099 -8.6<br />
3 36,500 33,653 -2,847 -7.8<br />
Source:<br />
<strong>Iowa</strong> Department <strong>of</strong> Education, Bureau <strong>of</strong> Planning, Research, and Evaluation, Basic Educational<br />
Data Survey, Enrollment Files.<br />
Table 77<br />
Program<br />
IOWA PUBLIC SCHOOL DECLINE IN<br />
AVERAGE CLASS SIZE VS BEDS ENROLLMENT<br />
1998-1999 TO 2002-2003<br />
Percent Change Percent Change<br />
Grade in Class Size in Enrollment<br />
Kindergarten -4.1% -4.7%<br />
1 -6.5 -7.4<br />
2 -4.8 -8.6<br />
3 -6.0 -7.8<br />
Source:<br />
<strong>Iowa</strong> Department <strong>of</strong> Education, Bureau <strong>of</strong> Planning, Research, and Evaluation, Basic Educational<br />
Data Survey, Enrollment Files and Class Size Survey Files.<br />
111
The variation in change to average class size is more apparent when examined by enrollment<br />
category. Tables 78-82 show average class size by enrollment category. The smallest<br />
enrollment category, less than 250 students, had the smallest average class size in 2002-2003<br />
for all grade levels reviewed, continuing the trend first seen in 1998-1999. Although average<br />
class size increased for some enrollment categories and grade levels from 2001-2002 to 2002-<br />
2003, the 2002-2003 averages remained below their 1998-1999 levels. As in past years,<br />
average class size tended to increase as enrollment increased in 2002-2003. For example,<br />
average class size for kindergarten in the 7500+ enrollment category (20.3) was 78.1 percent<br />
greater than the average class size for kindergarten in the under 250 category (11.4). The<br />
difference from largest to smallest enrollment category was 82.9 percent for first grade, 82.1<br />
percent for second grade, and 65.7 percent for third grade.<br />
Table 78<br />
AVERAGE CLASS SIZE COMPARISON FOR IOWA PUBLIC SCHOOLS<br />
BY ENROLLMENT CATEGORY — KINDERGARTEN<br />
1998-1999 TO 2002-2003<br />
Enrollment<br />
Category 1998-1999 1999-2000 2000-2001 2001-2002 2002-2003<br />
Table 80<br />
AVERAGE CLASS SIZE COMPARISON FOR IOWA PUBLIC SCHOOLS<br />
BY ENROLLMENT CATEGORY — GRADE 2<br />
1998-1999 TO 2002-2003<br />
Enrollment<br />
Category 1998-1999 1999-2000 2000-2001 2001-2002 2002-2003<br />
Although the percentage <strong>of</strong> classrooms above 17 students increased from 2001-2002<br />
to 2002-2003 the percentage <strong>of</strong> very large classrooms, those with 30 or more students,<br />
did not increase by the same rate (see Table 83). For example, the percentage <strong>of</strong><br />
kindergarten classrooms with more than 17 students grew by 7.6 percent from 2001-<br />
2002 to 2002-2003 but the percentage <strong>of</strong> kindergarten classrooms with more than 25<br />
students declined during the same period. The percent <strong>of</strong> classrooms over 17, 21, 25<br />
and 30 students declined from the 1998-1999 base year to 2002-2003.<br />
Table 83<br />
PERCENT OF IOWA PUBLIC SCHOOL K-3 CLASSROOMS WITH<br />
GREATER THAN 17, 21, 25, AND 30 STUDENTS<br />
1998-1999, 2001-2002 AND 2002-2003<br />
Grade 1998-1999 2001-2002 2002-2003<br />
Percent above 17<br />
Kindergarten 71.8% 62.9% 67.7%<br />
1 75.5 61.8 65.9<br />
2 83.2 70.8 75.3<br />
3 87.4 79.9 80.0<br />
Percent above 21<br />
Kindergarten 34.4 20.9 24.0<br />
1 34.8 19.6 21.8<br />
2 41.9 27.4 29.7<br />
3 53.2 40.0 39.5<br />
Percent above 25<br />
Kindergarten 5.2 2.4 2.0<br />
1 5.4 2.0 2.0<br />
2 7.9 2.5 3.0<br />
3 14.4 7.4 6.9<br />
Percent above 30<br />
Kindergarten 0.2 0.2 0.1<br />
1 0.2 0.0 0.1<br />
2 0.2 0.0 0.0<br />
3 0.4 0.1 0.3<br />
Source: <strong>Iowa</strong> Department <strong>of</strong> Education, Bureau <strong>of</strong> Planning, Research, and Evaluation, Basic Educational<br />
Data Survey, Class Size Survey Files.<br />
A breakdown <strong>of</strong> the number <strong>of</strong> classroom sections for each class size is shown in Tables 84<br />
to 87 and Figures 26 to 29.<br />
114
Table 84<br />
IOWA PUBLIC SCHOOL KINDERGARTEN CLASS SIZE DISTRIBUTION<br />
1998-1999, 2001-2002 AND 2002-2003<br />
1998-1999 2001-2002 2002-2003<br />
Class Cumulative Cumulative Cumulative<br />
Size Frequency Percent Percent Frequency Percent Percent Frequency Percent Percent<br />
3 0 0.0% 0.0% 0 0.0% 0.0% 2 0.1% 0.1%<br />
4 0 0.0 0.0 2 0.1 0.1 0 0.0 0.1<br />
5 0 0.0 0.0 2 0.1 0.2 5 0.3 0.4<br />
6 1 0.1 0.1 2 0.1 0.3 1 0.1 0.4<br />
7 1 0.1 0.1 3 0.2 0.5 2 0.1 0.6<br />
8 2 0.1 0.2 7 0.4 0.9 5 0.3 0.8<br />
9 10 0.6 0.8 5 0.3 1.2 12 0.7 1.5<br />
10 9 0.5 1.3 12 0.7 1.9 14 0.8 2.3<br />
11 11 0.6 2.0 11 0.6 2.5 29 1.6 3.9<br />
12 21 1.2 3.2 46 2.6 5.0 28 1.6 5.5<br />
13 43 2.5 5.8 48 2.7 7.7 40 2.2 7.8<br />
14 59 3.5 9.2 72 4.0 11.7 69 3.9 11.6<br />
15 70 4.1 13.3 113 6.3 18.0 96 5.4 17.0<br />
16 130 7.6 21.0 151 8.4 26.5 123 6.9 24.0<br />
17 123 7.2 28.2 191 10.7 37.1 149 8.4 32.3<br />
18 159 9.3 37.5 194 10.8 48.0 206 11.6 43.9<br />
19 137 8.0 45.5 206 11.5 59.5 195 11.0 54.9<br />
20 195 11.4 57.0 187 10.4 69.9 194 10.9 65.8<br />
21 147 8.6 65.6 165 9.2 79.1 181 10.2 76.0<br />
22 154 9.0 74.6 120 6.7 85.8 149 8.4 84.4<br />
23 144 8.5 83.1 97 5.4 91.2 110 6.2 90.6<br />
24 109 6.4 89.5 69 3.9 95.1 76 4.3 94.8<br />
25 91 5.3 94.8 45 2.5 97.6 57 3.2 98.0<br />
26 50 2.9 97.8 23 1.3 98.9 19 1.1 99.1<br />
27 14 0.8 98.6 9 0.5 99.4 6 0.3 99.4<br />
28 7 0.4 99.0 4 0.2 99.6 5 0.3 99.7<br />
29 7 0.4 99.4 4 0.2 99.8 3 0.2 99.9<br />
30 6 0.4 99.8 0 0.0 99.8 1 0.1 99.9<br />
31 1 0.1 99.8 0 0.0 99.8 0 0.0 99.9<br />
32 2 0.1 99.9 1 0.1 99.9 0 0.0 99.9<br />
33 0 0.0 99.9 0 0.0 99.9 1 0.1 100.0<br />
34 0 0.0 99.9 0 0.0 99.9 0 0.0 100.0<br />
35+ 1 0.1 100.0 2 0.1 100.0 0 0.0 100.0<br />
Total 1,704 1,791 1,778<br />
Program<br />
Source:<br />
<strong>Iowa</strong> Department <strong>of</strong> Education, Bureau <strong>of</strong> Planning, Research, and Evaluation, Basic Educational<br />
Data Survey, Class Size Survey Files.<br />
115
Figure 26<br />
DISTRIBUTIONS OF IOWA PUBLIC SCHOOL<br />
KINDERGARTEN CLASS SIZE<br />
250<br />
1998-1999<br />
2001-2002<br />
2002-2003<br />
200<br />
Number <strong>of</strong> Classes<br />
150<br />
100<br />
50<br />
0<br />
3 5 7 9 11 13 15 17 19 21 23 25 27 29 31 33 35+<br />
Class Size<br />
Source:<br />
<strong>Iowa</strong> Department <strong>of</strong> Education, Bureau <strong>of</strong> Planning, Research, and Evaluation, Basic Educational<br />
Data Survey, Class Size Survey Files.<br />
116
Table 85<br />
IOWA PUBLIC SCHOOL GRADE 1 CLASS SIZE DISTRIBUTION<br />
1998-1999, 2001-2002 AND 2002-2003<br />
1998-1999 2001-2002 2002-2003<br />
Class Cumulative Cumulative Cumulative<br />
Size Frequency Percent Percent Frequency Percent Percent Frequency Percent Percent<br />
3 0 0.0% 0.0% 2 0.1% 0.1% 0 0.0% 0.0%<br />
4 0 0.0 0.0 0 0.0 0.1 1 0.1 0.1<br />
5 0 0.0 0.0 1 0.1 0.2 2 0.1 0.2<br />
6 1 0.1 0.1 1 0.1 0.3 2 0.1 0.3<br />
7 0 0.0 0.1 4 0.2 0.5 4 0.2 0.5<br />
8 4 0.2 0.3 1 0.1 0.6 3 0.2 0.7<br />
9 3 0.2 0.5 4 0.2 0.8 5 0.3 1.0<br />
10 0 0.0 0.5 4 0.2 1.0 7 0.4 1.4<br />
11 7 0.4 0.9 20 1.2 2.2 14 0.8 2.3<br />
12 12 0.7 1.6 20 1.2 3.4 29 1.7 4.0<br />
13 26 1.6 3.2 50 3.0 6.4 37 2.2 6.2<br />
14 34 2.1 5.3 84 5.0 11.3 51 3.0 9.2<br />
15 72 4.4 9.7 121 7.2 18.5 100 5.9 15.1<br />
16 103 6.3 15.9 156 9.2 27.7 147 8.7 23.9<br />
17 142 8.6 24.5 176 10.4 38.2 172 10.2 34.1<br />
18 144 8.7 33.3 189 11.2 49.4 192 11.4 45.5<br />
19 165 10.0 43.3 200 11.9 61.2 210 12.5 58.0<br />
20 175 10.6 53.9 168 10.0 71.2 194 11.5 69.5<br />
21 186 11.3 65.2 155 9.2 80.4 147 8.7 78.2<br />
22 160 9.7 74.9 117 6.9 87.3 151 9.0 87.2<br />
23 123 7.5 82.4 95 5.6 92.9 94 5.6 92.8<br />
24 112 6.8 89.2 53 3.1 96.1 51 3.0 95.8<br />
25 89 5.4 94.6 33 2.0 98.0 38 2.3 98.0<br />
26 41 2.5 97.1 22 1.3 99.3 21 1.2 99.3<br />
27 24 1.5 98.5 7 0.4 99.8 6 0.4 99.6<br />
28 14 0.9 99.4 3 0.2 99.9 4 0.2 99.9<br />
29 4 0.2 99.6 1 0.1 100.0 1 0.1 99.9<br />
30 2 0.1 99.8 0 0.0 100.0 0 0.0 99.9<br />
31 1 0.1 99.8 0 0.0 100.0 0 0.0 99.9<br />
32 0 0.0 99.8 0 0.0 100.0 1 0.1 100.0<br />
33 1 0.1 99.9 0 0.0 100.0 0 0.0 100.0<br />
34 0 0.0 99.9 0 0.0 100.0 0 0.0 100.0<br />
35 2 0.1 100.0 0 0.0 100.0 0 0.0 100.0<br />
Total 1,647 1,687 1,684<br />
Program<br />
Source:<br />
<strong>Iowa</strong> Department <strong>of</strong> Education, Bureau <strong>of</strong> Planning, Research, and Evaluation, Basic Educational<br />
Data Survey, Class Size Survey Files.<br />
117
Figure 27<br />
DISTRIBUTIONS OF IOWA PUBLIC SCHOOL<br />
GRADE 1 CLASS SIZE<br />
250<br />
200<br />
1998-1999<br />
2001-2002<br />
2002-2003<br />
150<br />
Number <strong>of</strong> Classes<br />
100<br />
50<br />
0<br />
3 5 7 9 11 13 15 17 19 21 23 25 27 29 31 33 35+<br />
Class Size<br />
Source:<br />
<strong>Iowa</strong> Department <strong>of</strong> Education, Bureau <strong>of</strong> Planning, Research, and Evaluation, Basic Educational<br />
Data Survey, Class Size Survey Files.<br />
118
Table 86<br />
IOWA PUBLIC SCHOOL GRADE 2 CLASS SIZE DISTRIBUTION<br />
1998-1999, 2001-2002 AND 2002-2003<br />
1998-1999 2001-2002 2002-2003<br />
Class Cumulative Cumulative Cumulative<br />
Size Frequency Percent Percent Frequency Percent Percent Frequency Percent Percent<br />
2 0 0.0% 0.0% 1 0.1% 0.1% 0 0.0% 0.0%<br />
3 0 0.0 0.0 0 0.0 0.1 1 0.1 0.1<br />
4 0 0.0 0.0 0 0.0 0.1 0 0.0 0.1<br />
5 1 0.1 0.1 0 0.0 0.1 1 0.1 0.1<br />
6 0 0.0 0.1 0 0.0 0.1 2 0.1 0.2<br />
7 0 0.0 0.1 2 0.1 0.2 1 0.1 0.3<br />
8 4 0.3 0.3 0 0.0 0.2 0 0.0 0.3<br />
9 2 0.1 0.4 2 0.1 0.3 2 0.1 0.4<br />
10 2 0.1 0.6 6 0.4 0.7 6 0.4 0.8<br />
11 4 0.3 0.8 11 0.7 1.3 11 0.7 1.5<br />
12 15 0.9 1.8 13 0.8 2.1 13 0.8 2.3<br />
13 11 0.7 2.4 32 1.9 4.0 31 1.9 4.2<br />
14 29 1.8 4.3 53 3.2 7.2 45 2.8 7.1<br />
15 53 3.3 7.6 72 4.3 11.6 59 3.7 10.7<br />
16 66 4.1 11.7 114 6.9 18.4 95 5.9 16.7<br />
17 81 5.1 16.8 179 10.8 29.2 128 8.0 24.7<br />
18 101 6.3 23.1 183 11.0 40.2 148 9.2 33.9<br />
19 147 9.2 32.3 161 9.7 49.9 171 10.7 44.6<br />
20 217 13.6 45.9 204 12.3 62.2 205 12.8 57.4<br />
21 196 12.3 58.1 174 10.5 72.6 207 12.9 70.3<br />
22 186 11.6 69.8 168 10.1 82.7 149 9.3 79.6<br />
23 121 7.6 77.3 104 6.3 89.0 116 7.2 86.8<br />
24 145 9.1 86.4 94 5.7 94.6 95 5.9 92.8<br />
25 91 5.7 92.1 47 2.8 97.5 68 4.2 97.0<br />
26 76 4.8 96.9 27 1.6 99.1 22 1.4 98.4<br />
27 25 1.6 98.4 11 0.7 99.8 15 0.9 99.3<br />
28 11 0.7 99.1 2 0.1 99.9 7 0.4 99.8<br />
29 9 0.6 99.7 1 0.1 99.9 2 0.1 99.9<br />
30 2 0.1 99.8 1 0.1 100.0 2 0.1 100.0<br />
31 1 0.1 99.9 0 0.0 100.0 0 0.0 100.0<br />
32 1 0.1 99.9 0 0.0 100.0 0 0.0 100.0<br />
33 0 0.0 99.9 0 0.0 100.0 0 0.0 100.0<br />
34 0 0.0 99.9 0 0.0 100.0 0 0.0 100.0<br />
35 1 0.1 100.0 0 0.0 100.0 0 0.0 100.0<br />
Total 1,598 1,662 1,602<br />
Program<br />
Source:<br />
<strong>Iowa</strong> Department <strong>of</strong> Education, Bureau <strong>of</strong> Planning, Research, and Evaluation, Basic Educational<br />
Data Survey, Class Size Survey Files.<br />
119
Figure 28<br />
DISTRIBUTIONS OF IOWA PUBLIC SCHOOL<br />
GRADE 2 CLASS SIZE<br />
250<br />
1998-1999<br />
2001-2002<br />
2002-2003<br />
200<br />
150<br />
Number <strong>of</strong> Classes<br />
100<br />
50<br />
0<br />
2 4 6 8 10 12 14 16 18 20 22 24 26 28 30 32 34<br />
Class Size<br />
Source:<br />
<strong>Iowa</strong> Department <strong>of</strong> Education, Bureau <strong>of</strong> Planning, Research, and Evaluation, Basic Educational<br />
Data Survey, Class Size Survey Files.<br />
120
Table 87<br />
IOWA PUBLIC SCHOOL GRADE 3 CLASS SIZE DISTRIBUTION<br />
1998-1999, 2001-2002 AND 2002-2003<br />
1998-1999 2001-2002 2002-2003<br />
Class Cumulative Cumulative Cumulative<br />
Size Frequency Percent Percent Frequency Percent Percent Frequency Percent Percent<br />
7 1 0.1% 0.1% 0 0.0% 0.0% 1 0.1% 0.1%<br />
8 0 0.0 0.1 1 0.1 0.1 1 0.1 0.1<br />
9 2 0.1 0.2 3 0.2 0.3 4 0.3 0.4<br />
10 3 0.2 0.4 4 0.2 0.5 3 0.2 0.6<br />
11 2 0.1 0.5 7 0.4 0.9 10 0.6 1.2<br />
12 7 0.4 1.0 15 0.9 1.8 17 1.1 2.3<br />
13 9 0.6 1.5 26 1.6 3.4 26 1.6 3.9<br />
14 16 1.0 2.5 38 2.3 5.7 41 2.6 6.4<br />
15 29 1.8 4.4 60 3.7 9.4 43 2.7 9.1<br />
16 66 4.2 8.6 87 5.3 14.7 60 3.8 12.9<br />
17 63 4.0 12.6 89 5.4 20.1 113 7.1 20.0<br />
18 87 5.5 18.1 134 8.2 28.3 125 7.8 27.8<br />
19 129 8.2 26.3 141 8.6 36.9 168 10.5 38.3<br />
20 162 10.3 36.6 189 11.5 48.4 180 11.3 49.6<br />
21 161 10.2 46.8 190 11.6 60.0 174 10.9 60.5<br />
22 142 9.0 55.8 187 11.4 71.4 158 9.9 70.4<br />
23 173 11.0 66.8 148 9.0 80.5 159 10.0 80.3<br />
24 159 10.1 76.9 117 7.1 87.6 124 7.8 88.1<br />
25 137 8.7 85.6 82 5.0 92.6 80 5.0 93.1<br />
26 105 6.7 92.3 68 4.1 96.8 59 3.7 96.8<br />
27 67 4.3 96.6 37 2.3 99.1 27 1.7 98.5<br />
28 27 1.7 98.3 8 0.5 99.6 11 0.7 99.2<br />
29 8 0.5 98.8 4 0.2 99.8 6 0.4 99.6<br />
30 13 0.8 99.6 2 0.1 99.9 3 0.2 99.7<br />
31 2 0.1 99.7 1 0.1 99.9 2 0.1 99.9<br />
32 4 0.3 100.0 1 0.1 100.0 2 0.1 100.0<br />
Total 1,574 1,639 1,597<br />
Program<br />
Source:<br />
<strong>Iowa</strong> Department <strong>of</strong> Education, Bureau <strong>of</strong> Planning, Research, and Evaluation, Basic Educational<br />
Data Survey, Class Size Survey Files.<br />
121
Figure 29<br />
DISTRIBUTIONS OF IOWA PUBLIC SCHOOL<br />
GRADE 3 CLASS SIZE<br />
200<br />
180<br />
160<br />
1998-1999<br />
2001-2002<br />
2002-2003<br />
140<br />
Number <strong>of</strong> Classes<br />
120<br />
100<br />
80<br />
60<br />
40<br />
20<br />
0<br />
2 3 4 5 6 7 8 9 10 11 12 13 14 15 16 17 18 19 20 21 22 23 24 25 26 27 28 29 30 31 32<br />
Class Size<br />
Source:<br />
<strong>Iowa</strong> Department <strong>of</strong> Education, Bureau <strong>of</strong> Planning, Research, and Evaluation, Basic Educational<br />
Data Survey, Class Size Survey Files.<br />
122
A comparison <strong>of</strong> students, classrooms and teachers from 1998-1999 to 2002-2003 is listed<br />
in Table 88. The number <strong>of</strong> kindergartners, first, second and third graders has declined since<br />
1998-1999 and the number <strong>of</strong> teachers increased.<br />
Table 88<br />
CLASS SIZE SUMMARY STATISTICS FOR KINDERGARTEN THROUGH<br />
GRADE 3 IN IOWA PUBLIC SCHOOLS<br />
1998-1999 TO 2002-2003<br />
N N N<br />
Class Size<br />
Stu- Class- Teacher 25th 75th N N<br />
Grade School Year dents rooms FTEs Mean Median %tile %tile Minimum Maximum<br />
Class Size<br />
Kindergarten 2002-2003 33,518 1,778 1,804.0 18.9 19.0 17.0 21.0 3.0 33.0<br />
2001-2002 33,380 1,791 1,838.9 18.6 19.0 16.0 21.0 4.0 41.0 *<br />
2000-2001 33,004 1,774 1,793.0 18.6 19.0 16.0 21.0 3.0 34.0<br />
1999-2000 33,488 1,764 1,779.9 19.0 19.0 17.0 21.5 4.0 34.0<br />
1998-1999 33,618 1,704 1,613.7 19.7 20.0 17.0 23.0 6.0 35.0<br />
Difference<br />
2001-2002 138 -13 -34.9 0.3 0 1 0 -1 -8<br />
to 2002-2003<br />
Difference<br />
1998-1999 -100 74 190.3 -0.8 -1 0 -2 -3 -2<br />
to 2002-2003<br />
1 2002-2003 31,618 1,684 1,715.2 18.8 19.0 17.0 21.0 4.0 32.0<br />
2001-2002 31,265 1,687 1,729.2 18.5 19.0 16.0 21.0 3.0 29.0<br />
2000-2001 32,016 1,700 1,735.0 18.8 19.0 17.0 21.0 2.0 30.0<br />
1999-2000 32,969 1,701 1,725.8 19.4 19.0 17.0 22.0 5.0 29.0<br />
1998-1999 33,053 1,647 1,644.6 20.1 20.0 18.0 23.0 6.0 35.0<br />
Difference<br />
2001-2002 353 -3 -14 0.3 0 1 0 1 3<br />
to 2002-2003<br />
Difference<br />
1998-1999 -1,435 37 70.6 -1.3 -1 -1 -2 -2 -3<br />
to 2002-2003<br />
Program<br />
2 2002-2003 31,573 1,602 1,630.0 19.7 20.0 18.0 22.0 3.0 30.0<br />
2001-2002 32,196 1,662 1,702.9 19.4 20.0 17.0 22.0 2.0 30.0<br />
2000-2001 33,125 1,679 1,712.8 19.7 20.0 17.0 22.0 2.0 31.0<br />
1999-2000 33,889 1,683 1,702.0 20.1 20.0 18.0 23.0 5.0 29.0<br />
1998-1999 33,151 1,598 1,592.1 20.7 21.0 19.0 23.0 5.0 35.0<br />
Difference<br />
2001-2002 -623 -60 -72.9 -0.3 0 1 0 1 -1<br />
to 2002-2003<br />
Difference<br />
1998-1999 -1,578 4 37.9 -1 -1 -1 -1 -2 -5<br />
to 2002-2003<br />
3 2002-2003 32,599 1,597 1,616.5 20.4 21.0 18.0 23.0 7.0 32.0<br />
2001-2002 33,474 1,639 1,682.8 20.4 21.0 18.0 23.0 8.0 32.0<br />
2000-2001 34,293 1,661 1,695.7 20.6 21.0 19.0 23.0 2.0 30.0<br />
1999-2000 34,629 1,662 1,687.0 20.8 21.0 18.0 23.0 6.0 32.0<br />
1998-1999 34,153 1,574 1,578.3 21.7 22.0 19.0 24.0 7.0 32.0<br />
Difference<br />
2001-2002 -875 -42 -66.3 0 0 -1 0 -1 0<br />
to 2002-2003<br />
Difference<br />
1998-1999 -1,554 23 38.2 -1.3 -1 -1 -1 0 0<br />
to 2002-2003<br />
Source:<br />
Note:<br />
<strong>Iowa</strong> Department <strong>of</strong> Education, Bureau <strong>of</strong> Planning, Research, and Evaluation, Basic Educational<br />
Data Survey, Class Size Survey Files.<br />
The number <strong>of</strong> students for each grade does not match Basic Educational Data Survey enrollment<br />
figures due to the exclusion <strong>of</strong> multi-age and/or multi-level classrooms from the class size data.<br />
*This classroom has one aide in addition to the teacher.<br />
123
Class Size Expenditures<br />
Over 97 percent <strong>of</strong> the funds expended in 2001-2002 on the <strong>Iowa</strong> Early Intervention Block<br />
Grant Program were expended on staff salaries and benefits. A relatively small amount <strong>of</strong><br />
funds were expended on supplies, $583,351. A statewide summary breakdown <strong>of</strong> the<br />
expenditures is presented in Table 89 and Figure 30.<br />
Table 89<br />
FY02 IOWA EARLY INTERVENTION BLOCK GRANT PROGRAM<br />
FY02 EXPENDITURES BY OBJECT<br />
Object Category Expenditures Percent<br />
Salaries $21,486,093 78.3%<br />
Benefits 5,176,559 18.9<br />
Purchased Services 135,324 .5<br />
Supplies 583,351 2.1<br />
Other 55,501 .2<br />
Total $27,436,828 100.0<br />
Source: <strong>Iowa</strong> Department <strong>of</strong> Education, Certified Annual Report.<br />
Figure 30<br />
FY02 IOWA EARLY INTERVENTION BLOCK GRANT PROGRAM<br />
FY02 EXPENDITURES BY OBJECT<br />
Employee<br />
Benefits<br />
18.9%<br />
Salaries<br />
78.3%<br />
Purchased<br />
Services,<br />
Supplies, Other<br />
2.8%<br />
Source: <strong>Iowa</strong> Department <strong>of</strong> Education, Certified Annual Report.<br />
The complete 2002-2003 class size report can be found at:<br />
http://www.state.ia.us/educate/fis/pre/eddata/<br />
Technology<br />
Expenditures for Computer Hardware and S<strong>of</strong>tware<br />
124<br />
Table 90 and Figure 31 provide information pertaining to total and per pupil expenditures for<br />
computer s<strong>of</strong>tware and hardware in <strong>Iowa</strong> public schools for years 1992-1993 through 2001-<br />
2002. Expenditure data is collected through the Certified Annual Financial Report from local
school districts and area education agencies. Both hardware and s<strong>of</strong>tware expenditures<br />
decreased significantly in 2001-2002. S<strong>of</strong>tware expenditures decreased almost $1.7 million<br />
(20.7 percent) and hardware expenditures decreased $12.2 million (35.3 percent) between<br />
2000-2001 and 2001-2002. S<strong>of</strong>tware per pupil expenditures in 2001-2002 were $13.19, the<br />
lowest amount since 1995-1996. Hardware per pupil expenditures in 2001-2002 were $45.53,<br />
the lowest amount in that category since 1994-1995. The substantial reduction in expenditures<br />
on computer hardware and s<strong>of</strong>tware could be explained by the 4.3 percent reduction in school<br />
aid that occurred during 2001-2002 and a reduction in School Improvement/Technology<br />
Program funding from the 2000-2001 amount <strong>of</strong> $30.0 million to the 2001-2002 amount <strong>of</strong><br />
$10.0 million.<br />
Table 90<br />
TOTAL EXPENDITURES AND AVERAGE PER PUPIL EXPENDITURES FOR<br />
COMPUTER SOFTWARE AND HARDWARE IN IOWA PUBLIC SCHOOLS<br />
1992-1993 TO 2001-2002<br />
S<strong>of</strong>tware Hardware S<strong>of</strong>tware & Hardware<br />
Combined<br />
No. <strong>of</strong> Total Total Per Pupil Total Per Pupil Total Per Pupil<br />
Year Districts Enrollment Expenditure Expenditure Expenditure Expenditure Expenditure Expenditure<br />
1992-1993 418 495,342 $5,581,237 $11.27 $14,562,080 $29.40 $20,143,317 $40.67<br />
1993-1994 397 497,009 $3,957,878 $7.96 $20,244,041 $40.73 $24,201,919 $48.70<br />
1994-1995 390 500,592 $5,448,978 $10.88 $21,049,364 $42.05 $26,498,342 $52.93<br />
1995-1996 384 504,505 $5,303,893 $10.51 $25,513,948 $50.57 $30,817,841 $61.09<br />
1996-1997 379 505,531 $7,182,899 $14.21 $40,201,374 $79.52 $47,384,273 $93.73<br />
1997-1998 377 505,130 $8,078,414 $15.99 $41,405,937 $81.97 $49,484,351 $97.96<br />
1998-1999 375 502,534 $8,779,582 $17.47 $39,636,072 $78.87 $48,415,654 $96.34<br />
1999-2000 375 498,607 $8,446,472 $16.94 $35,960,542 $72.12 $44,407,014 $89.06<br />
2000-2001 374 494,291 $8,144,617 $16.48 $34,462,240 $69.72 $42,606,857 $86.20<br />
2001-2002 371 489,523 $6,458,101 $13.19 $22,287,835 $45.53 $28,745,936 $58.72<br />
Program<br />
Source:<br />
Note:<br />
<strong>Iowa</strong> Department <strong>of</strong> Education, Division <strong>of</strong> Financial and Information Services, Certified Annual<br />
Financial Reports. Per Pupil Expenditures based on Certified Enrollment.<br />
Includes Administrative, Instructional, and all Other S<strong>of</strong>tware and Hardware Purchased.<br />
Figure 31<br />
COMPUTER SOFTWARE AND HARDWARE<br />
PER PUPIL EXPENDITURES IN IOWA PUBLIC SCHOOLS<br />
1992-1993 TO 2001-2002<br />
Source:<br />
Note:<br />
Per Pupil Expenditures<br />
$100<br />
$90<br />
$80<br />
$70<br />
$60<br />
$50<br />
$40<br />
$30<br />
$20<br />
$10<br />
$0<br />
$40.67<br />
1992-<br />
1993<br />
$11.27<br />
$48.70<br />
$29.40<br />
$40.73<br />
$7.96<br />
1993-<br />
1994<br />
$52.93<br />
$42.05<br />
$10.88<br />
1994-<br />
1995<br />
$61.09<br />
$50.57<br />
$10.51<br />
1995-<br />
1996<br />
$93.73<br />
$79.52<br />
$14.21<br />
1996-<br />
1997<br />
Year<br />
$97.96<br />
$81.97<br />
$15.99<br />
1997-<br />
1998<br />
$78.87<br />
$96.34<br />
$17.47<br />
1998-<br />
1999<br />
$72.12<br />
$89.06<br />
$16.94<br />
1999-<br />
2000<br />
$69.72<br />
$86.20<br />
$45.53<br />
$16.48<br />
2000-<br />
2001<br />
$58.72<br />
$13.19<br />
2001-<br />
2002<br />
S<strong>of</strong>tware<br />
Hardware<br />
Com bined<br />
<strong>Iowa</strong> Department <strong>of</strong> Education, Division <strong>of</strong> Financial and Information Services, Certified Annual<br />
Financial Report and Certified Enrollment Files.<br />
Includes Administrative, Instructional, and all other S<strong>of</strong>tware and Hardware Purchased.<br />
125
Public school expenditures for computer hardware and s<strong>of</strong>tware by enrollment category is<br />
displayed in Table 91. All enrollment categories had a decrease in total s<strong>of</strong>tware and<br />
hardware expenditures between 2000-2001 and 2001-2002. On average, districts within the<br />
largest enrollment category (7,500 or greater) had the largest decrease in per pupil s<strong>of</strong>tware<br />
and hardware expenditures (over $40 per pupil) between 2000-2001 and 2001-2002.<br />
Table 91<br />
IOWA PUBLIC SCHOOL TOTAL AND PER PUPIL EXPENDITURES BY<br />
ENROLLMENT CATEGORY FOR COMPUTER SOFTWARE AND HARDWARE<br />
1994-1995, 1995-1996, 2000-2001 AND 2001-2002<br />
Availability <strong>of</strong> Computers<br />
Public school technology data is collected by the Department <strong>of</strong> Education through the Basic<br />
Educational Data Survey (BEDS). This information has been collected since 1995-1996 and<br />
data can be used to summarize the availability <strong>of</strong> computers for public school districts at the<br />
state and district level.<br />
Figure 32 shows the statewide pupil-to-computer ratios (pupils per computer) for the years<br />
1995-1996 through 2002-2003. The ratio is calculated by dividing the sum <strong>of</strong> enrollment by<br />
the sum <strong>of</strong> computers. The ratio <strong>of</strong> pupils-to-computers has decreased from 7.2 in 1995-1996<br />
to 3.7 in 2002-2003. Data indicate that students in 2002-2003 had nearly twice as much access<br />
to computers at school as they did seven years ago.<br />
Figure 32<br />
PUPILS PER COMPUTER IN IOWA PUBLIC SCHOOLS<br />
1995-1996 TO 2002-2003<br />
Number <strong>of</strong> Pupils per Computer<br />
8<br />
7<br />
6<br />
5<br />
4<br />
3<br />
2<br />
1<br />
7.2<br />
5.9<br />
5.2<br />
4.6<br />
4.4 4.1<br />
3.9<br />
3.7<br />
Program<br />
0<br />
1995-1996 1996-1997 1997-1998 1998-1999 1999-2000 2000-2001 2001-2002 2002-2003<br />
Year<br />
Source:<br />
<strong>Iowa</strong> Department <strong>of</strong> Education, Bureau <strong>of</strong> Planning, Research, and Evaluation, Basic Educational<br />
Data Survey, Technology Files, Division <strong>of</strong> Financial and Information Services, Certified Enrollment<br />
Files.<br />
Table 92 shows a historical perspective <strong>of</strong> the number <strong>of</strong> districts, number <strong>of</strong> computers, and<br />
certified enrollment per enrollment category from 1995-1996 to 2002-2003. With few<br />
exceptions, the number <strong>of</strong> computers in each enrollment category continues to increase,<br />
despite the corresponding decrease in enrollment <strong>of</strong> districts with 600 students or more during<br />
the past six years.<br />
127
Table 92<br />
NUMBER OF COMPUTERS IN IOWA PUBLIC SCHOOLS<br />
BY ENROLLMENT CATEGORY<br />
1995-1996 AND 1997-1998 TO 2002-2003<br />
Enrollment Category<br />
250- 400- 600- 1,000- 2,500-<br />
The number <strong>of</strong> students per computer by district enrollment category for the school years<br />
1995-1996, 2001-2002, and 2002-2003 are presented in Figure 33. The ratio <strong>of</strong> students per<br />
computer continued to decrease in all enrollment categories except for districts with<br />
enrollment greater than 7,500 students. When compared with the 2001-2002 information, the<br />
largest districts in the state showed a slight increase in 2002-2003 rising from 4.4 to 4.5<br />
students per computer. Student computer accessibility continued to improve as the overall<br />
state’s average pupil-to-computer rate continued to decrease over time.<br />
Figure 33<br />
PUPILS PER COMPUTER IN IOWA PUBLIC SCHOOLS<br />
BY ENROLLMENT CATEGORY<br />
1995-1996, 2001-2002 AND 2002-2003<br />
<strong>State</strong> Averages<br />
7.2 3.9 3.7<br />
1995-1996 2001-2002 2002-2003<br />
Number <strong>of</strong> Pupils per Computer<br />
10<br />
9<br />
8<br />
7<br />
6<br />
5<br />
4<br />
3<br />
2<br />
1<br />
0<br />
6.0<br />
6.1<br />
7.6<br />
8.2<br />
8.9<br />
5.4<br />
3.1<br />
2.7<br />
4.7<br />
3.0<br />
2.6<br />
3.3<br />
3.1<br />
3.6<br />
3.4<br />
3.7<br />
3.6<br />
4.3<br />
4.0<br />
4.4<br />
4.5<br />
Table 93<br />
2000-2001<br />
NUMBER OF COMPUTERS AND PUPIL-TO-COMPUTER RATIOS IN<br />
IOWA PUBLIC SCHOOL DISTRICTS BY<br />
GRADE LEVEL WITHIN ENROLLMENT CATEGORY<br />
2000-2001 TO 2002-2003<br />
Enrollment Category<br />
250- 400- 600- 1,000- 2,500-<br />
When analyzed by percentages in Table 94, districts with enrollment below 2,500 students<br />
continued to show greater student access to computers than larger districts. During the past<br />
seven years, smaller districts (those with enrollments below 2,500) averaged approximately<br />
59 percent <strong>of</strong> the total computers dedicated to student use while having approximately 53<br />
percent <strong>of</strong> the state’s enrollment. In 2002-2003, the larger districts had 47 percent <strong>of</strong> the<br />
student enrollment while having 41 percent <strong>of</strong> the computers.<br />
Table 94<br />
DISTRIBUTION OF COMPUTERS AND CERTIFIED ENROLLMENTS<br />
IN IOWA PUBLIC SCHOOL DISTRICTS<br />
1995-1996 AND 1997-1998 TO 2002-2003<br />
Enrollment Category<br />
250- 400- 600- 1,000- 2,500-<br />
1995-1996
Project EASIER<br />
(Electronic Access System for <strong>Iowa</strong> Education Records) Records)<br />
New reporting requirements for No Child Left Behind (NCLB) and other federal initiatives<br />
are greatly increasing state and local data collection requirements.<br />
Project EASIER (Electronic Access System for <strong>Iowa</strong> Education Records) is the <strong>Iowa</strong><br />
Department <strong>of</strong> Education’s initiative to re-engineer the collection and reporting <strong>of</strong> information<br />
from school districts through the use <strong>of</strong> individual student records. The Project’s three major<br />
components are: 1) sending individual student data electronically from <strong>Iowa</strong> school districts<br />
to the Department <strong>of</strong> Education to develop state and federal reports, 2) electronically sending<br />
high school transcripts to colleges and universities, and 3) enabling school districts to<br />
electronically exchange student records when students transfer.<br />
The goal <strong>of</strong> Project EASIER is to reduce data burden, encourage better decision-making by<br />
establishing and maintaining a cost-effective method <strong>of</strong> accessing and transferring accurate<br />
and timely education information among school districts, postsecondary institutions and the<br />
<strong>Iowa</strong> Department <strong>of</strong> Education.<br />
Almost all <strong>of</strong> <strong>Iowa</strong>’s public school districts maintain their student data in some type <strong>of</strong><br />
electronic student information system. In order for electronic trading <strong>of</strong> information to occur<br />
in <strong>Iowa</strong>, the data elements in a local student information system are mapped to a set <strong>of</strong> standard<br />
codes. This standard set <strong>of</strong> codes allows for the transmission <strong>of</strong> data from one file format to<br />
a totally different file format with neither the sender nor the receiver having to make any<br />
changes to their file. This is particularly important for Project EASIER participants because<br />
regardless <strong>of</strong> the student information system s<strong>of</strong>tware in place at a local school district, the<br />
system can be used without modifying existing local codes.<br />
The current major focus <strong>of</strong> the Project is to obtain statewide participation <strong>of</strong> all school districts,<br />
expand the amount <strong>of</strong> information collected, and the creation <strong>of</strong> a uniform statewide student<br />
identification system.<br />
Project EASIER grew from six sites in the 1995-1996 school year. Currently, a majority <strong>of</strong><br />
<strong>Iowa</strong> districts, 341 <strong>of</strong> 371, as well as two nonpublic high schools are involved (Table 95 and<br />
Figure 34). By the close <strong>of</strong> the 2002-2003 school year, 91.9 percent <strong>of</strong> <strong>Iowa</strong>’s 371 public<br />
districts were enabled to participate in the Department’s initiative.<br />
Table 95<br />
PARTICIPATING PUBLIC SCHOOL DISTRICTS<br />
IN PROJECT EASIER<br />
1995-1996 TO 2002-2003<br />
1995- 1996- 1997- 1998- 1999- 2000- 2001- 2002-<br />
1996 1997 1998 1999 2000 2001 2002 2003<br />
Total Districts 384 379 377 375 375 374 371 371<br />
Participation<br />
Number 6 34 42 150* 217 226* 229** 341**<br />
Percent 1.6% 9.0% 11.1% 40.0% 57.9% 60.4% 61.7% 91.9%<br />
132<br />
Source:<br />
Notes:<br />
<strong>Iowa</strong> Department <strong>of</strong> Education, Bureau <strong>of</strong> Planning, Research, and Evaluation, Project EASIER<br />
Site Records.<br />
*Participating <strong>Iowa</strong> school districts as <strong>of</strong> the end <strong>of</strong> July. Participation in electronic data<br />
interchange efforts involves a number <strong>of</strong> readiness stages and not all districts transmitted<br />
student records electronically.<br />
**Enabled districts.
Figure 34<br />
PARTICIPATING PUBLIC SCHOOL DISTRICTS<br />
IN PROJECT EASIER<br />
1995-1996 TO 2002-2003<br />
450<br />
Total Districts<br />
Participation Number<br />
400<br />
350<br />
384 379 377 375 375 374 371 371<br />
341<br />
Number <strong>of</strong> Districts<br />
Source:<br />
Notes:<br />
300<br />
250<br />
200<br />
150<br />
100<br />
50<br />
0<br />
6<br />
1995-<br />
1996<br />
1996-<br />
1997<br />
34 42<br />
1997-<br />
1998<br />
150<br />
217<br />
1998- 1999-<br />
1999 2000<br />
Year<br />
2000-<br />
2001<br />
226<br />
2001-<br />
2002<br />
229<br />
2002-<br />
2003<br />
<strong>Iowa</strong> Department <strong>of</strong> Education, Bureau <strong>of</strong> Planning, Research, and Evaluation, Project EASIER<br />
Site Records.<br />
*Participation in electronic data interchange efforts involves a number <strong>of</strong> readiness stages and<br />
not all districts transmitted student records electronically. Enabled districts are shown in<br />
2001-2002 and 2002-2003.<br />
Program<br />
Table 96 shows Project EASIER school districts by AEA. AEAs 1, 6 and 16 have 100 percent<br />
<strong>of</strong> their districts enabled in Project EASIER. Only one school remains to be enabled in AEAs<br />
2, 9 and 13. AEA 12 has the most schools that have not yet been enabled.<br />
Table 96<br />
DISTRIBUTION OF IOWA PROJECT EASIER<br />
ENABLED SITES BY AREA EDUCATION AGENCY<br />
2002-2003<br />
Area Total Number Number <strong>of</strong> Percent <strong>of</strong><br />
Education Agency <strong>of</strong> Districts Enabled Sites Districts Enabled<br />
1 25 25 100.0%<br />
2 24 23 95.8<br />
3 18 15 83.3<br />
4 14 12 85.7<br />
5 31 29 93.5<br />
6 14 14 100.0<br />
7 23 21 91.3<br />
9 22 21 95.5<br />
10 33 30 90.9<br />
11 55 49 89.1<br />
12 24 20 83.3<br />
13 31 30 96.8<br />
14 20 17 85.0<br />
15 24 22 91.7<br />
16 13 13 100.0<br />
<strong>State</strong> 371 341 91.9<br />
Source:<br />
<strong>Iowa</strong> Department <strong>of</strong> Education, Bureau <strong>of</strong> Planning, Research, and Evaluation, Project EASIER<br />
Site Records.<br />
133
Table 97 shows the number <strong>of</strong> public school districts satisfying part <strong>of</strong> their annual Basic<br />
Educational Data Survey (BEDS) reporting requirements through Project EASIER. The<br />
number <strong>of</strong> districts that sent data through Project EASIER increased during the 2002-2003<br />
school year by almost 45 percent over last year. In the 2002-2003 school year 78.4 percent<br />
<strong>of</strong> public school districts transmitted data electronically via Project EASIER for the Spring<br />
BEDS data collection.<br />
Table 97<br />
DISTRICTS TRANSMITTING BASIC EDUCATIONAL DATA SURVEY<br />
VIA PROJECT EASIER, 1995-1996 TO 2002-2003<br />
Total Districts Percent<br />
Year Districts Transmitting Transmitting<br />
1995-1996 384 1 0.3%<br />
1996-1997 379 4 1.1<br />
1997-1998 377 21 5.6<br />
1998-1999 375 98 26.1<br />
1999-2000 375 130 34.7<br />
2000-2001 374 180 48.1<br />
2001-2002 371 201 54.2<br />
2002-2003 371 291 78.4<br />
Source:<br />
Note:<br />
<strong>Iowa</strong> Department <strong>of</strong> Education, Bureau <strong>of</strong> Planning, Research, and Evaluation, Project EASIER<br />
Transmission Log.<br />
There are currently seven student-based annual BEDS reports transmitted electronically by<br />
participating Project EASIER sites.<br />
In 2001-2002, Project EASIER was expanded to enable some high schools to send transcripts<br />
electronically to <strong>Iowa</strong> <strong>State</strong> University and the University <strong>of</strong> Northern <strong>Iowa</strong>. During the 2002-<br />
2003 school year, a new interactive web-based system was implemented to increase the<br />
efficiency <strong>of</strong> BEDS transmissions. The next phases <strong>of</strong> the project will include the sending <strong>of</strong><br />
electronic transcripts from all <strong>Iowa</strong> schools to postsecondary institutions as well as the<br />
electronic transmission <strong>of</strong> data from district to district as students transfer schools.<br />
For additional information on Project EASIER, visit the Project EASIER web site at:<br />
http://www.state.ia.us/educate/fis/pre/pe/index.html<br />
134
Early Childhood Education<br />
Child development/preschool, school-age child care, and kindergarten program data are<br />
collected each spring through the Basic Educational Data Survey (BEDS) Early Childhood<br />
report. Through the Early Childhood report, public districts report the types <strong>of</strong> programs they<br />
<strong>of</strong>fer and the number <strong>of</strong> children served.<br />
The trend in <strong>Iowa</strong> kindergarten programs is a movement towards all-day, everyday twosemester<br />
programs. Table 98 lists the number <strong>of</strong> districts <strong>of</strong>fering all-day, everyday twosemester<br />
kindergarten as their predominant kindergarten program. In 1985-1986, 25.2<br />
percent <strong>of</strong> public districts <strong>of</strong>fered all-day kindergarten as their primary program and by<br />
2002-2003 the figure grew to 94.3 percent.<br />
Table 98<br />
NUMBER AND PERCENT OF IOWA PUBLIC SCHOOL DISTRICTS OFFERING<br />
ALL-DAY, EVERYDAY, TWO-SEMESTER<br />
KINDERGARTEN PROGRAMS — 1985-1986 TO 2002-2003<br />
Year Number <strong>of</strong> Districts Percent <strong>of</strong> Districts<br />
1985-1986 110 25.2%<br />
1986-1987 120 27.5<br />
1987-1988 134 30.7<br />
1988-1989 151 34.9<br />
1989-1990 163 37.8<br />
1990-1991 180 41.9<br />
1991-1992 199 46.8<br />
Program<br />
1992-1993 219 52.4<br />
1993-1994 228 57.4<br />
1994-1995 242 62.1<br />
1995-1996 257 66.9<br />
1996-1997 258 68.1<br />
1997-1998 279 74.0<br />
1998-1999 290 77.3<br />
1999-2000 305 81.3<br />
2000-2001 339 90.6<br />
2001-2002 347 93.5<br />
2002-2003 350 94.3<br />
Source:<br />
Note:<br />
<strong>Iowa</strong> Department <strong>of</strong> Education, Bureau <strong>of</strong> Planning, Research, and Evaluation, Basic Educational<br />
Data Survey, Policies and Procedures and Early Childhood Files.<br />
Prior to 2002-2003, districts reported one program type as their predominant kindergarten<br />
program. Starting in 2002-2003 the predominant program was selected based on the program<br />
<strong>of</strong>fered by the largest number <strong>of</strong> buildings in the district.<br />
135
In 2002-2003, all-day, everyday two-semester kindergarten was the leading program for 350<br />
districts. Other programs <strong>of</strong>fered by <strong>Iowa</strong> districts included: half day two semesters; half day<br />
one semester – full day one semester; alternate day one semester – full day one semester; and<br />
three day a week one semester – full day one semester.<br />
The percentage <strong>of</strong> districts <strong>of</strong>fering all-day, everyday two-semester kindergarten varies by the<br />
enrollment category <strong>of</strong> the district. Table 99 and Figure 35 give the percentage <strong>of</strong> districts by<br />
enrollment category in 2002-2003. Districts in enrollment categories <strong>of</strong> less than 2,500 that<br />
<strong>of</strong>fered all-day, everyday two-semester kindergarten on average had over 92 percent participation<br />
while the two largest enrollment categories each averaged less than the 90 percent<br />
participation.<br />
Table 99<br />
IOWA PUBLIC SCHOOL KINDERGARTEN PROGRAM TYPE — 2002-2003<br />
All-Day, Everyday, 2 Semesters All Others<br />
Kindergarten Program Type<br />
Enrollment Total Number Number <strong>of</strong> Percent in Number <strong>of</strong> Percent in<br />
Category <strong>of</strong> Districts Districts All-Day, Everyday, Category Districts thers Category<br />
The number <strong>of</strong> children attending a preschool/child development program for children 3, 4,<br />
and 5 years <strong>of</strong> age at public districts increased, 23.6 percent, over the past six years, from 6,860<br />
in 1997-1998 to 8,477 in 2002-2003 (see Tables 100 and 101). For 2002-2003, the largest<br />
number <strong>of</strong> children, 3,584, attended a tuition program, followed by 1,431 in a Head Start<br />
program and 941 in a Child Development Coordinating Council program.<br />
Table 100<br />
IOWA PUBLIC SCHOOL PRESCHOOL ENROLLMENT<br />
BY ENROLLMENT CATEGORY<br />
1997-1998 TO 2002-2003<br />
Preschool Enrollment<br />
Enrollment 1997- 1998- 1999- 2000- 2001- 2002-<br />
Category 1998 1999 2000 2001 2002 2003<br />
138
STUDENT PERFORMANCE<br />
Information presented in the student performance section comes from a variety <strong>of</strong> external<br />
sources and the Department <strong>of</strong> Education, Basic Educational Data Survey (BEDS). The BEDS<br />
data used in the student performance section provides information pertaining to <strong>Iowa</strong><br />
dropouts for grades 7-12, high school graduation rates, high school graduates intentions, and<br />
<strong>Iowa</strong> postsecondary enrollment options for high school students. External sources <strong>of</strong> information<br />
presented in this section include: Advanced Placement (AP), American College Testing<br />
(ACT), the College Board for the Scholastic Assessment Test (SAT), the <strong>Iowa</strong> Testing<br />
Programs for the <strong>Iowa</strong> Tests <strong>of</strong> Basic Skills (ITBS) and the <strong>Iowa</strong> Tests <strong>of</strong> Educational<br />
Development (ITED), and the National Center for Educational Statistics (NCES). Some<br />
additional data on the National Assessment <strong>of</strong> Educational Progress (NAEP) for fourth grade<br />
reading are also available in this section based on the source <strong>of</strong> U.S. Department <strong>of</strong> Education.<br />
Information provided in this chapter is divided into two sections. The section detailing <strong>State</strong><br />
Indicators <strong>of</strong> Student Success reports data that are required by <strong>Iowa</strong> Administrative Code. The<br />
second section provides trend data on student achievement and performance comparisons<br />
between <strong>Iowa</strong>, other states, and the nation. Comparisons are also made across enrollment<br />
categories, gender, race/ethnicity, and other subgroups when data is available.<br />
<strong>State</strong> Indicators <strong>of</strong> Student Success<br />
<strong>State</strong> indicators are required to be collected by schools or school districts pursuant to <strong>Iowa</strong><br />
Administrative Code – 12.8(3) to meet reporting requirements. The state indicators required<br />
to be reported are: 1) The percentage <strong>of</strong> all fourth, eighth, and eleventh grade students<br />
achieving a pr<strong>of</strong>icient or higher reading status on the ITBS and ITED; 2) The percentage <strong>of</strong><br />
all fourth, eighth, and eleventh grade students achieving a pr<strong>of</strong>icient or higher mathematics<br />
status on the ITBS and ITED; 3) The percentage <strong>of</strong> all eighth and eleventh grade students<br />
achieving a pr<strong>of</strong>icient or higher science status on the ITBS and ITED; 4) The percentage <strong>of</strong><br />
students considered as dropouts for grades 7 to 12 and the percentage <strong>of</strong> high school students<br />
who graduate; 5) The percentage <strong>of</strong> high school seniors who intend to pursue postsecondary<br />
education/training; 6) The percentage <strong>of</strong> high school students achieving an ACT national<br />
average score or above and the percentage <strong>of</strong> students achieving an ACT score <strong>of</strong> 20 or above;<br />
and 7) The percentage <strong>of</strong> high school graduates who complete a “core” high school program<br />
<strong>of</strong> four years <strong>of</strong> English-language arts and three or more years each <strong>of</strong> mathematics, science,<br />
and social studies.<br />
Subgroup data are shown for gender, race/ethnicity, socioeconomic status (determined by<br />
eligibility for free or reduced price lunch), disability status (determined by the presence <strong>of</strong> an<br />
individualized education plan – IEP), primary language status (determined by English and<br />
English Language Learner), and migrant/non-migrant status (defined by Title I requirements)<br />
where available.<br />
The following statements, prepared by the staff at <strong>Iowa</strong> Testing Programs have been included<br />
to provide guidance in interpreting biennium period, national norm effect, and achievement<br />
level definitions.<br />
The biennium summaries <strong>of</strong> <strong>Iowa</strong> statewide achievement data describe student performance<br />
in reading and mathematics on the <strong>Iowa</strong> Tests <strong>of</strong> Basic Skills and the <strong>Iowa</strong> Tests <strong>of</strong><br />
Educational Development. The purpose <strong>of</strong> the summaries is to use scores from two consecutive<br />
school years to describe annual achievement changes.<br />
STUDENT PERFORMANCE — <strong>State</strong> Indicators <strong>of</strong> Student Success<br />
139
For many years, statewide achievement data from the ITBS and ITED were shown as average<br />
scores for each <strong>of</strong> grades 3-12 in The Annual Condition <strong>of</strong> Education Report. Beginning in<br />
the 1996-1997 school year, achievement levels were used to report system and building<br />
results to each school district in <strong>Iowa</strong>. These achievement levels also have been made<br />
available to describe <strong>Iowa</strong> statewide achievement trends in the Report. One advantage <strong>of</strong><br />
using achievement levels instead <strong>of</strong> only average scores is that achievement levels permit the<br />
user to view a broad range <strong>of</strong> student performance rather than simply seeing how the average<br />
student in each grade scored. That is, with achievement levels, the performance <strong>of</strong> high<br />
achieving and low achieving groups <strong>of</strong> students can be tracked over time; the use <strong>of</strong> average<br />
scores alone only permits the tracking <strong>of</strong> the average student.<br />
Scores are combined for pairs <strong>of</strong> consecutive years for the biennium reporting for several<br />
reasons. The merging <strong>of</strong> test results from two years provides greater stability in the<br />
information than would be apparent if results from each single year were used. Because all<br />
<strong>Iowa</strong> schools have not always tested every year in each <strong>of</strong> the three grades used for reporting<br />
(4, 8, and 11), annual data are subject to fluctuations due to these inconsistent annual testing<br />
patterns. Two-year averages help overcome this problem.<br />
The most recent biennium data reported, 2001-2003, are based on national norms from 2000.<br />
Because the biennium data for 2000-2002 are based on national norms from 1992, the annual<br />
change represented by the difference between the data from these two bienniums is influenced<br />
by whatever differences exist between the norms from 1992 to 2000. Each biennium<br />
difference is due to a norms change plus a real change in achievement. For each grade and<br />
subject area reported, <strong>Iowa</strong> Testing Programs has estimated the effect <strong>of</strong> the norms change.<br />
The estimate can be used to remove the effect <strong>of</strong> the norms change so that the remainder<br />
represents the real change in achievement. For example, for grade 4 Reading Comprehension,<br />
the change in biennium values for the Low level is 6.8 percent (31.0 - 24.2). The estimated<br />
change just due to the norms is 5.5 percent. This means that there were 1.3 percent fewer<br />
students in the Low level due to real change. Or, the gain in achievement is represented by 1.3<br />
percent more students performing beyond the Low level. The estimated effects due to the<br />
norms change for Reading Comprehension in grades 4, 8, and 11 are -5.5 percent, 0.0 percent,<br />
and 0.0 percent, respectively. The corresponding values for math are: 0.0 percent, +2.0<br />
percent, and +3.3 percent.<br />
The <strong>Iowa</strong> Department <strong>of</strong> Education has defined the “Pr<strong>of</strong>icient” level as the Intermediate and<br />
High combined. Using the values for the norms effect shown in the previous paragraph, the<br />
actual or real changes in the percent <strong>of</strong> students in grades 4, 8, and 11 performing at the<br />
Pr<strong>of</strong>icient level in reading are, respectively, +1.4 percent, -0.1 percent, and -0.1 percent. For<br />
math, the corresponding changes are +2.6 percent, +0.5 percent, and +1.2 percent. These<br />
adjusted changes should be used to interpret the extent <strong>of</strong> improvement in statewide student<br />
performance over the past year.<br />
Several additional pieces <strong>of</strong> information about the achievement level summaries are needed<br />
for interpretive purposes. These are outlined below:<br />
1. The approximate number <strong>of</strong> students per grade per year upon which the percentages for<br />
2002-2003 are based are: grade 4, 38,500; grade 8, 40,600; and grade 11, 37,000.<br />
140<br />
2. Forms K and L <strong>of</strong> both test batteries were first used in <strong>Iowa</strong> in the 1993-1994 school year.<br />
Therefore, that year was chosen to develop baseline data that schools might use for<br />
beginning to establish goals and for describing local achievement trends. The baseline<br />
biennium is 1993-1995. Beginning in 2001-2002, Forms A and B with 2000 national<br />
norms were used in <strong>Iowa</strong> instead <strong>of</strong> Forms K and L, and the data for that year were adjusted<br />
to 1992 norms to compute the 2000-2002 biennium values reported here. For the 2001-<br />
2003 biennium, only the 2000 norms were used. norms were used in <strong>Iowa</strong> instead <strong>of</strong><br />
Forms K and L, and the data for that year were adjusted to 1992 norms to compute the<br />
2000-2002 biennium values reported here. For the 2001-2003 biennium, however, only<br />
the 2000 norms were used. (See the sixth paragraph above for further explanation.)
2. Forms K and L <strong>of</strong> both test batteries were first used in <strong>Iowa</strong> in the 1993-1994 school year.<br />
Therefore, that year was chosen to develop baseline data that schools might use for<br />
beginning to establish goals and for describing local achievement trends. The baseline<br />
biennium is 1993-1995. Beginning in 2001-2002, Forms A and B with 2000 national<br />
3. The estimates <strong>of</strong> the norms effect shown in the fourth paragraph <strong>of</strong> these notes are based<br />
on using 1992 national norms and 2000 national norms separately on the 2002-2003<br />
annual statewide data. These estimates should not be used by a school district as an<br />
estimate <strong>of</strong> the norms effect for their district or any building in it. These estimates can be<br />
obtained directly by using the values in the red and green achievement levels reports<br />
furnished to each <strong>Iowa</strong> school district with their ITBS/ITED test results in 2001-2002.<br />
4. The Achievement Levels Report for the ITBS and ITED is provided to <strong>Iowa</strong> schools to<br />
help describe the level <strong>of</strong> performance <strong>of</strong> student groups and monitor the progress <strong>of</strong><br />
groups over time. For each <strong>of</strong> the three main achievement levels—Low, Intermediate, and<br />
High—descriptors are included on the report to identify what the typical student in each<br />
level is able to do. The <strong>Iowa</strong> Department <strong>of</strong> Education has combined the Intermediate and<br />
High performance levels to define a single achievement level called “Pr<strong>of</strong>icient” as a<br />
student performance indicator. Pr<strong>of</strong>icient and Less-than-Pr<strong>of</strong>icient are labels being used<br />
to describe the performance <strong>of</strong> groups that are at or above an acceptable standard or below<br />
that standard, respectively. For accountability purposes, the <strong>Iowa</strong> Department <strong>of</strong> Education<br />
uses the national percentile rank scale from the ITBS and ITED. Low performance is the<br />
range 1-40, Intermediate is 41-89, and High is 90-99. Consequently, the Pr<strong>of</strong>icient range<br />
is percentile ranks 41-99 and the percentile ranks 1-40 are regarded as Less-than-<br />
Pr<strong>of</strong>icient.<br />
5. Comparisons <strong>of</strong> results from one grade to another are not appropriate because the<br />
corresponding descriptions <strong>of</strong> performance are not exactly the same from grade to grade.<br />
For example, “Low” in reading comprehension does not mean exactly the same thing at<br />
grade 4 and grade 11. Comparisons from one subject area to another are not appropriate<br />
because the corresponding descriptions <strong>of</strong> performance are much different from subject<br />
to subject. For example, “Low” in grade 4 reading comprehension does not mean the same<br />
thing as “Low” in grade 4 mathematics.<br />
6. Separate tables show achievement level performance for students by gender, racial/<br />
ethnic, disability, socioeconomic, primary language and migrant subgroups. These<br />
subgroups vary in size in a given biennium, and each varies in size from year to year. The<br />
subgroup data should not be averaged to obtain an overall value that matches the data for<br />
the combined group.<br />
STUDENT PERFORMANCE — <strong>State</strong> Indicators <strong>of</strong> Student Success<br />
141
Subgroup <strong>Iowa</strong> Student Counts for ITBS and ITED Reading<br />
and Mathematics Test-Takers: Grades 4, 8, and 11<br />
The first three state indicators are <strong>Iowa</strong> student performances on ITBS and ITED. They are<br />
defined as the percentages <strong>of</strong> all fourth, eighth, and eleventh grade students achieving a<br />
pr<strong>of</strong>icient or higher level on reading comprehension and mathematics and the percentages <strong>of</strong><br />
all eighth and eleventh grade students achieving a pr<strong>of</strong>icient or higher level on science. Tables<br />
102 and 103 show the approximate average number <strong>of</strong> students tested by grade and by<br />
subgroup for ITBS and ITED Reading Comprehension and mathematics tests for the<br />
biennium periods 1997-1999 to 2001-2003. Table 104 shows the approximate average<br />
number <strong>of</strong> grade 8 and 11 students tested by subgroup for ITBS and ITED science for the<br />
biennium period 2001-2003. The number <strong>of</strong> students tested includes both public and<br />
nonpublic school participates.<br />
Table 102<br />
APPROXIMATE AVERAGE NUMBER OF IOWA STUDENTS TESTED ON<br />
ITBS AND ITED READING TESTS BY SUBGROUP<br />
BIENNIUM PERIODS 1997-1999* TO 2001-2003<br />
Grade 4 Grade 8 Grade 11<br />
1998- 1999- 2000- 2001- 1998- 1999- 2000- 2001- 1998- 1999- 2000- 2001-<br />
2000 2001 2002 2003 2000 2001 2002 2003 2000 2001 2002 2003<br />
Male 19,700 19,600 20,200 19,970 19,800 19,800 20,000 20,620 15,300 16,000 17,300 18,490<br />
Female 19,000 19,600 19,800 19,360 19,000 18,900 19,200 19,740 15,800 16,300 17,380 18,240<br />
White 30,000 31,500 31,500 33,570 30,700 30,900 32,600 34,860 24,600 26,300 29,800 33,150<br />
African American 1,200 1,450 1,620 1,700 1,100 1,180 1,180 1,300 500 560 690 770<br />
Hispanic 900 1,150 1,880 1,510 800 960 1,030 1,160 460 560 640 770<br />
Asian 590 580 560 580 700 590 560 560 620 580 530 550<br />
American Indian 250 190 210 230 250 240 220 230 130 110 125 120<br />
Primary Lang. ELL 1 — 790 880 920 — 560 460 480 — 250 880 370<br />
Migrant 2 — 200 230 260 — 90 110 140 — 60 70 110<br />
SES Eligible 3 10,200 11,100 11,200 11,350 8,000 8,600 8,800 9,680 3,600 4,100 4,700 5,620<br />
IEP 4 5,400 5,520 4,900 4,460 5,000 4,900 5,400 5,630 1,800 2,200 2,650 3,340<br />
Source:<br />
Notes:<br />
<strong>Iowa</strong> Testing Programs, University <strong>of</strong> <strong>Iowa</strong>.<br />
Number tested included both public and nonpublic students.<br />
1<br />
English Language Learner (ELL) refers to a student who has a language other than English and the<br />
pr<strong>of</strong>iciency in English is such that the probability <strong>of</strong> the student’s academic success in an English-only<br />
classroom is below that <strong>of</strong> an academically successful peer with an English language background.<br />
2<br />
Migrant status is defined as migrant or non-migrant as follows: Migrant — a student is considered a<br />
migrant if he or she has moved in the past 36 months from one district to another so that the parents could<br />
obtain temporary or seasonal employment in agriculture as their principal means <strong>of</strong> livelihood.<br />
3<br />
SES refers to socioeconomic status as determined by eligibility for free or reduced price meals.<br />
4<br />
IEP indicates special education status, students with IEPs are classified as special education students.<br />
*The average number <strong>of</strong> <strong>Iowa</strong> male students who took ITBS/ITED in the biennium period 1997-1999<br />
was 19,000, 18,000, and 14,000 for grades 4, 8, and 11 respectively. The average numbers <strong>of</strong> <strong>Iowa</strong><br />
female students who took ITBS/ITED in the biennium period 1997-1999 were 18,000 for grades 4<br />
and 8, and 15,000 for grade 11.<br />
142
Table 103<br />
Source:<br />
Notes:<br />
APPROXIMATE AVERAGE NUMBER OF IOWA STUDENTS TESTED ON<br />
ITBS AND ITED MATHEMATICS TESTS BY SUBGROUP<br />
BIENNIUM PERIODS 1997-1999* TO 2001-2003<br />
Grade 4 Grade 8 Grade 11<br />
1998- 1999- 2000- 2001- 1998- 1999- 2000- 2001- 1998- 1999- 2000- 2001-<br />
2000 2001 2002 2003 2000 2001 2002 2003 2000 2001 2002 2003<br />
Male 19,400 20,295 20,295 19,940 19,700 19,600 19,734 20,420 15,600 16,500 17,500 18,450<br />
Female 19,000 19,900 19,800 19,330 18,900 18,700 18,900 19,550 16,100 16,800 17,600 18,190<br />
White 30,000 31,500 33,000 33,530 30,500 31,400 32,900 34,540 25,000 27,100 30,100 33,090<br />
African American 1,200 1,450 1,630 1,700 1,000 1,350 1,350 1,280 500 570 700 780<br />
Hispanic 900 1,160 1,380 1,500 820 1,100 1,180 1,160 480 590 650 760<br />
Asian 600 580 570 580 670 600 580 560 600 620 540 550<br />
American Indian 250 190 210 220 250 220 200 230 140 120 125 120<br />
Primary Lang. ELL 1 — 790 890 930 — 560 460 490 — 260 880 370<br />
Migrant 2 — 200 230 250 — 90 110 150 — 70 70 120<br />
SES Eligible 3 10,200 11,100 11,300 11,320 8,000 8,500 8,800 9,610 3,700 4,300 4,800 5,620<br />
IEP 4 5,500 5,600 5,000 4,480 4,900 4,800 5,300 5,580 1,800 2,300 2,700 3,350<br />
<strong>Iowa</strong> Testing Programs, University <strong>of</strong> <strong>Iowa</strong>.<br />
Number tested included both public and nonpublic students.<br />
1<br />
English Language Learner (ELL) refers to a student who has a language other than English and the<br />
pr<strong>of</strong>iciency in English is such that the probability <strong>of</strong> the student’s academic success in an English-only<br />
classroom is below that <strong>of</strong> an academically successful peer with an English language background.<br />
2<br />
Migrant status is defined as migrant or non-migrant as follows: Migrant — a student is considered a<br />
migrant if he or she has moved in the past 36 months from one district to another so that the parents<br />
could obtain temporary or seasonal employment in agriculture as their principal means <strong>of</strong> livelihood.<br />
3<br />
SES refers to socioeconomic status as determined by eligibility for free or reduced price meals.<br />
4<br />
IEP indicates special education status, students with IEPs are classified as special education students.<br />
*The average number <strong>of</strong> <strong>Iowa</strong> male students who took ITBS/ITED in the biennium period 1997-1999<br />
was 19,000, 18,000, and 14,000 for grades 4, 8, and 11 respectively. The average numbers <strong>of</strong> <strong>Iowa</strong><br />
female students who took ITBS/ITED in the biennium period 1997-1999 were 18,000 for grades 4<br />
and 8, and 15,000 for grade 11.<br />
STUDENT PERFORMANCE — <strong>State</strong> Indicators <strong>of</strong> Student Success<br />
143
Table 104<br />
APPROXIMATE AVERAGE NUMBER OF IOWA STUDENTS TESTED ON<br />
ITBS AND ITED SCIENCE TESTS BY SUBGROUP<br />
BIENNIUM PERIOD 2001-2003<br />
Grade 8 Grade 11<br />
Male 20,200 18,320<br />
Female 19,310 18,110<br />
White 34,240 32,900<br />
African American 1,240 760<br />
Hispanic 1,140 760<br />
Asian 560 550<br />
American Indian 230 120<br />
Primary Lang. ELL 1 480 360<br />
Migrant 2 150 110<br />
SES Eligible 3 9,480 5,570<br />
IEP 4 5,540 3,280<br />
Source:<br />
Notes:<br />
<strong>Iowa</strong> Testing Programs, University <strong>of</strong> <strong>Iowa</strong>.<br />
Number tested included both public and nonpublic students.<br />
1<br />
English Language Learner (ELL) refers to a student who has a language other than English and the<br />
pr<strong>of</strong>iciency in English is such that the probability <strong>of</strong> the student’s academic success in an English-only<br />
classroom is below that <strong>of</strong> an academically successful peer with an English language background.<br />
2<br />
Migrant status is defined as migrant or non-migrant as follows: Migrant — a student is considered a<br />
migrant if he or she has moved in the past 36 months from one district to another so that the parents could<br />
obtain temporary or seasonal employment in agriculture as their principal means <strong>of</strong> livelihood.<br />
3<br />
SES refers to socioeconomic status as determined by eligibility for free or reduced price meals.<br />
4<br />
IEP indicates special education status, students with IEPs are classified as special education students.<br />
Reading<br />
Indicator: Percentage <strong>of</strong> 4th, 8th, and 11th grade students achieving pr<strong>of</strong>icient or higher<br />
reading status on the ITBS Reading Comprehension Test or the ITED Reading Comprehension<br />
Test (Reported for all students and by gender, race/ethnicity, socioeconomic status,<br />
disability, primary language status, and migrant status).<br />
Figure 36<br />
PERCENT OF IOWA FOURTH GRADE STUDENTS PERFORMING AT OR<br />
ABOVE PROFICIENT LEVEL ON ITBS READING COMPREHENSION TEST<br />
BIENNIUM PERIODS 1993-1995 TO 2001-2003<br />
Percent<br />
100<br />
90<br />
80<br />
70<br />
60<br />
50<br />
40<br />
30<br />
20<br />
10<br />
0<br />
75.9<br />
71.4 71.3 70.6 69.8 68.6 67.7 67.8 69.0 70.4<br />
1992 Norms 2000 Norms<br />
1993-1995 1994-1996 1995-1997 1996-1998 1997-1999 1998-2000 1999-2001 2000-2002 2001-2003<br />
Biennium Period<br />
144<br />
Source:<br />
Note:<br />
<strong>Iowa</strong> Testing Programs, University <strong>of</strong> <strong>Iowa</strong>.<br />
Percentages for each biennium period represent average percentages <strong>of</strong> pr<strong>of</strong>icient students for the<br />
two school years represented, e.g. 2001-2003 represents the average for the 2001-2002 and the<br />
2002-2003 school years. A student designated as pr<strong>of</strong>icient can, at a minimum, do the following:<br />
Usually understands factual information and new words in context.<br />
Usually is able to make inferences and interpret either nonliteral language or information in new<br />
contexts. Often can determine a selection’s main idea and analyze its style and structure.
Figure 37A<br />
Source:<br />
Note:<br />
Percent<br />
100<br />
90<br />
80<br />
70<br />
60<br />
50<br />
40<br />
30<br />
20<br />
10<br />
0<br />
Figure 37B<br />
Source:<br />
Note:<br />
PERCENT OF IOWA FOURTH GRADE STUDENTS<br />
PERFORMING AT OR ABOVE PROFICIENT LEVEL ON<br />
ITBS READING COMPREHENSION TEST BY GENDER<br />
BIENNIUM PERIODS 1997-1999 TO 2001-2003 (1992 NORMS)<br />
71.8 70.9 70.9 71.8 72.6<br />
65.4 64.6 64.9 66.4 68.1<br />
1997-1999 1998-2000 1999-2001 2000-2002 2001-2003<br />
Biennium Period<br />
Percent<br />
100<br />
90<br />
80<br />
70<br />
60<br />
50<br />
40<br />
30<br />
20<br />
10<br />
0<br />
78.1<br />
Female<br />
Female<br />
<strong>Iowa</strong> Testing Programs, University <strong>of</strong> <strong>Iowa</strong>.<br />
Percentages for each biennium period represent average percentages <strong>of</strong> pr<strong>of</strong>icient students for the two<br />
school years represented, e.g. 2001-2003 represents the average for the 2001-2002 and the 2002-2003<br />
school years. A student designated as pr<strong>of</strong>icient can, at a minimum, do the following:<br />
Usually understands factual information and new words in context.<br />
Usually is able to make inferences and interpret either nonliteral language or information in new<br />
contexts. Often can determine a selection’s main idea and analyze its style and structure.<br />
Gender<br />
Male<br />
PERCENT OF IOWA FOURTH GRADE STUDENTS<br />
PERFORMING AT OR ABOVE PROFICIENT LEVEL ON<br />
ITBS READING COMPREHENSION TEST BY GENDER<br />
BIENNIUM PERIOD 2001-2003 (2000 NORMS)<br />
73.7<br />
Male<br />
<strong>Iowa</strong> Testing Programs, University <strong>of</strong> <strong>Iowa</strong>.<br />
A student designated as pr<strong>of</strong>icient can, at a minimum, do the following:<br />
Usually understands factual information and new words in context.<br />
Usually is able to make inferences and interpret either nonliteral language or information in new<br />
contexts. Often can determine a selection’s main idea and analyze its style and structure.<br />
STUDENT PERFORMANCE — <strong>State</strong> Indicators <strong>of</strong> Student Success<br />
145
Figure 38A<br />
PERCENT OF IOWA FOURTH GRADE STUDENTS<br />
PERFORMING AT OR ABOVE PROFICIENT LEVEL ON<br />
ITBS READING COMPREHENSION TEST BY RACE/ETHNICITY<br />
BIENNIUM PERIODS 1998-2000 TO 2001-2003 (1992 NORMS)<br />
Percent<br />
100<br />
90<br />
80<br />
70<br />
60<br />
50<br />
40<br />
30<br />
20<br />
10<br />
0<br />
69.6<br />
69.8<br />
71.5<br />
73.3<br />
39.5<br />
38.8<br />
1998-2000 1999-2001<br />
2000-2002 2001-2003<br />
40.6<br />
39.4<br />
47.0<br />
45.1<br />
44.6<br />
White African American Hispanic Asian American Indian<br />
Race/Ethnicity<br />
45.2<br />
61.7<br />
64.5<br />
65.2<br />
71.2<br />
50.2<br />
47.2<br />
52.8<br />
52.6<br />
Source:<br />
Note:<br />
<strong>Iowa</strong> Testing Programs, University <strong>of</strong> <strong>Iowa</strong>.<br />
Percentages for each biennium period represent average percentages <strong>of</strong> pr<strong>of</strong>icient students for<br />
the two school years represented, e.g. 2001-2003 represents the average for the 2001-2002 and<br />
the 2002-2003 school years. A student designated as pr<strong>of</strong>icient can, at a minimum, do the following:<br />
Usually understands factual information and new words in context.<br />
Usually is able to make inferences and interpret either nonliteral language or information in new<br />
contexts. Often can determine a selection’s main idea and analyze its style and structure.<br />
Figure 38B<br />
PERCENT OF IOWA FOURTH GRADE STUDENTS<br />
PERFORMING AT OR ABOVE PROFICIENT LEVEL ON<br />
ITBS READING COMPREHENSION TEST BY RACE/ETHNICITY<br />
BIENNIUM PERIOD 2001-2003 (2000 NORMS)<br />
Percent<br />
100<br />
90<br />
80<br />
70<br />
60<br />
50<br />
40<br />
30<br />
20<br />
10<br />
0<br />
78.6<br />
White<br />
48.4<br />
African<br />
American<br />
52.6<br />
75.5<br />
60.6<br />
Hispanic Asian American<br />
Indian<br />
Race/Ethnicity<br />
Source:<br />
Note:<br />
<strong>Iowa</strong> Testing Programs, University <strong>of</strong> <strong>Iowa</strong>.<br />
A student designated as pr<strong>of</strong>icient can, at a minimum, do the following:<br />
Usually understands factual information and new words in context.<br />
Usually is able to make inferences and interpret either nonliteral language or information in new<br />
contexts. Often can determine a selection’s main idea and analyze its style and structure.<br />
146
Figure 39A<br />
Source:<br />
Notes:<br />
PERCENT OF IOWA FOURTH GRADE STUDENTS<br />
PERFORMING AT OR ABOVE PROFICIENT LEVEL ON<br />
ITBS READING COMPREHENSION TEST BY SOCIOECONOMIC STATUS*<br />
Percent<br />
Figure 39B<br />
100<br />
90<br />
80<br />
70<br />
60<br />
50<br />
40<br />
30<br />
20<br />
10<br />
0<br />
Percent<br />
BIENNIUM PERIODS 1998-2000 TO 2001-2003 (1992 NORMS)<br />
100<br />
90<br />
80<br />
70<br />
60<br />
50<br />
40<br />
30<br />
20<br />
10<br />
0<br />
51.1<br />
50.3<br />
52.0<br />
60.5<br />
53.5<br />
Eligible for Free or Reduced Price Meals Not Eligible for Free or Reduced Price Meals<br />
Socioeconomic Status<br />
Eligible for Free or Reduced Price<br />
Meals<br />
1998-2000 1999-2001<br />
2000-2002 2001-2003<br />
<strong>Iowa</strong> Testing Programs, University <strong>of</strong> <strong>Iowa</strong>.<br />
Percentages for each biennium period represent average percentages <strong>of</strong> pr<strong>of</strong>icient students for the<br />
two school years represented, e.g. 2001-2003 represents the average for the 2001-2002 and the<br />
2002-2003 school years. A student designated as pr<strong>of</strong>icient can, at a minimum, do the following:<br />
Usually understands factual information and new words in context.<br />
Usually is able to make inferences and interpret either nonliteral language or information in new<br />
contexts. Often can determine a selection’s main idea and analyze its style and structure.<br />
*Socioeconomic Status is determined by eligibility for free or reduced price meals.<br />
74.7<br />
Socioeconomic Status<br />
74.6<br />
82.2<br />
75.7<br />
PERCENT OF IOWA FOURTH GRADE STUDENTS<br />
PERFORMING AT OR ABOVE PROFICIENT LEVEL ON<br />
ITBS READING COMPREHENSION TEST BY SOCIOECONOMIC STATUS*<br />
Source:<br />
Notes:<br />
BIENNIUM PERIOD 2001-2003 (2000 NORMS)<br />
Not Eligible for Free or Reduced<br />
Price Meals<br />
<strong>Iowa</strong> Testing Programs, University <strong>of</strong> <strong>Iowa</strong>.<br />
A student designated as pr<strong>of</strong>icient can, at a minimum, do the following:<br />
Usually understands factual information and new words in context.<br />
Usually is able to make inferences and interpret either nonliteral language or information in new<br />
contexts. Often can determine a selection’s main idea and analyze its style and structure.<br />
*Socioeconomic Status is determined by eligibility for free or reduced price meals.<br />
77.2<br />
STUDENT PERFORMANCE — <strong>State</strong> Indicators <strong>of</strong> Student Success<br />
147
Figure 40A<br />
PERCENT OF IOWA FOURTH GRADE STUDENTS<br />
PERFORMING AT OR ABOVE PROFICIENT LEVEL ON<br />
ITBS READING COMPREHENSION TEST BY DISABILITY STATUS*<br />
BIENNIUM PERIODS 1998-2000 TO 2001-2003 (1992 NORMS)<br />
Percent<br />
100<br />
90<br />
80<br />
70<br />
60<br />
50<br />
40<br />
30<br />
20<br />
10<br />
0<br />
36.6<br />
35.2<br />
1998-2000 1999-2001<br />
2000-2002 2001-2003<br />
28.5<br />
Disability<br />
23.3<br />
Disability Status<br />
72.7<br />
73.0<br />
74.6<br />
No Disability<br />
73.8<br />
Source:<br />
Notes:<br />
<strong>Iowa</strong> Testing Programs, University <strong>of</strong> <strong>Iowa</strong>.<br />
Percentages for each biennium period represent average percentages <strong>of</strong> pr<strong>of</strong>icient students for the<br />
two school years represented, e.g. 2001-2003 represents the average for the 2001-2002 and the<br />
2002-2003 school years. A student designated as pr<strong>of</strong>icient can, at a minimum, do the following:<br />
Usually understands factual information and new words in context.<br />
Usually is able to make inferences and interpret either nonliteral language or information in new<br />
contexts. Often can determine a selection’s main idea and analyze its style and structure.<br />
*Disability Status is determined by the presence <strong>of</strong> an individualized education plan (IEP).<br />
Figure 40B<br />
PERCENT OF IOWA FOURTH GRADE STUDENTS<br />
PERFORMING AT OR ABOVE PROFICIENT LEVEL ON<br />
ITBS READING COMPREHENSION TEST BY DISABILITY STATUS*<br />
BIENNIUM PERIOD 2001-2003 (2000 NORMS)<br />
Percent<br />
100<br />
90<br />
80<br />
70<br />
60<br />
50<br />
40<br />
30<br />
20<br />
10<br />
0<br />
29.1<br />
Disability<br />
84.4<br />
No Disability<br />
Disability Status<br />
Source:<br />
Notes:<br />
<strong>Iowa</strong> Testing Programs, University <strong>of</strong> <strong>Iowa</strong>.<br />
A student designated as pr<strong>of</strong>icient can, at a minimum, do the following:<br />
Usually understands factual information and new words in context.<br />
Usually is able to make inferences and interpret either nonliteral language or information in<br />
new contexts. Often can determine a selection’s main idea and analyze its style and structure.<br />
*Disability Status is determined by the presence <strong>of</strong> an individualized education plan (IEP).<br />
148
Figure 41A<br />
Source:<br />
Notes:<br />
Figure 41B<br />
PERCENT OF IOWA FOURTH GRADE STUDENTS PERFORMING<br />
AT OR ABOVE PROFICIENT LEVEL ON ITBS READING<br />
COMPREHENSION TEST BY PRIMARY LANGUAGE STATUS*<br />
BIENNIUM PERIODS 1999-2001 TO 2001-2003 (1992 NORMS)<br />
Percent<br />
100<br />
90<br />
80<br />
70<br />
60<br />
50<br />
40<br />
30<br />
20<br />
10<br />
0<br />
Percent<br />
100<br />
90<br />
80<br />
70<br />
60<br />
50<br />
40<br />
30<br />
20<br />
10<br />
0<br />
46.6<br />
40.6<br />
ELL*<br />
38.4<br />
ELL*<br />
1999-2001<br />
2000-2002<br />
2001-2003<br />
34.6<br />
Primary Language Status<br />
68.4<br />
Primary Language Status<br />
69.9<br />
English<br />
<strong>Iowa</strong> Testing Programs, University <strong>of</strong> <strong>Iowa</strong>.<br />
Percentages for each biennium period represent average percentages <strong>of</strong> pr<strong>of</strong>icient students for the two<br />
school years represented, e.g. 2001-2003 represents the average for the 2001-2002 and the 2002-2003<br />
school years. A student designated as pr<strong>of</strong>icient can, at a minimum, do the following:<br />
Usually understands factual information and new words in context.<br />
Usually is able to make inferences and interpret either nonliteral language or information in new contexts.<br />
Often can determine a selection’s main idea and analyze its style and structure.<br />
*Primary Language Status is classified by English and English Language Learner and determined according<br />
to the following definition: English Language Learner refers to a student who has a language other than<br />
English and the pr<strong>of</strong>iciency in English is such that the probability <strong>of</strong> the student’s academic success<br />
in an English-only classroom is below that <strong>of</strong> an academically successful peer with an English<br />
language background.<br />
PERCENT OF IOWA FOURTH GRADE STUDENTS PERFORMING<br />
AT OR ABOVE PROFICIENT LEVEL ON ITBS READING<br />
COMPREHENSION TEST BY PRIMARY LANGUAGE STATUS*<br />
BIENNIUM PERIOD 2001-2003 (2000 NORMS)<br />
76.7<br />
English<br />
Source: <strong>Iowa</strong> Testing Programs, University <strong>of</strong> <strong>Iowa</strong>.<br />
Notes: A student designated as pr<strong>of</strong>icient can, at a minimum, do the following:<br />
Usually understands factual information and new words in context.<br />
Usually is able to make inferences and interpret either nonliteral language or information in new<br />
contexts. Often can determine a selection’s main idea and analyze its style and structure.<br />
*Primary Language Status is classified by English and English Language Learner and determined<br />
according to the following definition: English Language Learner refers to a student who has a language<br />
other than English and the pr<strong>of</strong>iciency in English is such that the probability <strong>of</strong> the student’s academic<br />
success in an English-only classroom is below that <strong>of</strong> an academically successful peer with an English<br />
language background.<br />
71.2<br />
STUDENT PERFORMANCE — <strong>State</strong> Indicators <strong>of</strong> Student Success<br />
149
Figure 42A<br />
PERCENT OF IOWA FOURTH GRADE STUDENTS PERFORMING<br />
AT OR ABOVE PROFICIENT LEVEL ON ITBS READING<br />
COMPREHENSION TEST BY MIGRANT STATUS*<br />
BIENNIUM PERIODS 1999-2001 TO 2001-2003 (1992 NORMS)<br />
Percent<br />
100<br />
90<br />
80<br />
70<br />
60<br />
50<br />
40<br />
30<br />
20<br />
10<br />
0<br />
28.2<br />
1999-2001<br />
2000-2002<br />
2001-2003<br />
32.3<br />
Migrant<br />
35.4<br />
68.4<br />
Migrant/Non-Migrant Status<br />
69.9<br />
Non-Migrant<br />
71.2<br />
Source:<br />
Notes:<br />
<strong>Iowa</strong> Testing Programs, University <strong>of</strong> <strong>Iowa</strong>.<br />
Percentages for each biennium period represent average percentages <strong>of</strong> pr<strong>of</strong>icient students for the<br />
two school years represented, e.g. 2001-2003 represents the average for the 2001-2002 and the<br />
2002-2003 school years. A student designated as pr<strong>of</strong>icient can, at a minimum, do the following:<br />
Usually understands factual information and new words in context.<br />
Usually is able to make inferences and interpret either nonliteral language or information in new<br />
contexts. Often can determine a selection’s main idea and analyze its style and structure.<br />
*Migrant status is defined as migrant or non-migrant as follows: Migrant — a student is considered a<br />
migrant if he or she has moved in the past 36 months from one district to another so that the parents<br />
could obtain temporary or seasonal employment in agriculture as their principal means <strong>of</strong> livelihood.<br />
Figure 42B<br />
PERCENT OF IOWA FOURTH GRADE STUDENTS PERFORMING<br />
AT OR ABOVE PROFICIENT LEVEL ON ITBS READING<br />
COMPREHENSION TEST BY MIGRANT STATUS*<br />
BIENNIUM PERIOD 2001-2003 (2000 NORMS)<br />
Percent<br />
100<br />
90<br />
80<br />
70<br />
60<br />
50<br />
40<br />
30<br />
20<br />
10<br />
0<br />
76.7<br />
43.6<br />
Migrant<br />
Non-Migrant<br />
Migrant/Non-Migrant Status<br />
150<br />
Source:<br />
Notes:<br />
<strong>Iowa</strong> Testing Programs, University <strong>of</strong> <strong>Iowa</strong>.<br />
A student designated as pr<strong>of</strong>icient can, at a minimum, do the following:<br />
Usually understands factual information and new words in context.<br />
Usually is able to make inferences and interpret either nonliteral language or information in new<br />
contexts. Often can determine a selection’s main idea and analyze its style and structure.<br />
*Migrant status is defined as migrant or non-migrant as follows: Migrant — a student is considered a<br />
migrant if he or she has moved in the past 36 months from one district to another so that the parents<br />
could obtain temporary or seasonal employment in agriculture as their principal means <strong>of</strong> livelihood.
Figure 43<br />
Percent<br />
100<br />
90<br />
80<br />
70<br />
60<br />
50<br />
40<br />
30<br />
20<br />
10<br />
0<br />
Source:<br />
Note:<br />
PERCENT OF IOWA EIGHTH GRADE STUDENTS<br />
PERFORMING AT OR ABOVE PROFICIENT LEVEL ON<br />
ITBS READING COMPREHENSION TEST<br />
BIENNIUM PERIODS 1993-1995 TO 2001-2003<br />
73.5 73.3 73.2 72.1 70.8 69.7 69.3 69.4 69.3<br />
1993-1995 1994-1996 1995-1997 1996-1998 1997-1999 1998-2000 1999-2001 2000-2002 2001-2003<br />
Biennium Period<br />
<strong>Iowa</strong> Testing Programs, University <strong>of</strong> <strong>Iowa</strong>.<br />
Percentages for each biennium period represent average percentages <strong>of</strong> pr<strong>of</strong>icient students for the<br />
two school years represented, e.g. 2001-2003 represents the average for the 2001-2002 and the<br />
2002-2003 school years. A student designated as pr<strong>of</strong>icient can, at a minimum, do the following:<br />
Usually is able to understand factual information and new words in context, make inferences, and<br />
interpret information in new contexts.<br />
Often is able to determine a selection’s main idea, identify its author’s purpose or viewpoint, and<br />
analyze its style and structure.<br />
STUDENT PERFORMANCE — <strong>State</strong> Indicators <strong>of</strong> Student Success<br />
151
Figure 44A<br />
PERCENT OF IOWA EIGHTH GRADE STUDENTS<br />
PERFORMING AT OR ABOVE PROFICIENT LEVEL ON<br />
ITBS READING COMPREHENSION TEST BY GENDER<br />
BIENNIUM PERIODS 1997-1999 TO 2001-2003 (1992 NORMS)<br />
Percent<br />
100<br />
90<br />
80<br />
70<br />
60<br />
50<br />
40<br />
30<br />
20<br />
10<br />
0<br />
Female Male<br />
73.3<br />
68.4 72.1 67.6<br />
71.4 67.3<br />
71.5 67.2<br />
72.2 66.5<br />
1997-1999 1998-2000 1999-2001 2000-2002 2001-2003<br />
Biennium Period<br />
Source:<br />
Note:<br />
<strong>Iowa</strong> Testing Programs, University <strong>of</strong> <strong>Iowa</strong>.<br />
Percentages for each biennium period represent average percentages <strong>of</strong> pr<strong>of</strong>icient students for the<br />
two school years represented, e.g. 2001-2003 represents the average for the 2001-2002 and the<br />
2002-2003 school years. A student designated as pr<strong>of</strong>icient can, at a minimum, do the following:<br />
Usually is able to understand factual information and new words in context, make inferences, and<br />
interpret information in new contexts.<br />
Often is able to determine a selection’s main idea, identify its author’s purpose or viewpoint, and<br />
analyze its style and structure.<br />
Figure 44B<br />
PERCENT OF IOWA EIGHTH GRADE STUDENTS<br />
PERFORMING AT OR ABOVE PROFICIENT LEVEL ON<br />
ITBS READING COMPREHENSION TEST BY GENDER<br />
BIENNIUM PERIOD 2001-2003 (2000 NORMS)<br />
Percent<br />
100<br />
90<br />
80<br />
70<br />
60<br />
50<br />
40<br />
30<br />
20<br />
10<br />
0<br />
72.2<br />
Female<br />
66.5<br />
Male<br />
Gender<br />
Source:<br />
Note:<br />
<strong>Iowa</strong> Testing Programs, University <strong>of</strong> <strong>Iowa</strong>.<br />
A student designated as pr<strong>of</strong>icient can, at a minimum, do the following:<br />
Usually is able to understand factual information and new words in context, make inferences, and<br />
interpret information in new contexts.<br />
Often is able to determine a selection’s main idea, identify its author’s purpose or viewpoint, and<br />
analyze its style and structure.<br />
152
Figure 45A<br />
Source:<br />
Note:<br />
Percent<br />
Percent<br />
100<br />
90<br />
80<br />
70<br />
60<br />
50<br />
40<br />
30<br />
20<br />
10<br />
0<br />
100<br />
90<br />
80<br />
70<br />
60<br />
50<br />
40<br />
30<br />
20<br />
10<br />
0<br />
Figure 45B<br />
Source:<br />
Notes:<br />
PERCENT OF IOWA EIGHTH GRADE STUDENTS<br />
PERFORMING AT OR ABOVE PROFICIENT LEVEL ON<br />
ITBS READING COMPREHENSION TEST BY RACE/ETHNICITY<br />
BIENNIUM PERIODS 1998-2000 TO 2001-2003 (1992 NORMS)<br />
71.8<br />
71.3<br />
72.0<br />
71.5<br />
72.0<br />
39.0<br />
36.6<br />
1998-2000 1999-2001<br />
2000-2002 2001-2003<br />
35.9<br />
35.7<br />
35.9<br />
43.0<br />
41.5<br />
41.8<br />
43.0<br />
43.0<br />
65.6<br />
67.1<br />
68.6<br />
White African American Hispanic Asian American Indian<br />
Race/Ethnicity<br />
62.4<br />
68.6<br />
52.0<br />
52.2<br />
48.4<br />
49.2<br />
White African American Hispanic Asian American Indian<br />
Race/Ethnicity<br />
<strong>Iowa</strong> Testing Programs, University <strong>of</strong> <strong>Iowa</strong>.<br />
Percentages for each biennium period represent average percentages <strong>of</strong> pr<strong>of</strong>icient students for the two<br />
school years represented, e.g. 2001-2003 represents the average for the 2001-2002 and the 2002-2003<br />
school years. A student designated as pr<strong>of</strong>icient can, at a minimum, do the following:<br />
Usually is able to understand factual information and new words in context, make inferences, and<br />
interpret information in new contexts.<br />
Often is able to determine a selection’s main idea, identify its author’s purpose or viewpoint, and<br />
analyze its style and structure.<br />
PERCENT OF IOWA EIGHTH GRADE STUDENTS<br />
PERFORMING AT OR ABOVE PROFICIENT LEVEL ON<br />
ITBS READING COMPREHENSION TEST BY RACE/ETHNICITY<br />
BIENNIUM PERIOD 2001-2003 (2000 NORMS)<br />
<strong>Iowa</strong> Testing Programs, University <strong>of</strong> <strong>Iowa</strong>.<br />
A student designated as pr<strong>of</strong>icient can, at a minimum, do the following:<br />
Usually is able to understand factual information and new words in context, make inferences, and<br />
interpret information in new contexts.<br />
Often is able to determine a selection’s main idea, identify its author’s purpose or viewpoint, and<br />
analyze its style and structure.<br />
49.2<br />
STUDENT PERFORMANCE — <strong>State</strong> Indicators <strong>of</strong> Student Success<br />
153
Figure 46A<br />
PERCENT OF IOWA EIGHTH GRADE STUDENTS<br />
PERFORMING AT OR ABOVE PROFICIENT LEVEL ON<br />
ITBS READING COMPREHENSION TEST BY SOCIOECONOMIC STATUS*<br />
BIENNIUM PERIODS 1998-2000 TO 2001-2003 (1992 NORMS)<br />
Percent<br />
100<br />
90<br />
80<br />
70<br />
60<br />
50<br />
40<br />
30<br />
20<br />
10<br />
0<br />
1998-2000 1999-2001<br />
2000-2002 2001-2003<br />
75.6 75.2 75.2 75.4<br />
50.8 48.7 49.0 49.7<br />
Eligible for Free or Reduced Price Meals Not Eligible for Free or Reduced Price Meals<br />
Socioeconomic Status<br />
Source:<br />
Notes:<br />
<strong>Iowa</strong> Testing Programs, University <strong>of</strong> <strong>Iowa</strong>.<br />
Percentages for each biennium period represent average percentages <strong>of</strong> pr<strong>of</strong>icient students for the<br />
two school years represented, e.g. 2001-2003 represents the average for the 2001-2002 and the<br />
2002-2003 school years. A student designated as pr<strong>of</strong>icient can, at a minimum, do the following:<br />
Usually is able to understand factual information and new words in context, make inferences, and<br />
interpret information in new contexts.<br />
Often is able to determine a selection’s main idea, identify its author’s purpose or viewpoint, and<br />
analyze its style and structure.<br />
*Socioeconomic Status is determined by eligibility for free or reduced price meals.<br />
Figure 46B<br />
PERCENT OF IOWA EIGHTH GRADE STUDENTS<br />
PERFORMING AT OR ABOVE PROFICIENT LEVEL ON<br />
ITBS READING COMPREHENSION TEST BY SOCIOECONOMIC STATUS*<br />
BIENNIUM PERIOD 2001-2003 (2000 NORMS)<br />
Percent<br />
100<br />
90<br />
80<br />
70<br />
60<br />
50<br />
40<br />
30<br />
20<br />
10<br />
0<br />
49.7<br />
Eligible for Free or Reduced<br />
Price Meals<br />
Socioeconomic Status<br />
75.4<br />
Not Eligible for Free or<br />
Reduced Price Meals<br />
154<br />
Source:<br />
Notes:<br />
<strong>Iowa</strong> Testing Programs, University <strong>of</strong> <strong>Iowa</strong>.<br />
A student designated as pr<strong>of</strong>icient can, at a minimum, do the following:<br />
Usually is able to understand factual information and new words in context, make inferences, and<br />
interpret information in new contexts.<br />
Often is able to determine a selection’s main idea, identify its author’s purpose or viewpoint, and<br />
analyze its style and structure.<br />
*Socioeconomic Status is determined by eligibility for free or reduced price meals.
Figure 47A<br />
Figure 47B<br />
Source:<br />
Notes:<br />
PERCENT OF IOWA EIGHTH GRADE STUDENTS<br />
PERFORMING AT OR ABOVE PROFICIENT LEVEL ON<br />
ITBS READING COMPREHENSION TEST BY DISABILITY STATUS*<br />
Percent<br />
Source:<br />
Notes:<br />
100<br />
90<br />
80<br />
70<br />
60<br />
50<br />
40<br />
30<br />
20<br />
10<br />
0<br />
BIENNIUM PERIODS 1998-2000 TO 2001-2003 (1992 NORMS)<br />
<strong>Iowa</strong> Testing Programs, University <strong>of</strong> <strong>Iowa</strong>.<br />
Percentages for each biennium period represent average percentages <strong>of</strong> pr<strong>of</strong>icient students for the<br />
two school years represented, e.g. 2001-2003 represents the average for the 2001-2002 and the<br />
2002-2003 school years. A student designated as pr<strong>of</strong>icient can, at a minimum, do the following:<br />
Usually is able to understand factual information and new words in context, make inferences, and<br />
interpret information in new contexts.<br />
Often is able to determine a selection’s main idea, identify its author’s purpose or viewpoint, and<br />
analyze its style and structure.<br />
*Disability Status is determined by the presence <strong>of</strong> an individualized education plan (IEP).<br />
PERCENT OF IOWA EIGHTH GRADE STUDENTS<br />
PERFORMING AT OR ABOVE PROFICIENT LEVEL ON<br />
ITBS READING COMPREHENSION TEST BY DISABILITY STATUS*<br />
Percent<br />
100<br />
90<br />
80<br />
70<br />
60<br />
50<br />
40<br />
30<br />
20<br />
10<br />
0<br />
29.6<br />
1998-2000 1999-2001<br />
2000-2002 2001-2003<br />
23.7<br />
25.3<br />
Disability<br />
22.9<br />
BIENNIUM PERIOD 2001-2003 (2000 NORMS)<br />
22.9<br />
Disability<br />
Disability Status<br />
<strong>Iowa</strong> Testing Programs, University <strong>of</strong> <strong>Iowa</strong>.<br />
A student designated as pr<strong>of</strong>icient can, at a minimum, do the following:<br />
Usually is able to understand factual information and new words in context, make inferences, and<br />
interpret information in new contexts.<br />
Often is able to determine a selection’s main idea, identify its author’s purpose or viewpoint, and<br />
analyze its style and structure.<br />
*Disability Status is determined by the presence <strong>of</strong> an individualized education plan (IEP).<br />
75.7<br />
Disability Status<br />
75.8<br />
76.2<br />
No Disability<br />
76.9<br />
No Disability<br />
76.9<br />
STUDENT PERFORMANCE — <strong>State</strong> Indicators <strong>of</strong> Student Success<br />
155
Figure 48A<br />
PERCENT OF IOWA EIGHTH GRADE STUDENTS PERFORMING<br />
AT OR ABOVE PROFICIENT LEVEL ON ITBS READING<br />
COMPREHENSION TEST BY PRIMARY LANGUAGE STATUS*<br />
BIENNIUM PERIODS 1999-2001 TO 2001-2003 (1992 NORMS)<br />
Percent<br />
100<br />
90<br />
80<br />
70<br />
60<br />
50<br />
40<br />
30<br />
20<br />
10<br />
0<br />
46.6<br />
1999-2001<br />
2000-2002<br />
2001-2003<br />
38.4<br />
27.2<br />
68.4<br />
69.9<br />
ELL*<br />
English<br />
Primary Language Status<br />
69.9<br />
Source:<br />
Notes:<br />
<strong>Iowa</strong> Testing Programs, University <strong>of</strong> <strong>Iowa</strong>.<br />
Percentages for each biennium period represent average percentages <strong>of</strong> pr<strong>of</strong>icient students for the<br />
two school years represented, e.g. 2001-2003 represents the average for the 2001-2002 and the<br />
2002-2003 school years. A student designated as pr<strong>of</strong>icient can, at a minimum, do the following:<br />
Usually is able to understand factual information and new words in context, make inferences,<br />
and interpret information in new contexts.<br />
Often is able to determine a selection’s main idea, identify its author’s purpose or viewpoint, and<br />
analyze its style and structure.<br />
*Primary Language Status is classified by English and English Language Learner and determined<br />
according to the following definition: English Language Learner refers to a student who has a language<br />
other than English and the pr<strong>of</strong>iciency in English is such that the probability <strong>of</strong> the student’s academic<br />
success in an English-only classroom is below that <strong>of</strong> an academically successful peer with an English<br />
language background.<br />
Figure 48B<br />
PERCENT OF IOWA EIGHTH GRADE STUDENTS PERFORMING<br />
AT OR ABOVE PROFICIENT LEVEL ON ITBS READING<br />
COMPREHENSION TEST BY PRIMARY LANGUAGE STATUS*<br />
BIENNIUM PERIOD 2001-2003 (2000 NORMS)<br />
Percent<br />
100<br />
90<br />
80<br />
70<br />
60<br />
50<br />
40<br />
30<br />
20<br />
10<br />
0<br />
27.2<br />
ELL*<br />
69.9<br />
English<br />
Primary Language Status<br />
156<br />
Source:<br />
Notes:<br />
<strong>Iowa</strong> Testing Programs, University <strong>of</strong> <strong>Iowa</strong>.<br />
A student designated as pr<strong>of</strong>icient can, at a minimum, do the following:<br />
Usually is able to understand factual information and new words in context, make inferences, and<br />
interpret information in new contexts.<br />
Often is able to determine a selection’s main idea, identify its author’s purpose or viewpoint, and<br />
analyze its style and structure.<br />
*Primary Language Status is classified by English and English Language Learner and determined<br />
according to the following definition: English Language Learner refers to a student who has a language<br />
other than English and the pr<strong>of</strong>iciency in English is such that the probability <strong>of</strong> the student’s academic<br />
success in an English-only classroom is below that <strong>of</strong> an academically successful peer with an English<br />
language background.
Figure 49A<br />
Source:<br />
Notes:<br />
Source:<br />
Notes:<br />
Percent<br />
Figure 49B<br />
PERCENT OF IOWA EIGHTH GRADE STUDENTS PERFORMING<br />
AT OR ABOVE PROFICIENT LEVEL ON ITBS READING<br />
COMPREHENSION TEST BY MIGRANT STATUS*<br />
BIENNIUM PERIODS 1999-2001 TO 2001-2003 (1992 NORMS)<br />
100<br />
90<br />
80<br />
70<br />
60<br />
50<br />
40<br />
30<br />
20<br />
10<br />
0<br />
Percent<br />
100<br />
90<br />
80<br />
70<br />
60<br />
50<br />
40<br />
30<br />
20<br />
10<br />
0<br />
1999-2001<br />
2000-2002<br />
2001-2003<br />
29.6<br />
27.4<br />
Migrant<br />
30.4<br />
30.4<br />
<strong>Iowa</strong> Testing Programs, University <strong>of</strong> <strong>Iowa</strong>.<br />
A student designated as pr<strong>of</strong>icient can, at a minimum, do the following:<br />
Usually is able to understand factual information and new words in context, make inferences, and<br />
interpret information in new contexts.<br />
Often is able to determine a selection’s main idea, identify its author’s purpose or viewpoint, and<br />
analyze its style and structure.<br />
*Migrant status is defined as migrant or non-migrant as follows: Migrant — a student is considered a<br />
migrant if he or she has moved in the past 36 months from one district to another so that the parents<br />
could obtain temporary or seasonal employment in agriculture as their principal means <strong>of</strong> livelihood.<br />
69.8<br />
Migrant/Non-Migrant Status<br />
69.9<br />
69.9<br />
Non-Migrant<br />
<strong>Iowa</strong> Testing Programs, University <strong>of</strong> <strong>Iowa</strong>.<br />
Percentages for each biennium period represent average percentages <strong>of</strong> pr<strong>of</strong>icient students for the<br />
two school years represented, e.g. 2001-2003 represents the average for the 2001-2002 and the<br />
2002-2003 school years. A student designated as pr<strong>of</strong>icient can, at a minimum, do the following:<br />
Usually is able to understand factual information and new words in context, make inferences, and<br />
interpret information in new contexts.<br />
Often is able to determine a selection’s main idea, identify its author’s purpose or viewpoint, and<br />
analyze its style and structure.<br />
*Migrant status is defined as migrant or non-migrant as follows: Migrant — a student is considered a<br />
migrant if he or she has moved in the past 36 months from one district to another so that the parents<br />
could obtain temporary or seasonal employment in agriculture as their principal means <strong>of</strong> livelihood.<br />
PERCENT OF IOWA EIGHTH GRADE STUDENTS PERFORMING<br />
AT OR ABOVE PROFICIENT LEVEL ON ITBS READING<br />
COMPREHENSION TEST BY MIGRANT STATUS*<br />
BIENNIUM PERIOD 2001-2003 (2000 NORMS)<br />
Migrant<br />
Non-Migrant<br />
Migrant/Non-Migrant Status<br />
69.9<br />
STUDENT PERFORMANCE — <strong>State</strong> Indicators <strong>of</strong> Student Success<br />
157
Figure 50<br />
PERCENT OF IOWA ELEVENTH GRADE STUDENTS<br />
PERFORMING AT OR ABOVE PROFICIENT LEVEL ON<br />
ITED READING COMPREHENSION TEST<br />
BIENNIUM PERIODS 1993-1995 TO 2001-2003<br />
Percent<br />
100<br />
90<br />
80<br />
70<br />
60<br />
50<br />
40<br />
30<br />
20<br />
10<br />
0<br />
79.1 78.5 78.4 77.6 76.4 75.1 74.8 77.1 77.0<br />
1993-1995 1994-1996 1995-1997 1996-1998 1997-1999 1998-2000 1999-2001 2000-2002 2001-2003<br />
Biennium Period<br />
Source:<br />
Note:<br />
<strong>Iowa</strong> Testing Programs, University <strong>of</strong> <strong>Iowa</strong>.<br />
Percentages for each biennium period represent average percentages <strong>of</strong> pr<strong>of</strong>icient students for the two<br />
school years represented, e.g. 2001-2003 represents the average for the 2001-2002 and the 2002-2003<br />
school years. A student designated as pr<strong>of</strong>icient can, at a minimum, do the following:<br />
Usually understands stated information and ideas; <strong>of</strong>ten is able to infer implied meaning, draw<br />
conclusions, and interpret nonliteral language; and usually is able to make generalizations from or<br />
about a text, identify its author’s purpose or viewpoint, and evaluate aspects <strong>of</strong> its style or structure.<br />
158
Figure 51A<br />
Percent<br />
Source:<br />
Note:<br />
100<br />
90<br />
80<br />
70<br />
60<br />
50<br />
40<br />
30<br />
20<br />
10<br />
0<br />
Figure 51B<br />
Source:<br />
Note:<br />
Percent<br />
PERCENT OF IOWA ELEVENTH GRADE STUDENTS<br />
PERFORMING AT OR ABOVE PROFICIENT LEVEL ON<br />
ITED READING COMPREHENSION TEST BY GENDER<br />
BIENNIUM PERIODS 1997-1999 TO 2001-2003 (1992 NORMS)<br />
81.9 81.3 80.9 81.9 81.7<br />
70.3<br />
68.7 68.6<br />
72.0 72.6<br />
1997-1999 1998-2000 1999-2001 2000-2002 2001-2003<br />
Biennium Period<br />
100<br />
90<br />
80<br />
70<br />
60<br />
50<br />
40<br />
30<br />
20<br />
10<br />
0<br />
81.7<br />
Female<br />
Female<br />
<strong>Iowa</strong> Testing Programs, University <strong>of</strong> <strong>Iowa</strong>.<br />
Percentages for each biennium period represent average percentages <strong>of</strong> pr<strong>of</strong>icient students for the two<br />
school years represented, e.g. 2001-2003 represents the average for the 2001-2002 and the 2002-2003<br />
school years. A student designated as pr<strong>of</strong>icient can, at a minimum, do the following:<br />
Usually understands stated information and ideas; <strong>of</strong>ten is able to infer implied meaning, draw<br />
conclusions, and interpret nonliteral language; and usually is able to make generalizations from or<br />
about a text, identify its author’s purpose or viewpoint, and evaluate aspects <strong>of</strong> its style or structure.<br />
Gender<br />
Male<br />
PERCENT OF IOWA ELEVENTH GRADE STUDENTS<br />
PERFORMING AT OR ABOVE PROFICIENT LEVEL ON<br />
ITED READING COMPREHENSION TEST BY GENDER<br />
BIENNIUM PERIOD 2001-2003 (2000 NORMS)<br />
72.6<br />
Male<br />
<strong>Iowa</strong> Testing Programs, University <strong>of</strong> <strong>Iowa</strong>.<br />
A student designated as pr<strong>of</strong>icient can, at a minimum, do the following:<br />
Usually understands stated information and ideas; <strong>of</strong>ten is able to infer implied meaning, draw<br />
conclusions, and interpret nonliteral language; and usually is able to make generalizations from or<br />
about a text, identify its author’s purpose or viewpoint, and evaluate aspects <strong>of</strong> its style or structure.<br />
STUDENT PERFORMANCE — <strong>State</strong> Indicators <strong>of</strong> Student Success<br />
159
Figure 52A<br />
PERCENT OF IOWA ELEVENTH GRADE STUDENTS<br />
PERFORMING AT OR ABOVE PROFICIENT LEVEL ON<br />
ITED READING COMPREHENSION TEST BY RACE/ETHNICITY<br />
BIENNIUM PERIODS 1998-2000 TO 2001-2003 (1992 NORMS)<br />
Percent<br />
100<br />
90<br />
80<br />
70<br />
60<br />
50<br />
40<br />
30<br />
20<br />
10<br />
0<br />
76.2<br />
76.0<br />
78.6<br />
78.6<br />
52.2<br />
49.6<br />
1998-2000 1999-2001<br />
2000-2002 2001-2003<br />
50.1<br />
49.7<br />
58.3<br />
54.8<br />
54.0<br />
53.5<br />
67.4<br />
72.9<br />
77.2<br />
75.1<br />
55.9<br />
55.2<br />
58.8<br />
62.5<br />
White African American Hispanic Asian American Indian<br />
Race/Ethnicity<br />
Source:<br />
Note:<br />
<strong>Iowa</strong> Testing Programs, University <strong>of</strong> <strong>Iowa</strong>.<br />
Percentages for each biennium period represent average percentages <strong>of</strong> pr<strong>of</strong>icient students for the two<br />
school years represented, e.g. 2001-2003 represents the average for the 2001-2002 and the 2002-2003<br />
school years. A student designated as pr<strong>of</strong>icient can, at a minimum, do the following:<br />
Usually understands stated information and ideas; <strong>of</strong>ten is able to infer implied meaning, draw<br />
conclusions, and interpret nonliteral language; and usually is able to make generalizations from or<br />
about a text, identify its author’s purpose or viewpoint, and evaluate aspects <strong>of</strong> its style or structure.<br />
Figure 52B<br />
PERCENT OF IOWA ELEVENTH GRADE STUDENTS<br />
PERFORMING AT OR ABOVE PROFICIENT LEVEL ON<br />
ITED READING COMPREHENSION TEST BY RACE/ETHNICITY<br />
BIENNIUM PERIOD 2001-2003 (2000 NORMS)<br />
Percent<br />
100<br />
90<br />
80<br />
70<br />
60<br />
50<br />
40<br />
30<br />
20<br />
10<br />
0<br />
78.6<br />
49.7<br />
53.5<br />
75.1<br />
62.5<br />
White African American Hispanic Asian American Indian<br />
Race/Ethnicity<br />
Source:<br />
Note:<br />
<strong>Iowa</strong> Testing Programs, University <strong>of</strong> <strong>Iowa</strong>.<br />
A student designated as pr<strong>of</strong>icient can, at a minimum, do the following:<br />
Usually understands stated information and ideas; <strong>of</strong>ten is able to infer implied meaning, draw<br />
conclusions, and interpret nonliteral language; and usually is able to make generalizations from or<br />
about a text, identify its author’s purpose or viewpoint, and evaluate aspects <strong>of</strong> its style or structure.<br />
160
Figure 53A<br />
Percent<br />
Figure 53B<br />
Source:<br />
Notes:<br />
PERCENT OF IOWA ELEVENTH GRADE STUDENTS<br />
PERFORMING AT OR ABOVE PROFICIENT LEVEL ON<br />
ITED READING COMPREHENSION TEST BY SOCIOECONOMIC STATUS*<br />
Source:<br />
Notes:<br />
BIENNIUM PERIODS 1998-2000 TO 2001-2003 (1992 NORMS)<br />
100<br />
90<br />
80<br />
70<br />
60<br />
50<br />
40<br />
30<br />
20<br />
10<br />
0<br />
Percent<br />
100<br />
90<br />
80<br />
70<br />
60<br />
50<br />
40<br />
30<br />
20<br />
10<br />
0<br />
62.0<br />
1998-2000 1999-2001<br />
2000-2002 2001-2003<br />
58.6<br />
60.6<br />
60.8<br />
60.8<br />
Eligible for Free or Reduced Price<br />
Meals<br />
Eligible for Free or Reduced<br />
Price Meals<br />
77.2<br />
Socioeconomic Status<br />
Socioeconomic Status<br />
77.3<br />
79.9<br />
79.8<br />
Not Eligible for Free or<br />
Reduced Price Meals<br />
79.9<br />
Not Eligible for Free or Reduced Price<br />
Meals<br />
<strong>Iowa</strong> Testing Programs, University <strong>of</strong> <strong>Iowa</strong>.<br />
Percentages for each biennium period represent average percentages <strong>of</strong> pr<strong>of</strong>icient students for the two<br />
school years represented, e.g. 2001-2003 represents the average for the 2001-2002 and the 2002-2003<br />
school years. A student designated as pr<strong>of</strong>icient can, at a minimum, do the following:<br />
Usually understands stated information and ideas; <strong>of</strong>ten is able to infer implied meaning, draw<br />
conclusions, and interpret nonliteral language; and usually is able to make generalizations from or<br />
about a text, identify its author’s purpose or viewpoint, and evaluate aspects <strong>of</strong> its style or structure.<br />
*Socioeconomic Status is determined by eligibility for free or reduced price meals.<br />
PERCENT OF IOWA ELEVENTH GRADE STUDENTS<br />
PERFORMING AT OR ABOVE PROFICIENT LEVEL ON<br />
ITED READING COMPREHENSION TEST BY SOCIOECONOMIC STATUS*<br />
BIENNIUM PERIOD 2001-2003 (2000 NORMS)<br />
<strong>Iowa</strong> Testing Programs, University <strong>of</strong> <strong>Iowa</strong>.<br />
A student designated as pr<strong>of</strong>icient can, at a minimum, do the following:<br />
Usually understands stated information and ideas; <strong>of</strong>ten is able to infer implied meaning, draw<br />
conclusions, and interpret nonliteral language; and usually is able to make generalizations from or<br />
about a text, identify its author’s purpose or viewpoint, and evaluate aspects <strong>of</strong> its style or structure.<br />
*Socioeconomic Status is determined by eligibility for free or reduced price meals.<br />
STUDENT PERFORMANCE — <strong>State</strong> Indicators <strong>of</strong> Student Success<br />
161
Figure 54A<br />
PERCENT OF IOWA ELEVENTH GRADE STUDENTS<br />
PERFORMING AT OR ABOVE PROFICIENT LEVEL ON<br />
ITED READING COMPREHENSION TEST BY DISABILITY STATUS*<br />
BIENNIUM PERIODS 1998-2000 TO 2001-2003 (1992 NORMS)<br />
Percent<br />
100<br />
90<br />
80<br />
70<br />
60<br />
50<br />
40<br />
30<br />
20<br />
10<br />
0<br />
29.4<br />
1998-2000 1999-2001<br />
2000-2002 2001-2003 77.8<br />
26.8 28.2 27.5<br />
Disability<br />
Disability Status<br />
78.2<br />
81.1<br />
No Disability<br />
82.0<br />
Source:<br />
Notes:<br />
<strong>Iowa</strong> Testing Programs, University <strong>of</strong> <strong>Iowa</strong>.<br />
Percentages for each biennium period represent average percentages <strong>of</strong> pr<strong>of</strong>icient students for the<br />
two school years represented, e.g. 2001-2003 represents the average for the 2001-2002 and the<br />
2002-2003 school years. A student designated as pr<strong>of</strong>icient can, at a minimum, do the following:<br />
Usually understands stated information and ideas; <strong>of</strong>ten is able to infer implied meaning, draw<br />
conclusions, and interpret nonliteral language; and usually is able to make generalizations from<br />
or about a text, identify its author’s purpose or viewpoint, and evaluate aspects <strong>of</strong> its style or structure.<br />
*Disability Status is determined by the presence <strong>of</strong> an individualized education plan (IEP).<br />
Figure 54B<br />
PERCENT OF IOWA ELEVENTH GRADE STUDENTS<br />
PERFORMING AT OR ABOVE PROFICIENT LEVEL ON<br />
ITED READING COMPREHENSION TEST BY DISABILITY STATUS*<br />
BIENNIUM PERIOD 2001-2003 (2000 NORMS)<br />
Percent<br />
100<br />
90<br />
80<br />
70<br />
60<br />
50<br />
40<br />
30<br />
20<br />
10<br />
0<br />
27.5<br />
Disability<br />
82.0<br />
No Disability<br />
Disability Status<br />
Source:<br />
Notes:<br />
<strong>Iowa</strong> Testing Programs, University <strong>of</strong> <strong>Iowa</strong>.<br />
A student designated as pr<strong>of</strong>icient can, at a minimum, do the following:<br />
Usually understands stated information and ideas; <strong>of</strong>ten is able to infer implied meaning, draw<br />
conclusions, and interpret nonliteral language; and usually is able to make generalizations from or<br />
about a text, identify its author’s purpose or viewpoint, and evaluate aspects <strong>of</strong> its style or structure.<br />
*Disability Status is determined by the presence <strong>of</strong> an individualized education plan (IEP).<br />
162
Figure 55A<br />
Source:<br />
Notes:<br />
Figure 55B<br />
Source:<br />
Notes:<br />
PERCENT OF IOWA ELEVENTH GRADE STUDENTS PERFORMING<br />
AT OR ABOVE PROFICIENT LEVEL ON ITED READING<br />
COMPREHENSION TEST BY PRIMARY LANGUAGE STATUS*<br />
BIENNIUM PERIODS 1999-2001 TO 2001-2003 (1992 NORMS)<br />
Percent<br />
100<br />
90<br />
80<br />
70<br />
60<br />
50<br />
40<br />
30<br />
20<br />
10<br />
0<br />
Percent<br />
100<br />
90<br />
80<br />
70<br />
60<br />
50<br />
40<br />
30<br />
20<br />
10<br />
0<br />
45.4<br />
32.6<br />
ELL*<br />
31.6<br />
1999-2001<br />
2000-2002<br />
2001-2003<br />
ELL*<br />
31.6<br />
75.2<br />
Primary Language Status<br />
77.5<br />
77.5<br />
English<br />
<strong>Iowa</strong> Testing Programs, University <strong>of</strong> <strong>Iowa</strong>.<br />
Percentages for each biennium period represent average percentages <strong>of</strong> pr<strong>of</strong>icient students for the two<br />
school years represented, e.g. 2001-2003 represents the average for the 2001-2002 and the 2002-2003<br />
school years. A student designated as pr<strong>of</strong>icient can, at a minimum, do the following:<br />
Usually understands stated information and ideas; <strong>of</strong>ten is able to infer implied meaning, draw<br />
conclusions, and interpret nonliteral language; and usually is able to make generalizations from or<br />
about a text, identify its author’s purpose or viewpoint, and evaluate aspects <strong>of</strong> its style or structure.<br />
*Primary Language Status is classified by English and English Language Learner and determined<br />
according to the following definition: English Language Learner refers to a student who has a language<br />
other than English and the pr<strong>of</strong>iciency in English is such that the probability <strong>of</strong> the student’s academic<br />
success in an English-only classroom is below that <strong>of</strong> an academically successful peer with an English<br />
language background.<br />
PERCENT OF IOWA ELEVENTH GRADE STUDENTS PERFORMING<br />
AT OR ABOVE PROFICIENT LEVEL ON ITED READING<br />
COMPREHENSION TEST BY PRIMARY LANGUAGE STATUS*<br />
English<br />
Primary Language Status<br />
<strong>Iowa</strong> Testing Programs, University <strong>of</strong> <strong>Iowa</strong>.<br />
A student designated as pr<strong>of</strong>icient can, at a minimum, do the following:<br />
Usually understands stated information and ideas; <strong>of</strong>ten is able to infer implied meaning, draw<br />
conclusions, and interpret nonliteral language; and usually is able to make generalizations from or<br />
about a text, identify its author’s purpose or viewpoint, and evaluate aspects <strong>of</strong> its style or structure.<br />
*Primary Language Status is classified by English and English Language Learner and determined<br />
according to the following definition: English Language Learner refers to a student who has a language<br />
other than English and the pr<strong>of</strong>iciency in English is such that the probability <strong>of</strong> the student’s academic<br />
success in an English-only classroom is below that <strong>of</strong> an academically successful peer with an English<br />
language background.<br />
77.5<br />
BIENNIUM PERIOD 2001-2003 (2000 NORMS)<br />
STUDENT PERFORMANCE — <strong>State</strong> Indicators <strong>of</strong> Student Success<br />
163
Figure 56A<br />
PERCENT OF IOWA ELEVENTH GRADE STUDENTS PERFORMING<br />
AT OR ABOVE PROFICIENT LEVEL ON ITED READING<br />
COMPREHENSION TEST BY MIGRANT STATUS*<br />
BIENNIUM PERIODS 1999-2001 TO 2001-2003 (1992 NORMS)<br />
Percent<br />
100<br />
90<br />
80<br />
70<br />
60<br />
50<br />
40<br />
30<br />
20<br />
10<br />
0<br />
48.8<br />
33.2<br />
Migrant<br />
1999-2001<br />
2000-2002<br />
2001-2003<br />
26.0<br />
75.2<br />
Migrant/Non-Migrant Status<br />
77.5<br />
Non-Migrant<br />
77.5<br />
Source:<br />
Notes:<br />
<strong>Iowa</strong> Testing Programs, University <strong>of</strong> <strong>Iowa</strong>.<br />
Percentages for each biennium period represent average percentages <strong>of</strong> pr<strong>of</strong>icient students for the two<br />
school years represented, e.g. 2001-2003 represents the average for the 2001-2002 and the 2002-2003<br />
school years. A student designated as pr<strong>of</strong>icient can, at a minimum, do the following:<br />
Usually understands stated information and ideas; <strong>of</strong>ten is able to infer implied meaning, draw<br />
conclusions, and interpret nonliteral language; and usually is able to make generalizations from or<br />
about a text, identify its author’s purpose or viewpoint, and evaluate aspects <strong>of</strong> its style or structure.<br />
*Migrant status is defined as migrant or non-migrant as follows: Migrant - a student is considered as<br />
migrant if he or she has moved in the past 36 months from one district to another so that the parents could<br />
obtain temporary or seasonal employment in agriculture as their principal means <strong>of</strong> livelihood.<br />
Figure 56B<br />
PERCENT OF IOWA ELEVENTH GRADE STUDENTS PERFORMING<br />
AT OR ABOVE PROFICIENT LEVEL ON ITED READING<br />
COMPREHENSION TEST BY MIGRANT STATUS*<br />
BIENNIUM PERIOD 2001-2003 (2000 NORMS)<br />
Percent<br />
100<br />
90<br />
80<br />
70<br />
60<br />
50<br />
40<br />
30<br />
20<br />
10<br />
0<br />
77.5<br />
26.0<br />
Migrant<br />
Non-Migrant<br />
Migrant/Non-Migrant Status<br />
164<br />
Source:<br />
Notes:<br />
<strong>Iowa</strong> Testing Programs, University <strong>of</strong> <strong>Iowa</strong>.<br />
A student designated as pr<strong>of</strong>icient can, at a minimum, do the following:<br />
Usually understands stated information and ideas; <strong>of</strong>ten is able to infer implied meaning, draw<br />
conclusions, and interpret nonliteral language; and usually is able to make generalizations from or<br />
about a text, identify its author’s purpose or viewpoint, and evaluate aspects <strong>of</strong> its style or structure.<br />
*Migrant status is defined as migrant or non-migrant as follows: Migrant - a student is considered as<br />
migrant if he or she has moved in the past 36 months from one district to another so that the parents could<br />
obtain temporary or seasonal employment in agriculture as their principal means <strong>of</strong> livelihood.
Mathematics<br />
Indicator: Percentage <strong>of</strong> 4th, 8th, and 11th grade students achieving pr<strong>of</strong>icient or higher<br />
mathematics status on the ITBS and ITED Mathematics Tests (reported for all students and<br />
by gender, race/ethnicity, socio-economic status, disability, primary language status, and<br />
migrant status).<br />
Percent<br />
Figure 57<br />
100<br />
90<br />
80<br />
70<br />
60<br />
50<br />
40<br />
30<br />
20<br />
10<br />
0<br />
Source:<br />
Note:<br />
PERCENT OF IOWA FOURTH GRADE STUDENTS<br />
PERFORMING AT OR ABOVE PROFICIENT LEVEL ON<br />
ITBS MATHEMATICS TEST<br />
BIENNIUM PERIODS 1993-1995 TO 2001-2003<br />
74.6 74.5 73.6 72.9 71.5 71.0 71.4 72.4 75.0<br />
1993-1995 1994-1996 1995-1997 1996-1998 1997-1999 1998-2000 1999-2001 2000-2002 2001-2003<br />
Biennium Period<br />
<strong>Iowa</strong> Testing Programs, University <strong>of</strong> <strong>Iowa</strong>.<br />
Percentages for each biennium period represent average percentages <strong>of</strong> pr<strong>of</strong>icient students for the two<br />
school years represented, e.g. 2001-2003 represents the average for the 2001-2002 and the 2002-2003<br />
school years. A student designated as pr<strong>of</strong>icient can, at a minimum, do the following:<br />
Is developing an understanding <strong>of</strong> many math concepts; usually is able to solve simple and complex<br />
word problems and use estimation methods; and can interpret data from graphs and tables.<br />
STUDENT PERFORMANCE — <strong>State</strong> Indicators <strong>of</strong> Student Success<br />
165
Figure 58A<br />
PERCENT OF IOWA FOURTH GRADE STUDENTS<br />
PERFORMING AT OR ABOVE PROFICIENT LEVEL ON<br />
ITBS MATHEMATICS TEST BY GENDER<br />
BIENNIUM PERIODS 1997-1999 TO 2001-2003 (1992 NORMS)<br />
Percent<br />
100<br />
90<br />
80<br />
70<br />
60<br />
50<br />
40<br />
30<br />
20<br />
10<br />
0<br />
Female Male<br />
70.9 72.2 70.4 71.9 70.8 72.6 71.3 73.3 74.2 75.9<br />
1997-1999 1998-2000 1999-2001 2000-2002 2001-2003<br />
Biennium Period<br />
Source:<br />
Note:<br />
<strong>Iowa</strong> Testing Programs, University <strong>of</strong> <strong>Iowa</strong>.<br />
Percentages for each biennium period represent average percentages <strong>of</strong> pr<strong>of</strong>icient students for the two<br />
school years represented, e.g. 2001-2003 represents the average for the 2001-2002 and the 2002-2003<br />
school years. A student designated as pr<strong>of</strong>icient can, at a minimum, do the following:<br />
Is developing an understanding <strong>of</strong> many math concepts; usually is able to solve simple and complex<br />
word problems and use estimation methods; and can interpret data from graphs and tables.<br />
Figure 58B<br />
PERCENT OF IOWA FOURTH GRADE STUDENTS<br />
PERFORMING AT OR ABOVE PROFICIENT LEVEL ON<br />
ITBS MATHEMATICS TEST BY GENDER<br />
BIENNIUM PERIOD 2001-2003 (2000 NORMS)<br />
Percent<br />
100<br />
90<br />
80<br />
70<br />
60<br />
50<br />
40<br />
30<br />
20<br />
10<br />
0<br />
74.2 75.9<br />
Female<br />
Male<br />
Gender<br />
Source:<br />
Note:<br />
<strong>Iowa</strong> Testing Programs, University <strong>of</strong> <strong>Iowa</strong>.<br />
A student designated as pr<strong>of</strong>icient can, at a minimum, do the following:<br />
Is developing an understanding <strong>of</strong> many math concepts; usually is able to solve simple and complex<br />
word problems and use estimation methods; and can interpret data from graphs and tables.<br />
166
Figure 59A<br />
Source:<br />
Note:<br />
Figure 59B<br />
Percent<br />
100<br />
90<br />
80<br />
70<br />
60<br />
50<br />
40<br />
30<br />
20<br />
10<br />
0<br />
Source:<br />
Note:<br />
Percent<br />
77.8<br />
White<br />
PERCENT OF IOWA FOURTH GRADE STUDENTS<br />
PERFORMING AT OR ABOVE PROFICIENT LEVEL ON<br />
ITBS MATHEMATICS TEST BY RACE/ETHNICITY<br />
BIENNIUM PERIODS 1998-2000 TO 2001-2003 (1992 NORMS)<br />
100<br />
90<br />
80<br />
70<br />
60<br />
50<br />
40<br />
30<br />
20<br />
10<br />
0<br />
73.4<br />
74.0<br />
74.9<br />
77.8<br />
40.9<br />
<strong>Iowa</strong> Testing Programs, University <strong>of</strong> <strong>Iowa</strong>.<br />
Percentages for each biennium period represent average percentages <strong>of</strong> pr<strong>of</strong>icient students for the two<br />
school years represented, e.g. 2001-2003 represents the average for the 2001-2002 and the 2002-2003<br />
school years. A student designated as pr<strong>of</strong>icient can, at a minimum, do the following:<br />
Is developing an understanding <strong>of</strong> many math concepts; usually is able to solve simple and complex<br />
problems and use estimation methods; and can interpret data from graphs and tables.<br />
PERCENT OF IOWA FOURTH GRADE STUDENTS<br />
PERFORMING AT OR ABOVE PROFICIENT LEVEL ON<br />
ITBS MATHEMATICS TEST BY RACE/ETHNICITY<br />
BIENNIUM PERIOD 2001-2003 (2000 NORMS)<br />
42.7<br />
41.6<br />
African<br />
American<br />
1998-2000 1999-2001<br />
2000-2002 2001-2003<br />
41.4<br />
42.7<br />
48.5<br />
47.3<br />
53.0<br />
80.0<br />
55.8<br />
Hispanic Asian American Indian<br />
Race/Ethnicity<br />
<strong>Iowa</strong> Testing Programs, University <strong>of</strong> <strong>Iowa</strong>.<br />
A student designated as pr<strong>of</strong>icient can, at a minimum, do the following:<br />
Is developing an understanding <strong>of</strong> many math concepts; usually is able to solve simple and complex<br />
word problems and use estimation methods; and can interpret data from graphs and tables.<br />
49.5<br />
53.0<br />
66.2<br />
71.0<br />
72.5<br />
80.0<br />
53.8<br />
52.6<br />
57.0<br />
White African American Hispanic Asian American Indian<br />
Race/Ethnicity<br />
55.8<br />
STUDENT PERFORMANCE — <strong>State</strong> Indicators <strong>of</strong> Student Success<br />
167
Figure 60A<br />
PERCENT OF IOWA FOURTH GRADE STUDENTS<br />
PERFORMING AT OR ABOVE PROFICIENT LEVEL ON<br />
ITBS MATHEMATICS TEST BY SOCIOECONOMIC STATUS*<br />
BIENNIUM PERIODS 1998-2000 TO 2001-2003 (1992 NORMS)<br />
Percent<br />
100<br />
90<br />
80<br />
70<br />
60<br />
50<br />
40<br />
30<br />
20<br />
10<br />
0<br />
54.5<br />
1998-2000 1999-2001<br />
2000-2002 2001-2003<br />
55.3<br />
56.4<br />
59.4<br />
Eligible for Free or Reduced Price Meals Not Eligible for Free or Reduced Price Meals<br />
Socioeconomic Status<br />
78.1<br />
78.0<br />
78.6<br />
81.3<br />
Source:<br />
Notes:<br />
<strong>Iowa</strong> Testing Programs, University <strong>of</strong> <strong>Iowa</strong>.<br />
Percentages for each biennium period represent average percentages <strong>of</strong> pr<strong>of</strong>icient students for the two<br />
school years represented, e.g. 2001-2003 represents the average for the 2001-2002 and the 2002-2003<br />
school years. A student designated as pr<strong>of</strong>icient can, at a minimum, do the following:<br />
Is developing an understanding <strong>of</strong> many math concepts; usually is able to solve simple and complex<br />
word problems and use estimation methods; and can interpret data from graphs and tables.<br />
*Socioeconomic Status is determined by eligibility for free or reduced price meals.<br />
Figure 60B<br />
PERCENT OF IOWA FOURTH GRADE STUDENTS<br />
PERFORMING AT OR ABOVE PROFICIENT LEVEL ON<br />
ITBS MATHEMATICS TEST BY SOCIOECONOMIC STATUS*<br />
BIENNIUM PERIOD 2001-2003 (2000 NORMS)<br />
Percent<br />
100<br />
90<br />
80<br />
70<br />
60<br />
50<br />
40<br />
30<br />
20<br />
10<br />
0<br />
59.4<br />
Eligible for Free or<br />
Reduced Price Meals<br />
Socioeconomic Status<br />
81.3<br />
Not Eligible for Free or<br />
Reduced Price Meals<br />
Source:<br />
Notes:<br />
<strong>Iowa</strong> Testing Programs, University <strong>of</strong> <strong>Iowa</strong>.<br />
A student designated as pr<strong>of</strong>icient can, at a minimum, do the following:<br />
Is developing an understanding <strong>of</strong> many math concepts; usually is able to solve simple and complex<br />
word problems and use estimation methods; and can interpret data from graphs and tables.<br />
*Socioeconomic Status is determined by eligibility for free or reduced price meals.<br />
168
Figure 61A<br />
Source:<br />
Notes:<br />
Figure 61B<br />
Source:<br />
Notes:<br />
Percent<br />
100<br />
90<br />
80<br />
70<br />
60<br />
50<br />
40<br />
30<br />
20<br />
10<br />
0<br />
PERCENT OF IOWA FOURTH GRADE STUDENTS<br />
PERFORMING AT OR ABOVE PROFICIENT LEVEL ON<br />
ITBS MATHEMATICS TEST BY DISABILITY STATUS*<br />
BIENNIUM PERIODS 1998-2000 TO 2001-2003 (1992 NORMS)<br />
PERCENT OF IOWA FOURTH GRADE STUDENTS<br />
PERFORMING AT OR ABOVE PROFICIENT LEVEL ON<br />
ITBS MATHEMATICS TEST BY DISABILITY STATUS*<br />
BIENNIUM PERIOD 2001-2003 (2000 NORMS)<br />
Percent<br />
41.4<br />
100<br />
90<br />
80<br />
70<br />
60<br />
50<br />
40<br />
30<br />
20<br />
10<br />
0<br />
1998-2000 1999-2001<br />
2000-2002 2001-2003<br />
40.5<br />
36.8<br />
Disability<br />
35.0<br />
35.0<br />
Disability Status<br />
80.1<br />
Disability<br />
No Disability<br />
Disability Status<br />
<strong>Iowa</strong> Testing Programs, University <strong>of</strong> <strong>Iowa</strong>.<br />
A student designated as pr<strong>of</strong>icient can, at a minimum, do the following:<br />
Is developing an understanding <strong>of</strong> many math concepts; usually is able to solve simple and complex<br />
word problems and use estimation methods; and can interpret data from graphs and tables.<br />
*Disability Status is determined by the presence <strong>of</strong> an individualized education plan (IEP).<br />
75.8<br />
76.6<br />
77.3<br />
No Disability<br />
<strong>Iowa</strong> Testing Programs, University <strong>of</strong> <strong>Iowa</strong>.<br />
Percentages for each biennium period represent average percentages <strong>of</strong> pr<strong>of</strong>icient students for the two<br />
school years represented, e.g. 2001-2003 represents the average for the 2001-2002 and the 2002-2003<br />
school years. A student designated as pr<strong>of</strong>icient can, at a minimum, do the following:<br />
Is developing an understanding <strong>of</strong> many math concepts; usually is able to solve simple and complex<br />
word problems and use estimation methods; and can interpret data from graphs and tables.<br />
*Disability Status is determined by the presence <strong>of</strong> an individualized education plan (IEP).<br />
80.1<br />
STUDENT PERFORMANCE — <strong>State</strong> Indicators <strong>of</strong> Student Success<br />
169
Figure 62A<br />
PERCENT OF IOWA FOURTH GRADE STUDENTS<br />
PERFORMING AT OR ABOVE PROFICIENT LEVEL ON<br />
ITBS MATHEMATICS TEST BY PRIMARY LANGUAGE STATUS*<br />
BIENNIUM PERIODS 1999-2001 TO 2001-2003 (1992 NORMS)<br />
Percent<br />
100<br />
90<br />
80<br />
70<br />
60<br />
50<br />
40<br />
30<br />
20<br />
10<br />
0<br />
52.4<br />
46.2<br />
ELL*<br />
1999-2001<br />
2000-2002<br />
2001-2003<br />
45.4<br />
Primary Language Status<br />
72.1<br />
72.9<br />
English<br />
75.7<br />
Source:<br />
Notes:<br />
<strong>Iowa</strong> Testing Programs, University <strong>of</strong> <strong>Iowa</strong>.<br />
Percentages for each biennium period represent average percentages <strong>of</strong> pr<strong>of</strong>icient students for the two<br />
school years represented, e.g. 2001-2003 represents the average for the 2001-2002 and the 2002-2003<br />
school years. A student designated as pr<strong>of</strong>icient can, at a minimum, do the following:<br />
Is developing an understanding <strong>of</strong> many math concepts; usually is able to solve simple and complex<br />
word problems and use estimation methods; and can interpret data from graphs and tables.<br />
*Primary Language Status is classified by English and English Language Learner and determined<br />
according to the following definition: English Language Learner refers to a student who has a language<br />
other than English and the pr<strong>of</strong>iciency in English is such that the probability <strong>of</strong> the student’s academic<br />
success in an English-only classroom is below that <strong>of</strong> an academically successful peer with an English<br />
language background.<br />
Figure 62B<br />
PERCENT OF IOWA FOURTH GRADE STUDENTS<br />
PERFORMING AT OR ABOVE PROFICIENT LEVEL ON<br />
ITBS MATHEMATICS TEST BY PRIMARY LANGUAGE STATUS*<br />
BIENNIUM PERIOD 2001-2003 (2000 NORMS)<br />
Percent<br />
100<br />
90<br />
80<br />
70<br />
60<br />
50<br />
40<br />
30<br />
20<br />
10<br />
0<br />
75.7<br />
45.4<br />
ELL*<br />
English<br />
Primary Language Status<br />
170<br />
Source:<br />
Notes:<br />
<strong>Iowa</strong> Testing Programs, University <strong>of</strong> <strong>Iowa</strong>.<br />
A student designated as pr<strong>of</strong>icient can, at a minimum, do the following:<br />
Is developing an understanding <strong>of</strong> many math concepts; usually is able to solve simple and complex<br />
word problems and use estimation methods; and can interpret data from graphs and tables.<br />
*Primary Language Status is classified by English and English Language Learner and determined<br />
according to the following definition: English Language Learner refers to a student who has a language<br />
other than English and the pr<strong>of</strong>iciency in English is such that the probability <strong>of</strong> the student’s academic<br />
success in an English-only classroom is below that <strong>of</strong> an academically successful peer with an English<br />
language background.
Figure 63A<br />
Percent<br />
Source:<br />
Notes:<br />
100<br />
90<br />
80<br />
70<br />
60<br />
50<br />
40<br />
30<br />
20<br />
10<br />
0<br />
Figure 63B<br />
Source:<br />
Notes:<br />
PERCENT OF IOWA FOURTH GRADE STUDENTS<br />
PERFORMING AT OR ABOVE PROFICIENT LEVEL ON<br />
ITBS MATHEMATICS TEST BY MIGRANT STATUS*<br />
BIENNIUM PERIODS 1999-2001 TO 2001-2003 (1992 NORMS)<br />
<strong>Iowa</strong> Testing Programs, University <strong>of</strong> <strong>Iowa</strong>.<br />
Percentages for each biennium period represent average percentages <strong>of</strong> pr<strong>of</strong>icient students for the two<br />
school years represented, e.g. 2001-2003 represents the average for the 2001-2002 and the 2002-2003<br />
school years. A student designated as pr<strong>of</strong>icient can, at a minimum, do the following:<br />
Is developing an understanding <strong>of</strong> many math concepts; usually is able to solve simple and complex<br />
word problems and use estimation methods; and can interpret data from graphs and tables.<br />
*Migrant status is defined as migrant or non-migrant as follows: Migrant - a student is considered as<br />
migrant if he or she has moved in the past 36 months from one district to another so that the parents could<br />
obtain temporary or seasonal employment in agriculture as their principal means <strong>of</strong> livelihood.<br />
Percent<br />
27.8<br />
100<br />
90<br />
80<br />
70<br />
60<br />
50<br />
40<br />
30<br />
20<br />
10<br />
0<br />
40.1<br />
Migrant<br />
1999-2001<br />
2000-2002<br />
2001-2003<br />
49.4<br />
49.4<br />
72.1<br />
Migrant/Non-Migrant Status<br />
75.7<br />
Migrant<br />
Non-Migrant<br />
Migrant/Non-Migrant Status<br />
72.9<br />
Non-Migrant<br />
PERCENT OF IOWA FOURTH GRADE STUDENTS<br />
PERFORMING AT OR ABOVE PROFICIENT LEVEL ON<br />
ITBS MATHEMATICS TEST BY MIGRANT STATUS*<br />
BIENNIUM PERIOD 2001-2003 (2000 NORMS)<br />
<strong>Iowa</strong> Testing Programs, University <strong>of</strong> <strong>Iowa</strong>.<br />
A student designated as pr<strong>of</strong>icient can, at a minimum, do the following:<br />
Is developing an understanding <strong>of</strong> many math concepts; usually is able to solve simple and complex<br />
word problems and use estimation methods; and can interpret data from graphs and tables.<br />
*Migrant status is defined as migrant or non-migrant as follows: Migrant - a student is considered as<br />
migrant if he or she has moved in the past 36 months from one district to another so that the parents could<br />
obtain temporary or seasonal employment in agriculture as their principal means <strong>of</strong> livelihood.<br />
75.7<br />
STUDENT PERFORMANCE — <strong>State</strong> Indicators <strong>of</strong> Student Success<br />
171
Figure 64<br />
PERCENT OF IOWA EIGHTH GRADE STUDENTS<br />
PERFORMING AT OR ABOVE PROFICIENT LEVEL ON<br />
ITBS MATHEMATICS TEST<br />
BIENNIUM PERIODS 1993-1995 TO 2001-2003<br />
100<br />
90<br />
80<br />
70<br />
60<br />
1992 Norms<br />
2000 Norms<br />
76.6 77.3 77.4 76.5 75.2 74.1 73.6 73.6<br />
73.1<br />
71.6<br />
Percent<br />
50<br />
40<br />
30<br />
20<br />
10<br />
0<br />
1993-1995 1994-1996 1995-1997 1996-1998 1997-1999 1998-2000 1999-2001 2000-2002 2001-2003<br />
Biennium Period<br />
Source:<br />
Notes:<br />
<strong>Iowa</strong> Testing Programs, University <strong>of</strong> <strong>Iowa</strong>.<br />
Percentages for each biennium period represent average percentages <strong>of</strong> pr<strong>of</strong>icient students for the two<br />
school years represented, e.g. 2001-2003 represents the average for the 2001-2002 and the 2002-2003<br />
school years. A student designated as pr<strong>of</strong>icient can, at a minimum, do the following:<br />
Usually can understand math concepts and solve simple and complex word problems, sometimes can<br />
use estimation methods, and usually is able to interpret data from graphs and tables.<br />
172
Figure 65A<br />
Percent<br />
Source:<br />
Note:<br />
100<br />
90<br />
80<br />
70<br />
60<br />
50<br />
40<br />
30<br />
20<br />
10<br />
0<br />
Figure 65B<br />
Source:<br />
Note:<br />
PERCENT OF IOWA EIGHTH GRADE STUDENTS<br />
PERFORMING AT OR ABOVE PROFICIENT LEVEL ON<br />
ITBS MATHEMATICS TEST BY GENDER<br />
BIENNIUM PERIODS 1997-1999 TO 2001-2003 (1992 NORMS)<br />
Female<br />
Male<br />
76.0 74.2 74.9 73.4 74.2 73.2 73.3 72.6 73.5 73.2<br />
1997-1999 1998-2000 1999-2001 2000-2002 2001-2003<br />
Biennium Period<br />
<strong>Iowa</strong> Testing Programs, University <strong>of</strong> <strong>Iowa</strong>.<br />
Percentages for each biennium period represent average percentages <strong>of</strong> pr<strong>of</strong>icient students for the two<br />
school years represented, e.g. 2001-2003 represents the average for the 2001-2002 and the 2002-2003<br />
school years. A student designated as pr<strong>of</strong>icient can, at a minimum, do the following:<br />
Usually can understand math concepts and solve simple and complex word problems, sometimes can<br />
use estimation methods, and usually is able to interpret data from graphs and tables.<br />
PERCENT OF IOWA EIGHTH GRADE STUDENTS<br />
PERFORMING AT OR ABOVE PROFICIENT LEVEL ON<br />
ITBS MATHEMATICS TEST BY GENDER<br />
BIENNIUM PERIOD 2001-2003 (2000 NORMS)<br />
Percent<br />
100<br />
90<br />
80<br />
70<br />
60<br />
50<br />
40<br />
30<br />
20<br />
10<br />
0<br />
71.6 71.2<br />
Female<br />
Gender<br />
Male<br />
<strong>Iowa</strong> Testing Programs, University <strong>of</strong> <strong>Iowa</strong>.<br />
A student designated as pr<strong>of</strong>icient can, at a minimum, do the following:<br />
Usually can understand math concepts and solve simple and complex word problems, sometimes can<br />
use estimation methods, and usually is able to interpret data from graphs and tables.<br />
STUDENT PERFORMANCE — <strong>State</strong> Indicators <strong>of</strong> Student Success<br />
173
Figure 66A<br />
PERCENT OF IOWA EIGHTH GRADE STUDENTS<br />
PERFORMING AT OR ABOVE PROFICIENT LEVEL ON<br />
ITBS MATHEMATICS TEST BY RACE/ETHNICITY<br />
BIENNIUM PERIODS 1998-2000 TO 2001-2003 (1992 NORMS)<br />
Percent<br />
100<br />
90<br />
80<br />
70<br />
60<br />
50<br />
40<br />
30<br />
20<br />
10<br />
0<br />
72.5<br />
75.4<br />
75.0<br />
76.3<br />
1998-2000 1999-2001<br />
2000-2002 2001-2003<br />
39.5<br />
40.2<br />
37.6<br />
35.0<br />
45.4<br />
47.1<br />
46.2<br />
44.9<br />
68.2<br />
71.4<br />
73.4<br />
79.2<br />
55.5<br />
57.5<br />
51.8<br />
50.3<br />
White African American Hispanic Asian American Indian<br />
Race/Ethnicity<br />
Source:<br />
Note:<br />
<strong>Iowa</strong> Testing Programs, University <strong>of</strong> <strong>Iowa</strong>.<br />
Percentages for each biennium period represent average percentages <strong>of</strong> pr<strong>of</strong>icient students for the two<br />
school years represented, e.g. 2001-2003 represents the average for the 2001-2002 and the 2002-2003<br />
school years. A student designated as pr<strong>of</strong>icient can, at a minimum, do the following:<br />
Usually can understand math concepts and solve simple and complex word problems, sometimes can<br />
use estimation methods, and usually is able to interpret data from graphs and tables.<br />
Figure 66B<br />
PERCENT OF IOWA EIGHTH GRADE STUDENTS<br />
PERFORMING AT OR ABOVE PROFICIENT LEVEL ON<br />
ITBS MATHEMATICS TEST BY RACE/ETHNICITY<br />
BIENNIUM PERIOD 2001-2003 (2000 NORMS)<br />
Percent<br />
100<br />
90<br />
80<br />
70<br />
60<br />
50<br />
40<br />
30<br />
20<br />
10<br />
0<br />
74.4<br />
White<br />
33.0<br />
African<br />
American<br />
42.9<br />
76.7<br />
48.3<br />
Hispanic Asian American<br />
Indian<br />
Race/Ethnicity<br />
Source:<br />
Note:<br />
<strong>Iowa</strong> Testing Programs, University <strong>of</strong> <strong>Iowa</strong>.<br />
A student designated as pr<strong>of</strong>icient can, at a minimum, do the following:<br />
Usually can understand math concepts and solve simple and complex word problems, sometimes can<br />
use estimation methods, and usually is able to interpret data from graphs and tables.<br />
174
Figure 67A<br />
Percent<br />
Source:<br />
Notes:<br />
100<br />
90<br />
80<br />
70<br />
60<br />
50<br />
40<br />
30<br />
20<br />
10<br />
0<br />
Figure 67B<br />
Source:<br />
Notes:<br />
PERCENT OF IOWA EIGHTH GRADE STUDENTS<br />
PERFORMING AT OR ABOVE PROFICIENT LEVEL ON<br />
ITBS MATHEMATICS TEST BY SOCIOECONOMIC STATUS*<br />
BIENNIUM PERIODS 1998-2000 TO 2001-2003 (1992 NORMS)<br />
Percent<br />
55.3<br />
100<br />
90<br />
80<br />
70<br />
60<br />
50<br />
40<br />
30<br />
20<br />
10<br />
0<br />
1998-2000 1999-2001<br />
2000-2002 2001-2003<br />
53.3<br />
52.3<br />
50.9<br />
53.6<br />
Eligible for Free or Reduced Price Meals Not Eligible for Free or Reduced Price Meals<br />
Socioeconomic Status<br />
<strong>Iowa</strong> Testing Programs, University <strong>of</strong> <strong>Iowa</strong>.<br />
Percentages for each biennium period represent average percentages <strong>of</strong> pr<strong>of</strong>icient students for the two<br />
school years represented, e.g. 2001-2003 represents the average for the 2001-2002 and the 2002-2003<br />
school years. A student designated as pr<strong>of</strong>icient can, at a minimum, do the following:<br />
Usually can understand math concepts and solve simple and complex word problems, sometimes can<br />
use estimation methods, and usually is able to interpret data from graphs and tables.<br />
*Socioeconomic Status is determined by eligibility for free or reduced price meals.<br />
Eligible for Free or Reduced<br />
Price Meals<br />
Socioeconomic Status<br />
80.1<br />
78.0<br />
79.8<br />
PERCENT OF IOWA EIGHTH GRADE STUDENTS<br />
Not Eligible for Free or<br />
Reduced Price Meals<br />
79.3<br />
PERFORMING AT OR ABOVE PROFICIENT LEVEL ON<br />
ITBS MATHEMATICS TEST BY SOCIOECONOMIC STATUS*<br />
BIENNIUM PERIOD 2001-2003 (2000 NORMS)<br />
<strong>Iowa</strong> Testing Programs, University <strong>of</strong> <strong>Iowa</strong>.<br />
A student designated as pr<strong>of</strong>icient can, at a minimum, do the following:<br />
Usually can understand math concepts and solve simple and complex word problems, sometimes can<br />
use estimation methods, and usually is able to interpret data from graphs and tables.<br />
*Socioeconomic Status is determined by eligibility for free or reduced price meals.<br />
79.8<br />
STUDENT PERFORMANCE — <strong>State</strong> Indicators <strong>of</strong> Student Success<br />
175
Figure 68A<br />
PERCENT OF IOWA EIGHTH GRADE STUDENTS<br />
PERFORMING AT OR ABOVE PROFICIENT LEVEL ON<br />
ITBS MATHEMATICS TEST BY DISABILITY STATUS*<br />
BIENNIUM PERIODS 1998-2000 TO 2001-2003 (1992 NORMS)<br />
Percent<br />
100<br />
90<br />
80<br />
70<br />
60<br />
50<br />
40<br />
30<br />
20<br />
10<br />
0<br />
1998-2000 1999-2001<br />
2000-2002 2001-2003<br />
80.3<br />
31.6<br />
25.2 26.8 27.0<br />
Disability<br />
Disability Status<br />
80.7<br />
80.4<br />
No Disability<br />
81.0<br />
Source:<br />
Notes:<br />
<strong>Iowa</strong> Testing Programs, University <strong>of</strong> <strong>Iowa</strong>.<br />
Percentages for each biennium period represent average percentages <strong>of</strong> pr<strong>of</strong>icient students for the two<br />
school years represented, e.g. 2001-2003 represents the average for the 2001-2002 and the 2002-2003<br />
school years. A student designated as pr<strong>of</strong>icient can, at a minimum, do the following:<br />
Usually can understand math concepts and solve simple and complex word problems, sometimes can<br />
use estimation methods, and usually is able to interpret data from graphs and tables.<br />
*Disability Status is determined by the presence <strong>of</strong> an individualized education plan (IEP).<br />
Figure 68B<br />
PERCENT OF IOWA EIGHTH GRADE STUDENTS<br />
PERFORMING AT OR ABOVE PROFICIENT LEVEL ON<br />
ITBS MATHEMATICS TEST BY DISABILITY STATUS*<br />
BIENNIUM PERIOD 2001-2003 (2000 NORMS)<br />
Percent<br />
100<br />
90<br />
80<br />
70<br />
60<br />
50<br />
40<br />
30<br />
20<br />
10<br />
0<br />
79.0<br />
24.9<br />
Disability<br />
No Disability<br />
Disability Status<br />
176<br />
Source:<br />
Notes:<br />
<strong>Iowa</strong> Testing Programs, University <strong>of</strong> <strong>Iowa</strong>.<br />
A student designated as pr<strong>of</strong>icient can, at a minimum, do the following:<br />
Usually can understand math concepts and solve simple and complex word problems, sometimes can<br />
use estimation methods, and usually is able to interpret data from graphs and tables.<br />
*Disability Status is determined by the presence <strong>of</strong> an individualized education plan (IEP).
Figure 69A<br />
Source:<br />
Notes:<br />
Figure 69B<br />
Source:<br />
Notes:<br />
PERCENT OF IOWA EIGHTH GRADE STUDENTS<br />
PERFORMING AT OR ABOVE PROFICIENT LEVEL ON<br />
ITBS MATHEMATICS TEST BY PRIMARY LANGUAGE STATUS*<br />
BIENNIUM PERIODS 1999-2001 TO 2001-2003 (1992 NORMS)<br />
Percent<br />
100<br />
90<br />
80<br />
70<br />
60<br />
50<br />
40<br />
30<br />
20<br />
10<br />
0<br />
Percent<br />
100<br />
90<br />
80<br />
70<br />
60<br />
50<br />
40<br />
30<br />
20<br />
10<br />
0<br />
51.0<br />
41.5<br />
ELL*<br />
1999-2001<br />
2000-2002<br />
2001-2003<br />
34.3<br />
38.1<br />
74.2<br />
Primary Language Status<br />
72.0<br />
ELL*<br />
English<br />
Primary Language Status<br />
73.6<br />
English<br />
<strong>Iowa</strong> Testing Programs, University <strong>of</strong> <strong>Iowa</strong>.<br />
Percentages for each biennium period represent average percentages <strong>of</strong> pr<strong>of</strong>icient students for the two<br />
school years represented, e.g. 2001-2003 represents the average for the 2001-2002 and the 2002-2003<br />
school years. A student designated as pr<strong>of</strong>icient can, at a minimum, do the following:<br />
Usually can understand math concepts and solve simple and complex word problems, sometimes can<br />
use estimation methods, and usually is able to interpret data from graphs and tables.<br />
*Primary Language Status is classified by English and English Language Learner and determined<br />
according to the following definition: English Language Learner refers to a student who has a language<br />
other than English and the pr<strong>of</strong>iciency in English is such that the probability <strong>of</strong> the student’s academic<br />
success in an English-only classroom is below that <strong>of</strong> an academically successful peer with an English<br />
language background.<br />
73.9<br />
PERCENT OF IOWA EIGHTH GRADE STUDENTS<br />
PERFORMING AT OR ABOVE PROFICIENT LEVEL ON<br />
ITBS MATHEMATICS TEST BY PRIMARY LANGUAGE STATUS*<br />
BIENNIUM PERIOD 2001-2003 (2000 NORMS)<br />
<strong>Iowa</strong> Testing Programs, University <strong>of</strong> <strong>Iowa</strong>.<br />
A student designated as pr<strong>of</strong>icient can, at a minimum, do the following:<br />
Usually can understand math concepts and solve simple and complex word problems, sometimes can<br />
use estimation methods, and usually is able to interpret data from graphs and tables.<br />
*Primary Language Status is classified by English and English Language Learner and determined<br />
according to the following definition: English Language Learner refers to a student who has a language<br />
other than English and the pr<strong>of</strong>iciency in English is such that the probability <strong>of</strong> the student’s academic<br />
success in an English-only classroom is below that <strong>of</strong> an academically successful peer with an English<br />
language background.<br />
STUDENT PERFORMANCE — <strong>State</strong> Indicators <strong>of</strong> Student Success<br />
177
Figure 70A<br />
PERCENT OF IOWA EIGHTH GRADE STUDENTS<br />
PERFORMING AT OR ABOVE PROFICIENT LEVEL ON<br />
ITBS MATHEMATICS TEST BY MIGRANT STATUS*<br />
BIENNIUM PERIODS 1999-2001 TO 2001-2003 (1992 NORMS)<br />
Percent<br />
100<br />
90<br />
80<br />
70<br />
60<br />
50<br />
40<br />
30<br />
20<br />
10<br />
0<br />
32.5<br />
1999-2001<br />
2000-2002<br />
2001-2003<br />
32.6<br />
Migrant<br />
41.4<br />
74.2<br />
Migrant/Non-Migrant Status<br />
73.6<br />
Non-Migrant<br />
73.9<br />
Source:<br />
Notes:<br />
<strong>Iowa</strong> Testing Programs, University <strong>of</strong> <strong>Iowa</strong>.<br />
Percentages for each biennium period represent average percentages <strong>of</strong> pr<strong>of</strong>icient students for the two<br />
school years represented, e.g. 2001-2003 represents the average for the 2001-2002 and the 2002-2003<br />
school years. A student designated as pr<strong>of</strong>icient can, at a minimum, do the following:<br />
Usually can understand math concepts and solve simple and complex word problems, sometimes can<br />
use estimation methods, and usually is able to interpret data from graphs and tables.<br />
*Migrant status is defined as migrant or non-migrant as follows: Migrant - a student is considered as<br />
migrant if he or she has moved in the past 36 months from one district to another so that the parents could<br />
obtain temporary or seasonal employment in agriculture as their principal means <strong>of</strong> livelihood.<br />
Figure 70B<br />
PERCENT OF IOWA EIGHTH GRADE STUDENTS<br />
PERFORMING AT OR ABOVE PROFICIENT LEVEL ON<br />
ITBS MATHEMATICS TEST BY MIGRANT STATUS*<br />
BIENNIUM PERIOD 2001-2003 (2000 NORMS)<br />
Percent<br />
100<br />
90<br />
80<br />
70<br />
60<br />
50<br />
40<br />
30<br />
20<br />
10<br />
0<br />
72.0<br />
39.0<br />
Migrant<br />
Non-Migrant<br />
Migrant/Non-Migrant Status<br />
178<br />
Source:<br />
Notes:<br />
<strong>Iowa</strong> Testing Programs, University <strong>of</strong> <strong>Iowa</strong>.<br />
A student designated as pr<strong>of</strong>icient can, at a minimum, do the following:<br />
Usually can understand math concepts and solve simple and complex word problems, sometimes can<br />
use estimation methods, and usually is able to interpret data from graphs and tables.<br />
*Migrant status is defined as migrant or non-migrant as follows: Migrant - a student is considered as<br />
migrant if he or she has moved in the past 36 months from one district to another so that the parents could<br />
obtain temporary or seasonal employment in agriculture as their principal means <strong>of</strong> livelihood.
Figure 71<br />
Percent<br />
Source:<br />
Note:<br />
100<br />
90<br />
80<br />
70<br />
60<br />
50<br />
40<br />
30<br />
20<br />
10<br />
0<br />
PERCENT OF IOWA ELEVENTH GRADE STUDENTS<br />
PERFORMING AT OR ABOVE PROFICIENT LEVEL ON<br />
ITED MATHEMATICS TEST<br />
BIENNIUM PERIODS 1993-1995 TO 2001-2003<br />
82.3 82.7 82.8 82.3 81.4 80.1 79.6 81.3 82.5<br />
1993-1995 1994-1996 1995-1997 1996-1998 1997-1999 1998-2000 1999-2001 2000-2002 2001-2003<br />
Biennium Period<br />
1992 Norms<br />
2000 Norms<br />
<strong>Iowa</strong> Testing Programs, University <strong>of</strong> <strong>Iowa</strong>.<br />
Percentages for each biennium period represent average percentages <strong>of</strong> pr<strong>of</strong>icient students for the two<br />
school years represented, e.g. 2001-2003 represents the average for the 2001-2002 and the 2002-2003<br />
school years. A student designated as pr<strong>of</strong>icient can, at a minimum, do the following:<br />
Sometimes applies math concepts and procedures, makes inferences with quantitative information,<br />
and solves a variety <strong>of</strong> quantitative reasoning problems.<br />
79.2<br />
STUDENT PERFORMANCE — <strong>State</strong> Indicators <strong>of</strong> Student Success<br />
179
Figure 72A<br />
PERCENT OF IOWA ELEVENTH GRADE STUDENTS<br />
PERFORMING AT OR ABOVE PROFICIENT LEVEL ON<br />
ITED MATHEMATICS TEST BY GENDER<br />
BIENNIUM PERIODS 1997-1999 TO 2001-2003 (1992 NORMS)<br />
Percent<br />
100<br />
90<br />
80<br />
70<br />
60<br />
50<br />
40<br />
30<br />
20<br />
10<br />
0<br />
Female<br />
Male<br />
81.2 81.4 80.5 79.8 80.0 81.7 82.6<br />
79.1 81.2 82.6<br />
1997-1999 1998-2000 1999-2001 2000-2002 2001-2003<br />
Biennium Period<br />
Source:<br />
Note:<br />
<strong>Iowa</strong> Testing Programs, University <strong>of</strong> <strong>Iowa</strong>.<br />
Percentages for each biennium period represent average percentages <strong>of</strong> pr<strong>of</strong>icient students for the two<br />
school years represented, e.g. 2001-2003 represents the average for the 2001-2002 and the 2002-2003<br />
school years. A student designated as pr<strong>of</strong>icient can, at a minimum, do the following:<br />
Sometimes applies math concepts and procedures, makes inferences with quantitative information,<br />
and solves a variety <strong>of</strong> quantitative reasoning problems.<br />
Figure 72B<br />
PERCENT OF IOWA ELEVENTH GRADE STUDENTS<br />
PERFORMING AT OR ABOVE PROFICIENT LEVEL ON<br />
ITED MATHEMATICS TEST BY GENDER<br />
BIENNIUM PERIOD 2001-2003 (2000 NORMS)<br />
Percent<br />
100<br />
90<br />
80<br />
70<br />
60<br />
50<br />
40<br />
30<br />
20<br />
10<br />
0<br />
78.9 79.5<br />
Female<br />
Male<br />
180<br />
Source:<br />
Note:<br />
Gender<br />
<strong>Iowa</strong> Testing Programs, University <strong>of</strong> <strong>Iowa</strong>.<br />
A student designated as pr<strong>of</strong>icient can, at a minimum, do the following:<br />
Sometimes applies math concepts and procedures, makes inferences with quantitative<br />
information, and solves a variety <strong>of</strong> quantitative reasoning problems.
Figure 73A<br />
Source:<br />
Note:<br />
Percent<br />
Percent<br />
Figure 73B<br />
Source:<br />
Note:<br />
100<br />
90<br />
80<br />
70<br />
60<br />
50<br />
40<br />
30<br />
20<br />
10<br />
0<br />
100<br />
90<br />
80<br />
70<br />
60<br />
50<br />
40<br />
30<br />
20<br />
10<br />
0<br />
PERCENT OF IOWA ELEVENTH GRADE STUDENTS<br />
PERFORMING AT OR ABOVE PROFICIENT LEVEL ON<br />
ITED MATHEMATICS TEST BY RACE/ETHNICITY<br />
BIENNIUM PERIODS 1998-2000 TO 2001-2003 (1992 NORMS)<br />
76.2<br />
80.8<br />
82.9<br />
84.3<br />
81.1<br />
White<br />
52.2<br />
43.8<br />
50.7<br />
49.8<br />
51.4<br />
African<br />
American<br />
1998-2000 1999-2001<br />
2000-2002 2001-2003<br />
58.3<br />
52.8<br />
60.1<br />
60.2<br />
59.6<br />
67.4<br />
78.6<br />
77.0<br />
80.1<br />
80.8<br />
55.8<br />
62.2<br />
65.8<br />
66.0<br />
White African American Hispanic Asian American Indian<br />
Race/Ethnicity<br />
<strong>Iowa</strong> Testing Programs, University <strong>of</strong> <strong>Iowa</strong>.<br />
Percentages for each biennium period represent average percentages <strong>of</strong> pr<strong>of</strong>icient students for the two<br />
school years represented, e.g. 2001-2003 represents the average for the 2001-2002 and the 2002-2003<br />
school years. A student designated as pr<strong>of</strong>icient can, at a minimum, do the following:<br />
Sometimes applies math concepts and procedures, makes inferences with quantitative information,<br />
and solves a variety <strong>of</strong> quantitative reasoning problems.<br />
PERCENT OF IOWA ELEVENTH GRADE STUDENTS<br />
PERFORMING AT OR ABOVE PROFICIENT LEVEL ON<br />
ITED MATHEMATICS TEST BY RACE/ETHNICITY<br />
BIENNIUM PERIOD 2001-2003 (2000 NORMS)<br />
61.3<br />
Hispanic Asian American<br />
Indian<br />
Race/Ethnicity<br />
<strong>Iowa</strong> Testing Programs, University <strong>of</strong> <strong>Iowa</strong>.<br />
A student designated as pr<strong>of</strong>icient can, at a minimum, do the following:<br />
Sometimes applies math concepts and procedures, makes inferences with quantitative information,<br />
and solves a variety <strong>of</strong> quantitative reasoning problems.<br />
STUDENT PERFORMANCE — <strong>State</strong> Indicators <strong>of</strong> Student Success<br />
181
Figure 74A<br />
PERCENT OF IOWA ELEVENTH GRADE STUDENTS<br />
PERFORMING AT OR ABOVE PROFICIENT LEVEL ON<br />
ITED MATHEMATICS TEST BY SOCIOECONOMIC STATUS*<br />
BIENNIUM PERIODS 1998-2000 TO 2001-2003 (1992 NORMS)<br />
Percent<br />
100<br />
90<br />
80<br />
70<br />
60<br />
50<br />
40<br />
30<br />
20<br />
10<br />
0<br />
20<br />
1998-2000 1999-2001<br />
2000-2002 2001-2003<br />
0<br />
82.2 81.6 83.9 85.4<br />
1998-2000 1999<br />
68.6<br />
65.7 66.0 67.3<br />
Soc<br />
Eligible for Free and Reduced Price Meals<br />
Not Eligible for Free and Reduced Price Meals<br />
Socioeconomic Status<br />
Source:<br />
Notes:<br />
<strong>Iowa</strong> Testing Programs, University <strong>of</strong> <strong>Iowa</strong>.<br />
Percentages for each biennium period represent average percentages <strong>of</strong> pr<strong>of</strong>icient students for the two<br />
school years represented, e.g. 2001-2003 represents the average for the 2001-2002 and the 2002-2003<br />
school years. A student designated as pr<strong>of</strong>icient can, at a minimum, do the following:<br />
Sometimes applies math concepts and procedures, makes inferences with quantitative information,<br />
and solves a variety <strong>of</strong> quantitative reasoning problems.<br />
*Socioeconomic Status is determined by eligibility for free or reduced price meals.<br />
Figure 74B<br />
PERCENT OF IOWA ELEVENTH GRADE STUDENTS<br />
PERFORMING AT OR ABOVE PROFICIENT LEVEL ON<br />
ITED MATHEMATICS TEST BY SOCIOECONOMIC STATUS*<br />
BIENNIUM PERIOD 2001-2003 (2000 NORMS)<br />
Percent<br />
100<br />
90<br />
80<br />
70<br />
60<br />
50<br />
40<br />
30<br />
20<br />
10<br />
0<br />
62.4<br />
82.2<br />
Eligible for Free and Reduced Price Meals Not Eligible for Free and Reduced Price<br />
Meals<br />
Socioeconomic Status<br />
182<br />
Source:<br />
Notes:<br />
<strong>Iowa</strong> Testing Programs, University <strong>of</strong> <strong>Iowa</strong>.<br />
A student designated as pr<strong>of</strong>icient can, at a minimum, do the following:<br />
Sometimes applies math concepts and procedures, makes inferences with quantitative information,<br />
and solves a variety <strong>of</strong> quantitative reasoning problems.<br />
*Socioeconomic Status is determined by eligibility for free or reduced price meals.
Figure 75A<br />
Source:<br />
Notes:<br />
Percent<br />
100<br />
90<br />
80<br />
70<br />
60<br />
50<br />
40<br />
30<br />
20<br />
10<br />
0<br />
Figure 75B<br />
Source:<br />
Notes:<br />
PERCENT OF IOWA ELEVENTH GRADE STUDENTS<br />
PERFORMING AT OR ABOVE PROFICIENT LEVEL ON<br />
ITED MATHEMATICS TEST BY DISABILITY STATUS*<br />
BIENNIUM PERIODS 1998-2000 TO 2001-2003 (1992 NORMS)<br />
Percent<br />
41.0<br />
100<br />
90<br />
80<br />
70<br />
60<br />
50<br />
40<br />
30<br />
20<br />
10<br />
1998-2000 1999-2001<br />
2000-2002 2001-2003<br />
0<br />
39.1<br />
38.8<br />
Disability<br />
32.8<br />
Disability<br />
39.7<br />
Disability Status<br />
Disability Status<br />
82.6<br />
83.8<br />
82.5<br />
No Disability<br />
85.0<br />
No Disability<br />
<strong>Iowa</strong> Testing Programs, University <strong>of</strong> <strong>Iowa</strong>.<br />
Percentages for each biennium period represent average percentages <strong>of</strong> pr<strong>of</strong>icient students for the two<br />
school years represented, e.g. 2001-2003 represents the average for the 2001-2002 and the 2002-2003<br />
school years. A student designated as pr<strong>of</strong>icient can, at a minimum, do the following:<br />
Sometimes applies math concepts and procedures, makes inferences with quantitative information,<br />
and solves a variety <strong>of</strong> quantitative reasoning problems.<br />
*Disability Status is determined by the presence <strong>of</strong> an individualized education plan (IEP).<br />
PERCENT OF IOWA ELEVENTH GRADE STUDENTS<br />
PERFORMING AT OR ABOVE PROFICIENT LEVEL ON<br />
ITED MATHEMATICS TEST BY DISABILITY STATUS*<br />
BIENNIUM PERIOD 2001-2003 (2000 NORMS)<br />
<strong>Iowa</strong> Testing Programs, University <strong>of</strong> <strong>Iowa</strong>.<br />
A student designated as pr<strong>of</strong>icient can, at a minimum, do the following:<br />
Sometimes applies math concepts and procedures, makes inferences with quantitative<br />
information, and solves a variety <strong>of</strong> quantitative reasoning problems.<br />
*Disability Status is determined by the presence <strong>of</strong> an individualized education plan (IEP).<br />
86.9<br />
STUDENT PERFORMANCE — <strong>State</strong> Indicators <strong>of</strong> Student Success<br />
183
Figure 76A<br />
PERCENT OF IOWA ELEVENTH GRADE STUDENTS<br />
PERFORMING AT OR ABOVE PROFICIENT LEVEL ON<br />
ITED MATHEMATICS TEST BY PRIMARY LANGUAGE STATUS*<br />
BIENNIUM PERIODS 1999-2001 TO 2001-2003 (1992 NORMS)<br />
Percent<br />
100<br />
90<br />
80<br />
70<br />
60<br />
50<br />
40<br />
30<br />
20<br />
10<br />
0<br />
60.6<br />
47.5<br />
ELL*<br />
1999-2001<br />
2000-2002<br />
2001-2003<br />
44.5<br />
79.8<br />
81.7<br />
English<br />
83.0<br />
Primary Language Status<br />
Source:<br />
Notes:<br />
<strong>Iowa</strong> Testing Programs, University <strong>of</strong> <strong>Iowa</strong>.<br />
Percentages for each biennium period represent average percentages <strong>of</strong> pr<strong>of</strong>icient students for the two<br />
school years represented, e.g. 2001-2003 represents the average for the 2001-2002 and the 2002-2003<br />
school years. A student designated as pr<strong>of</strong>icient can, at a minimum, do the following:<br />
Sometimes applies math concepts and procedures, makes inferences with quantitative information,<br />
and solves a variety <strong>of</strong> quantitative reasoning problems.<br />
*Primary Language Status is classified by English and English Language Learner and determined<br />
according to the following definition: English Language Learner refers to a student who has a language<br />
other than English and the pr<strong>of</strong>iciency in English is such that the probability <strong>of</strong> the student’s academic<br />
success in an English-only classroom is below that <strong>of</strong> an academically successful peer with an English<br />
language background.<br />
Figure 76B<br />
PERCENT OF IOWA ELEVENTH GRADE STUDENTS<br />
PERFORMING AT OR ABOVE PROFICIENT LEVEL ON<br />
ITED MATHEMATICS TEST BY PRIMARY LANGUAGE STATUS*<br />
BIENNIUM PERIOD 2001-2003 (2000 NORMS)<br />
Percent<br />
100<br />
90<br />
80<br />
70<br />
60<br />
50<br />
40<br />
30<br />
20<br />
10<br />
0<br />
79.6<br />
39.8<br />
ELL*<br />
English<br />
Primary Language Status<br />
184<br />
Source:<br />
Notes:<br />
<strong>Iowa</strong> Testing Programs, University <strong>of</strong> <strong>Iowa</strong>.<br />
A student designated as pr<strong>of</strong>icient can, at a minimum, do the following:<br />
Sometimes applies math concepts and procedures, makes inferences with quantitative information,<br />
and solves a variety <strong>of</strong> quantitative reasoning problems.<br />
*Primary Language Status as classified by English and English Language Learner and determined<br />
according to the following definition: English Language Learner refers to a student who has a language<br />
other than English and the pr<strong>of</strong>iciency in English is such that the probability <strong>of</strong> the student’s academic<br />
success in an English-only classroom is below that <strong>of</strong> an academically successful peer with an English<br />
language background.
Figure 77A<br />
Source:<br />
Notes:<br />
Figure 77B<br />
Source:<br />
Notes:<br />
PERCENT OF IOWA ELEVENTH GRADE STUDENTS<br />
PERFORMING AT OR ABOVE PROFICIENT LEVEL ON<br />
ITED MATHEMATICS TEST BY MIGRANT STATUS*<br />
BIENNIUM PERIODS 1999-2001 TO 2001-2003 (1992 NORMS)<br />
Percent<br />
100<br />
90<br />
80<br />
70<br />
60<br />
50<br />
40<br />
30<br />
20<br />
10<br />
0<br />
Percent<br />
100<br />
90<br />
80<br />
70<br />
60<br />
50<br />
40<br />
30<br />
20<br />
10<br />
0<br />
54.0<br />
44.5<br />
1999-2001 2000-2002 2001-2003<br />
39.9<br />
79.8<br />
81.7<br />
Migrant<br />
Non-Migrant<br />
Migrant/Non-Migrant Status<br />
<strong>Iowa</strong> Testing Programs, University <strong>of</strong> <strong>Iowa</strong>.<br />
Percentages for each biennium period represent average percentages <strong>of</strong> pr<strong>of</strong>icient students for the two<br />
school years represented, e.g. 2001-2003 represents the average for the 2001-2002 and the 2002-2003<br />
school years. A student designated as pr<strong>of</strong>icient can, at a minimum, do the following:<br />
Sometimes applies math concepts and procedures, makes inferences with quantitative information,<br />
and solves a variety <strong>of</strong> quantitative reasoning problems.<br />
*Migrant status is defined as migrant or non-migrant as follows: Migrant - a student is considered as<br />
migrant if he or she has moved in the past 36 months from one district to another so that the parents could<br />
obtain temporary or seasonal employment in agriculture as their principal means <strong>of</strong> livelihood.<br />
PERCENT OF IOWA ELEVENTH GRADE STUDENTS<br />
37.0<br />
79.6<br />
Migrant<br />
Non-Migrant<br />
Migrant/Non-Migrant Status<br />
<strong>Iowa</strong> Testing Programs, University <strong>of</strong> <strong>Iowa</strong>.<br />
A student designated as pr<strong>of</strong>icient can, at a minimum, do the following:<br />
Sometimes applies math concepts and procedures, makes inferences with quantitative information,<br />
and solves a variety <strong>of</strong> quantitative reasoning problems.<br />
*Migrant status is defined as migrant or non-migrant as follows: Migrant - a student is considered as<br />
migrant if he or she has moved in the past 36 months from one district to another so that the parents could<br />
obtain temporary or seasonal employment in agriculture as their principal means <strong>of</strong> livelihood.<br />
83.0<br />
PERFORMING AT OR ABOVE PROFICIENT LEVEL ON<br />
ITED MATHEMATICS TEST BY MIGRANT STATUS*<br />
BIENNIUM PERIOD 2001-2003 (2000 NORMS)<br />
STUDENT PERFORMANCE — <strong>State</strong> Indicators <strong>of</strong> Student Success<br />
185
Science<br />
Indicator: Percentage <strong>of</strong> all 8 th and 11 th grade students achieving pr<strong>of</strong>icient or higher<br />
science status on the ITBS Science Test or the ITED Science Test reported for all students and<br />
by gender, race/ethnicity, socioeconomic status, disability, primary language status, and<br />
migrant status.<br />
Figure 78<br />
PERCENT OF IOWA EIGHTH GRADE STUDENTS PERFORMING AT OR<br />
ABOVE PROFICIENT LEVEL ON ITBS SCIENCE TEST BY GENDER<br />
BIENNIUM PERIOD 2001-2003 (2000 NORMS)<br />
100<br />
80<br />
79.0 75.6 77.3<br />
Percent<br />
60<br />
40<br />
20<br />
0<br />
Female Male Total<br />
Source:<br />
Note:<br />
<strong>Iowa</strong> Testing Programs, University <strong>of</strong> <strong>Iowa</strong>.<br />
A student designated as pr<strong>of</strong>icient can, at a minimum, do the following:<br />
Sometimes understands ideas related to Earth, the universe, and the life science.<br />
Usually understands ideas related to the physical sciences and <strong>of</strong>ten can demonstrate<br />
the skills <strong>of</strong> scientific inquiry.<br />
Figure 79<br />
PERCENT OF IOWA EIGHTH GRADE STUDENTS PERFORMING AT OR<br />
ABOVE PROFICIENT LEVEL ON ITBS SCIENCE TEST BY RACE/ETHNICITY<br />
BIENNIUM PERIOD 2001-2003 (2000 NORMS)<br />
Percent<br />
100<br />
80<br />
60<br />
40<br />
20<br />
79.8<br />
43.7<br />
53.2<br />
77.8<br />
58.8<br />
0<br />
White<br />
African<br />
American<br />
Hispanic Asian American<br />
Indian<br />
Race/Ethnicity<br />
186<br />
Source:<br />
Note:<br />
<strong>Iowa</strong> Testing Programs, University <strong>of</strong> <strong>Iowa</strong>.<br />
A student designated as pr<strong>of</strong>icient can, at a minimum, do the following:<br />
Sometimes understands ideas related to Earth, the universe, and the life science.<br />
Usually understands ideas related to the physical sciences and <strong>of</strong>ten can demonstrate<br />
the skills <strong>of</strong> scientific inquiry.
Figure 80<br />
Figure 81<br />
Source:<br />
Notes:<br />
PERCENT OF IOWA EIGHTH GRADE STUDENTS PERFORMING AT OR<br />
Percent<br />
Percent<br />
ABOVE PROFICIENT LEVEL ON ITBS SCIENCE TEST BY<br />
SOCIOECONOMIC STATUS*, BIENNIUM PERIOD 2001-2003 (2000 NORMS)<br />
Source:<br />
Notes:<br />
100<br />
100<br />
80<br />
60<br />
40<br />
20<br />
80<br />
60<br />
40<br />
20<br />
0<br />
0<br />
60.2<br />
Eligible for Free or Reduced<br />
Price Meals<br />
39.4<br />
Disability<br />
Socioeconomic Status<br />
Disability Status<br />
82.6<br />
Not Eligible for Free or<br />
Reduced Price Meals<br />
<strong>Iowa</strong> Testing Programs, University <strong>of</strong> <strong>Iowa</strong>.<br />
A student designated as pr<strong>of</strong>icient can, at a minimum, do the following:<br />
Sometimes understands ideas related to Earth, the universe, and the life science.<br />
Usually understands ideas related to the physical sciences and <strong>of</strong>ten can demonstrate<br />
the skills <strong>of</strong> scientific inquiry.<br />
*Socioeconomic Status is determined by eligibility for free or reduced price meals.<br />
PERCENT OF IOWA EIGHTH GRADE STUDENTS PERFORMING AT OR<br />
ABOVE PROFICIENT LEVEL ON ITBS SCIENCE TEST BY<br />
DISABILITY STATUS*, BIENNIUM PERIOD 2001-2003 (2000 NORMS)<br />
83.4<br />
No Disability<br />
<strong>Iowa</strong> Testing Programs, University <strong>of</strong> <strong>Iowa</strong>.<br />
A student designated as pr<strong>of</strong>icient can, at a minimum, do the following:<br />
Sometimes understands ideas related to Earth, the universe, and the life science.<br />
Usually understands ideas related to the physical sciences and <strong>of</strong>ten can demonstrate<br />
the skills <strong>of</strong> scientific inquiry.<br />
*Disability Status is determined by the presence <strong>of</strong> an individualized education plan (IEP).<br />
STUDENT PERFORMANCE — <strong>State</strong> Indicators <strong>of</strong> Student Success<br />
187
Figure 82<br />
PERCENT OF IOWA EIGHTH GRADE STUDENTS PERFORMING AT OR<br />
ABOVE PROFICIENT LEVEL ON ITBS SCIENCE TEST BY PRIMARY<br />
LANGUAGE STATUS*, BIENNIUM PERIOD 2001-2003 (2000 NORMS)<br />
Percent<br />
100<br />
80<br />
60<br />
40<br />
20<br />
0<br />
37.6<br />
ELL*<br />
77.8<br />
English<br />
Primary Language Status<br />
Source:<br />
Notes:<br />
<strong>Iowa</strong> Testing Programs, University <strong>of</strong> <strong>Iowa</strong>.<br />
A student designated as pr<strong>of</strong>icient can, at a minimum, do the following:<br />
Sometimes understands ideas related to Earth, the universe, and the life science.<br />
Usually understands ideas related to the physical sciences and <strong>of</strong>ten can demonstrate<br />
the skills <strong>of</strong> scientific inquiry.<br />
*Primary Language Status is classified by English and English Language Learners and determined<br />
according to the following definition: English Language Learner refers to a student who has a<br />
language other than English and the pr<strong>of</strong>iciency in English is such that the probability <strong>of</strong> the<br />
student’s academic success in an English-only classroom is below that <strong>of</strong> an academically<br />
successful peer with an English language background.<br />
Figure 83<br />
PERCENT OF IOWA EIGHTH GRADE STUDENTS PERFORMING AT OR<br />
ABOVE PROFICIENT LEVEL ON ITBS SCIENCE TEST BY<br />
MIGRANT STATUS*, BIENNIUM PERIOD 2001-2003 (2000 NORMS)<br />
100<br />
80<br />
77.8<br />
Percent<br />
60<br />
40<br />
20<br />
42.9<br />
0<br />
Migrant<br />
Non-Migrant<br />
Migrant Status<br />
188<br />
Source:<br />
Notes:<br />
<strong>Iowa</strong> Testing Programs, University <strong>of</strong> <strong>Iowa</strong>.<br />
A student designated as pr<strong>of</strong>icient can, at a minimum, do the following:<br />
Sometimes understands ideas related to Earth, the universe, and the life science.<br />
Usually understands ideas related to the physical sciences and <strong>of</strong>ten can demonstrate<br />
the skills <strong>of</strong> scientific inquiry.<br />
*Migrant Status is defined as migrant or non-migrant as follows: Migrant — a student is considered<br />
a migrant if he or she has moved in the past 36 months from one district to another so that the<br />
parents could obtain temporary or seasonal employment in agriculture as their principal means<br />
<strong>of</strong> livelihood.
Figure 84<br />
Source:<br />
Note:<br />
Figure 85<br />
Percent<br />
100<br />
80<br />
60<br />
40<br />
20<br />
0<br />
82.4<br />
75.3 78.7<br />
Female Male Total<br />
PERCENT OF IOWA ELEVENTH GRADE STUDENTS PERFORMING AT OR<br />
ABOVE PROFICIENT LEVEL ON ITED SCIENCE TEST BY RACE/ETHNICITY<br />
Source:<br />
Note:<br />
PERCENT OF IOWA ELEVENTH GRADE STUDENTS PERFORMING<br />
AT OR ABOVE PROFICIENT LEVEL ON ITED SCIENCE TEST<br />
BY GENDER, BIENNIUM PERIOD 2001-2003 (2000 NORMS)<br />
<strong>Iowa</strong> Testing Programs, University <strong>of</strong> <strong>Iowa</strong>.<br />
A student designated as pr<strong>of</strong>icient can, at a minimum, do the following:<br />
Sometimes makes inferences or predictions from data, judges the relevance and adequacy <strong>of</strong><br />
information, and recognizes the rationale for and limitations <strong>of</strong> scientific procedures.<br />
Percent<br />
100<br />
80<br />
60<br />
40<br />
20<br />
0<br />
BIENNIUM PERIOD 2001-2003 (2000 NORMS)<br />
80.4<br />
White<br />
50.5<br />
African<br />
American<br />
57.8<br />
<strong>Iowa</strong> Testing Programs, University <strong>of</strong> <strong>Iowa</strong>.<br />
A student designated as pr<strong>of</strong>icient can, at a minimum, do the following:<br />
Sometimes makes inferences or predictions from data, judges the relevance and adequacy <strong>of</strong><br />
information, and recognizes the rationale for and limitations <strong>of</strong> scientific procedures.<br />
78.2<br />
61.3<br />
Hispanic Asian American<br />
Indian<br />
Race/Ethnicity<br />
STUDENT PERFORMANCE — <strong>State</strong> Indicators <strong>of</strong> Student Success<br />
189
Figure 86<br />
PERCENT OF IOWA ELEVENTH GRADE STUDENTS PERFORMING AT OR<br />
ABOVE PROFICIENT LEVEL ON ITED SCIENCE TEST BY<br />
SOCIOECONOMIC STATUS*, BIENNIUM PERIOD 2001-2003 (2000 NORMS)<br />
Percent<br />
100<br />
80<br />
60<br />
40<br />
20<br />
0<br />
63.8<br />
Eligible for Free or Reduced<br />
Price Meals<br />
Percent<br />
81.4<br />
Eligible for 63.8<br />
Not Eligibl 81.4<br />
Not Eligible for Free or<br />
Reduced Price Meals<br />
Socioeconomic Status<br />
Source:<br />
Notes:<br />
<strong>Iowa</strong> Testing Programs, University <strong>of</strong> <strong>Iowa</strong>.<br />
A student designated as pr<strong>of</strong>icient can, at a minimum, do the following:<br />
Sometimes makes inferences or predictions from data, judges the relevance and adequacy <strong>of</strong><br />
information, and recognizes the rationale for and limitations <strong>of</strong> scientific procedures.<br />
*Socioeconomic Status is determined by eligibility for free or reduced price meals.<br />
Figure 87<br />
PERCENT OF IOWA ELEVENTH GRADE STUDENTS PERFORMING AT OR<br />
ABOVE PROFICIENT LEVEL ON ITED SCIENCE TEST BY<br />
DISABILITY STATUS*, BIENNIUM PERIOD 2001-2003 (2000 NORMS)<br />
Percent<br />
90<br />
80<br />
70<br />
60<br />
50<br />
40<br />
30<br />
20<br />
10<br />
0<br />
35.0<br />
Disability<br />
Disability Status<br />
83.0<br />
No Disability<br />
Source:<br />
Notes:<br />
<strong>Iowa</strong> Testing Programs, University <strong>of</strong> <strong>Iowa</strong>.<br />
A student designated as pr<strong>of</strong>icient can, at a minimum, do the following:<br />
Sometimes makes inferences or predictions from data, judges the relevance and adequacy <strong>of</strong><br />
information, and recognizes the rationale for and limitations <strong>of</strong> scientific procedures.<br />
*Disability Status is determined by the presence <strong>of</strong> an individualized education plan (IEP).<br />
190
Figure 88<br />
Source:<br />
Notes:<br />
Figure 89<br />
Source:<br />
Notes:<br />
PERCENT OF IOWA ELEVENTH GRADE STUDENTS PERFORMING AT OR<br />
ABOVE PROFICIENT LEVEL ON ITED SCIENCE TEST BY<br />
PRIMARY LANGUAGE STATUS*, BIENNIUM PERIOD 2001-2003 (2000 NORMS)<br />
Percent<br />
<strong>Iowa</strong> Testing Programs, University <strong>of</strong> <strong>Iowa</strong>.<br />
A student designated as pr<strong>of</strong>icient can, at a minimum, do the following:<br />
Sometimes makes inferences or predictions from data, judges the relevance and adequacy <strong>of</strong><br />
information, and recognizes the rationale for and limitations <strong>of</strong> scientific procedures.<br />
*Primary Language Status is classified by English and English Language Learners and determined<br />
according to the following definition: English Language Learner refers to a student who has a<br />
language other than English and the pr<strong>of</strong>iciency in English is such that the probability <strong>of</strong> the<br />
student’s academic success in an English-only classroom is below that <strong>of</strong> an academically<br />
successful peer with an English language background.<br />
PERCENT OF IOWA ELEVENTH GRADE STUDENTS PERFORMING AT OR<br />
ABOVE PROFICIENT LEVEL ON ITED SCIENCE TEST<br />
BY MIGRANT STATUS*, BIENNIUM PERIOD 2001-2003 (2000 NORMS)<br />
Percent<br />
100<br />
80<br />
60<br />
40<br />
20<br />
0<br />
100<br />
80<br />
60<br />
40<br />
20<br />
0<br />
41.0<br />
ELL*<br />
40.9<br />
Migrant<br />
<strong>Iowa</strong> Testing Programs, University <strong>of</strong> <strong>Iowa</strong>.<br />
A student designated as pr<strong>of</strong>icient can, at a minimum, do the following:<br />
Sometimes makes inferences or predictions from data, judges the relevance and adequacy <strong>of</strong><br />
information, and recognizes the rationale for and limitations <strong>of</strong> scientific procedures.<br />
*Migrant Status is defined as migrant or non-migrant as follows: Migrant — a student is considered<br />
a migrant if he or she has moved in the past 36 months from one district to another so that the<br />
parents could obtain temporary or seasonal employment in agriculture as their principal means<br />
<strong>of</strong> livelihood.<br />
79.2<br />
English<br />
Primary Language Status<br />
Migrant Status<br />
79.2<br />
Non-Migrant<br />
STUDENT PERFORMANCE — <strong>State</strong> Indicators <strong>of</strong> Student Success<br />
191
Dropouts<br />
Indicator: Percentage <strong>of</strong> students considered as dropouts for grades 7-12, reported for all<br />
students, by gender, and by race/ethnicity.<br />
Figure 90<br />
IOWA GRADE 7-12 DROPOUTS AS A PERCENT OF<br />
PUBLIC SCHOOL STUDENTS IN GRADES 7-12<br />
1985-1986, 1990-1991 TO 2001-2002<br />
3.0<br />
2.5<br />
2.0<br />
2.29<br />
2.49<br />
2.30<br />
2.23<br />
2.11<br />
2.21<br />
2.10<br />
2.02 1.98<br />
1.74 1.75<br />
1.85<br />
1.62<br />
Percent<br />
1.5<br />
1.0<br />
0.5<br />
0.0<br />
//<br />
85-86 90-91 91-92 92-93 93-94 94-95 95-96 96-97 97-98 98-99 99-00 00-01 01-02<br />
School Year<br />
Source:<br />
<strong>Iowa</strong> Department <strong>of</strong> Education, Bureau <strong>of</strong> Planning, Research, and Evaluation, Basic Educational<br />
Data Survey, Dropout Files.<br />
Figure 91<br />
IOWA GRADE 7-12 DROPOUTS AS A PERCENT OF<br />
PUBLIC SCHOOL STUDENTS IN GRADES 7-12 BY GENDER<br />
1994-1995 THROUGH 2001-2002<br />
3.0<br />
2.5<br />
2.0<br />
2.54<br />
2.38<br />
2.27 2.22<br />
1.87<br />
1.99<br />
2.08<br />
1.79<br />
Percent<br />
1.5<br />
1.0<br />
1.87 1.81<br />
1.75 1.73<br />
1.59<br />
1.51<br />
1.60<br />
1.45<br />
0.5<br />
Males<br />
Females<br />
0.0<br />
1995 1996 1997 1998 1999 2000 2001 2002<br />
School Year Ending<br />
192<br />
Source:<br />
<strong>Iowa</strong> Department <strong>of</strong> Education, Bureau <strong>of</strong> Planning, Research, and Evaluation, Basic Educational<br />
Data Survey, Dropout Files.
Figure 92<br />
Percent<br />
Source:<br />
IOWA GRADE 7-12 DROPOUTS AS A PERCENT OF<br />
PUBLIC SCHOOL STUDENTS IN GRADES 7-12 BY RACE/ETHNICITY<br />
1996-1997 THROUGH 2001-2002<br />
10<br />
9<br />
8<br />
7<br />
6<br />
5<br />
4<br />
3<br />
2<br />
1<br />
0<br />
1.83<br />
1.77<br />
1.55<br />
1.59<br />
1.61<br />
1.40<br />
White<br />
5.49<br />
5.23<br />
1996-1997 1997-1998 1998-1999<br />
1999-2000 2000-2001 2001-2002<br />
3.82<br />
3.68<br />
4.72<br />
4.35<br />
African<br />
American<br />
5.74<br />
6.46<br />
6.12<br />
5.20<br />
1.62<br />
1.72<br />
1.65<br />
1.59<br />
1.58<br />
1.85<br />
<strong>Iowa</strong> Department <strong>of</strong> Education, Bureau <strong>of</strong> Planning, Research, and Evaluation, Basic Educational<br />
Data Survey, Dropout Files.<br />
5.80<br />
4.55<br />
5.29<br />
5.82<br />
5.41<br />
5.03<br />
6.64<br />
Hispanic Asian American<br />
Indian<br />
Race/Ethnicity<br />
4.18<br />
STUDENT PERFORMANCE — <strong>State</strong> Indicators <strong>of</strong> Student Success<br />
193
High School Graduation Rates<br />
Indicator: Percent <strong>of</strong> high school students who graduate, reported for all students, by gender, and<br />
by race/ethnicity.<br />
Figure 93<br />
IOWA PUBLIC SCHOOL GRADUATION RATES<br />
GRADUATING CLASSES OF 1996 THROUGH 2002<br />
100%<br />
90%<br />
87.0% 87.2% 88.1% 88.2% 88.7% 89.2% 89.4%<br />
Graduation Rate<br />
80%<br />
70%<br />
60%<br />
50%<br />
1996 1997 1998 1999 2000 2001 2002<br />
Graduating Class<br />
Source:<br />
Note:<br />
<strong>Iowa</strong> Department <strong>of</strong> Education, Bureau <strong>of</strong> Planning, Research, and Evaluation, Basic Educational<br />
Data Survey, High School Completers and Dropout Files.<br />
A high school graduate includes regular diploma, and other diploma recipients. Graduation rates<br />
were calculated dividing the number <strong>of</strong> high school graduates in a given year by the sum <strong>of</strong> the<br />
number <strong>of</strong> high school graduates in that year and dropouts over a four year period. More specifically,<br />
the total dropouts include the number <strong>of</strong> dropouts in grade 9 in year 1, the number <strong>of</strong> dropouts<br />
in grade 10 in year 2, the number <strong>of</strong> dropouts in grade 11 in year 3, and the number <strong>of</strong> dropouts<br />
in grade 12 in year 4. The high school graduation rate in year 4 equals the number <strong>of</strong> high<br />
school graduates in year 4 divided by the number <strong>of</strong> high school graduates in year 4 plus the<br />
sum <strong>of</strong> dropouts in grades 9 through 12 from years 1 through 4 respectively.<br />
Figure 94<br />
IOWA PUBLIC SCHOOL GRADUATION RATES BY GENDER<br />
GRADUATING CLASSES OF 1996 THROUGH 2002<br />
100<br />
Females<br />
Males<br />
90<br />
88.8 88.8 89.7 89.7 90.3 90.5 90.6<br />
87.9 88.3<br />
85.2 85.6 86.5 86.8 87.2<br />
Percent<br />
80<br />
70<br />
60<br />
50<br />
1996 1997 1998 1999 2000 2001 2002<br />
Graduating Class<br />
194<br />
Source:<br />
<strong>Iowa</strong> Department <strong>of</strong> Education, Bureau <strong>of</strong> Planning, Research, and Evaluation, Basic Educational<br />
Data Survey, High School Completers and Dropout Files.
Figure 95<br />
Percent<br />
100<br />
90<br />
80<br />
70<br />
60<br />
50<br />
40<br />
30<br />
20<br />
10<br />
0<br />
46.2<br />
Source:<br />
IOWA HIGH SCHOOL GRADUATION RATES BY RACE/ETHNICITY<br />
GRADUATING CLASSES OF 1996, 1998, 2000 AND 2002<br />
62.2<br />
62.1<br />
1996 1998<br />
2000 2002<br />
61.7<br />
67.1<br />
72.0<br />
64.9<br />
67.5<br />
84.4<br />
88.0<br />
American Indian Hispanic Asian African American White<br />
Race/Ethnicity<br />
86.4<br />
<strong>Iowa</strong> Department <strong>of</strong> Education, Bureau <strong>of</strong> Planning, Research, and Evaluation, Basic Educational<br />
Data Survey, High School Completers and Dropout Files.<br />
90.9<br />
63.8<br />
67.6<br />
68.4<br />
71.4<br />
88.2<br />
89.1<br />
90.0<br />
90.7<br />
STUDENT PERFORMANCE — <strong>State</strong> Indicators <strong>of</strong> Student Success<br />
195
Postsecondary Education/Training Intentions<br />
Indicator: Percentage <strong>of</strong> high school graduates/seniors pursuing or intending to pursue<br />
postsecondary education/training, reported for all students and by gender. (Data will be reported<br />
by race/ethnicity and by disability at such time when all school districts are participating in the<br />
Department’s electronic data interchange initiative.)<br />
Figure 96<br />
PERCENT OF ALL IOWA PUBLIC SCHOOL GRADUATES/SENIORS<br />
PURSUING OR INTENDING TO PURSUE POSTSECONDARY EDUCATION/<br />
TRAINING, GRADUATING CLASSES OF 1985 AND 1992-2003<br />
100<br />
90<br />
80<br />
71.3 71.0 71.0 71.9 71.9 72.5 73.7<br />
75.8<br />
78.7<br />
82.7 82.4 82.9<br />
70<br />
61.4<br />
60<br />
Percent<br />
50<br />
40<br />
30<br />
20<br />
10<br />
0<br />
//<br />
1985 1992 1993 1994 1995 1996 1997 1998 1999 2000 2001 2002 2003<br />
Graduating Class<br />
Source:<br />
Note:<br />
<strong>Iowa</strong> Department <strong>of</strong> Education, Bureau <strong>of</strong> Planning, Research, and Evaluation, Basic Educational<br />
Data Survey Files.<br />
Due to the transition from collecting data on a graduate follow-up basis to collecting intentions<br />
for graduates, data for the graduating classes <strong>of</strong> 1997, 1998 and 1999 represent calculated estimates.<br />
Figure 97<br />
PERCENT OF IOWA PUBLIC SCHOOL GRADUATES/SENIORS<br />
PURSUING OR INTENDING TO PURSUE POSTSECONDARY EDUCATION/<br />
TRAINING BY GENDER, GRADUATING CLASSES OF 1998 TO 2003<br />
100<br />
90<br />
80<br />
70<br />
78.4<br />
80.9 82.9<br />
68.8 70.7<br />
Female<br />
74.5<br />
Male<br />
87.5 86.9 87.8<br />
77.8 77.9 78.0<br />
Percent<br />
60<br />
50<br />
40<br />
30<br />
20<br />
10<br />
0<br />
1998 1999 2000 2001 2002 2003<br />
Graduating Class<br />
196<br />
Source:<br />
Note:<br />
<strong>Iowa</strong> Department <strong>of</strong> Education, Bureau <strong>of</strong> Planning, Research, and Evaluation, Basic Educational<br />
Data Survey Files.<br />
Due to the transition from collecting data on a graduate follow-up basis to collecting intentions<br />
for graduates, data for the graduating classes <strong>of</strong> 1998 and 1999 represent calculated estimates.
Probable Postsecondary Success<br />
Indicator: Percentage <strong>of</strong> students achieving an ACT score above the national average and<br />
the percentage <strong>of</strong> students achieving an ACT score <strong>of</strong> 20 or above.<br />
Figure 98<br />
PERCENT OF IOWA ACT PARTICIPANTS ACHIEVING AN ACT SCORE<br />
ABOVE THE NATIONAL AVERAGE AND AN ACT SCORE OF 20 OR ABOVE<br />
1991-2003<br />
Source:<br />
Note:<br />
Percent<br />
Figure 99<br />
Source:<br />
Note:<br />
100<br />
90<br />
80<br />
70<br />
60<br />
50<br />
40<br />
30<br />
20<br />
10<br />
0<br />
67.1 65.9 67.6 68.9 67.5 68.4 69.3 70.1 68.8 68.8 68.9 68.8 69.3<br />
* * * * * * *<br />
61.8 60.6 61.3 61.6 60.6 60.7 60.9 62.0 60.3 60.3 60.3 62.1 62.4<br />
% Above Natl Avg<br />
% Scoring 20 or Above<br />
1991 1992 1993 1994 1995 1996 1997 1998 1999 2000 2001 2002 2003<br />
Graduating Class<br />
American College Testing Program, The High School Pr<strong>of</strong>ile Report for <strong>Iowa</strong>.<br />
The actual percentage <strong>of</strong> <strong>Iowa</strong> students with ACT scores above the national average are shown where the<br />
national average score is a whole number. Years shown as estimates are marked with an asterisk(*) where the national<br />
average score is not a whole number.<br />
PERCENT OF IOWA ACT PARTICIPANTS COMPLETING<br />
CORE HIGH SCHOOL PROGRAM —1991-2003<br />
Percent<br />
100<br />
90<br />
80<br />
70<br />
60<br />
50<br />
40<br />
30<br />
20<br />
10<br />
0<br />
58.0 59.4<br />
61.6 62.2 63.1<br />
65.8 66.0<br />
68.0<br />
66.0 66.0 66.0 66.0 66.0<br />
1991 1992 1993 1994 1995 1996 1997 1998 1999 2000 2001 2002 2003<br />
Graduating Class<br />
American College Testing Program, The High School Pr<strong>of</strong>ile Report for <strong>Iowa</strong>.<br />
ACT classifies high school programs consisting <strong>of</strong> four years <strong>of</strong> English and three or more years<br />
each <strong>of</strong> mathematics, natural science, and social studies as “core” programs.<br />
STUDENT PERFORMANCE — <strong>State</strong> Indicators <strong>of</strong> Student Success<br />
197
<strong>Iowa</strong> Testing Programs<br />
<strong>Iowa</strong> Testing Programs (ITP), an academic unit in the College <strong>of</strong> Education at the University<br />
<strong>of</strong> <strong>Iowa</strong>, develop standardized achievement tests for use nationally in grades K-12 and<br />
administer statewide achievement testing programs for the schools <strong>of</strong> <strong>Iowa</strong>. <strong>Iowa</strong> Testing<br />
Programs <strong>of</strong>fers two achievement test batteries, the <strong>Iowa</strong> Tests <strong>of</strong> Basic Skills (ITBS), for<br />
students in grades K through 8; and the <strong>Iowa</strong> Tests <strong>of</strong> Educational Development (ITED), for<br />
students in grades 9-12. ITBS and ITED are the primary academic assessments for <strong>Iowa</strong><br />
students in grades 3 through 12. The <strong>State</strong> Board <strong>of</strong> Education request student performance<br />
on ITBS and ITED reading comprehension and mathematics for grades 4, 8, and 11 and<br />
student performance on ITBS and ITED science for grades 8 and 11 as state indicators. All<br />
<strong>Iowa</strong> public schools will be evaluated by student performance and improvement on the ITBS<br />
and ITED for purposes <strong>of</strong> the No Child Left Behind (NCLB) accountability. During the 2002-<br />
2003 school year, 371 <strong>Iowa</strong> public school districts and approximately 208 nonpublic schools<br />
participated in the ITP achievement assessments.<br />
<strong>Iowa</strong> Tests <strong>of</strong> Basic Skills (ITBS)<br />
The ITBS program <strong>of</strong>fers levels 5-8 for students in kindergarten through grade 2 and levels<br />
9-14 tests for students in grades 3 through 8.<br />
The ITBS levels 9-14 battery includes 13 tests and two additional tests for Level 9 only. The<br />
tests are listed below: 1) Vocabulary, 2) Reading Comprehension, 3) Spelling, 4) Capitalization,<br />
5) Punctuation, 6) Usage and Expression, 7) Math Concepts and Estimation, 8) Math Problem<br />
Solving and Data Interpretation, 9) Math Computation, 10) Social Studies, 11) Science,<br />
12) Maps and Diagrams, and 13) Reference Materials. The two additional tests are Word<br />
Analysis and Listening.<br />
<strong>Iowa</strong> Testing Programs provide the state average trend lines for the years <strong>of</strong> 1985 to 2001 on<br />
the ITBS composite, Reading Comprehension, and Mathematics total scores for <strong>Iowa</strong><br />
students in grades 3-8. Since 2001, there has been a transition <strong>of</strong> Forms A and B <strong>of</strong> the ITBS<br />
with 2000 national norms for <strong>Iowa</strong> schools to replace Forms K and L with 1992 national<br />
norms. According to the <strong>Iowa</strong> Testing Programs, “After the 2003-2004 school year, sufficient<br />
data will be available to warrant sketching the first segments <strong>of</strong> new achievement trend lines.”<br />
Figures 100-102 show ITBS average composite scores since 1984-1985. In general, average<br />
composite scores for <strong>Iowa</strong> students in grades three through eight showed increases from 1984-<br />
1985 through 1990-1991 and experienced a general decline thereafter. Except in grade five,<br />
average ITBS composite scores in grades three through eight have shown small, but steady,<br />
annual declines over the last eight to nine years. Grade seven has experienced the greatest<br />
decline across the six grades shown in Figure 100. In 1989-1990, the average grade equivalent<br />
was 7.44 declining to 7.07 in 2000-2001. The average grade equivalent score for <strong>Iowa</strong> students<br />
in grades three and four did not decline between 1999-2000 and 2000-2001.<br />
198
Figure 100<br />
IOWA ITBS AVERAGE COMPOSITE SCORES FOR GRADES 3-8, 1985-2001<br />
IN TERMS OF 1965 “BASE YEAR” IOWA GRADE EQUIVALENTS<br />
9.5<br />
8.5<br />
8.25<br />
8.29<br />
8.35<br />
8.42<br />
8.37<br />
8.39<br />
8.43<br />
8.40<br />
8.41<br />
8.40<br />
8.38<br />
8.37<br />
8.32<br />
8.29<br />
8.27<br />
8.23<br />
8.18<br />
Grade 8<br />
Student Performance<br />
<strong>State</strong> Indicators <strong>of</strong> Student Success<br />
7.5<br />
7.32<br />
7.36<br />
7.41<br />
7.42<br />
7.38<br />
7.44<br />
7.42<br />
7.41<br />
7.38<br />
7.35<br />
7.31<br />
7.27<br />
7.23<br />
7.22<br />
7.17<br />
7.10<br />
7.07<br />
Grade 7<br />
<strong>Iowa</strong> Grade Equivalent<br />
6.5<br />
6.51<br />
6.54<br />
6.57<br />
6.60<br />
6.59<br />
6.60<br />
6.59<br />
6.58<br />
6.57<br />
6.55<br />
6.52<br />
6.49<br />
6.47<br />
6.44<br />
6.38<br />
6.33<br />
6.31<br />
Grade 6<br />
5.5<br />
5.57<br />
5.62<br />
5.67<br />
5.70<br />
5.69<br />
5.70<br />
5.70<br />
5.71<br />
5.70<br />
5.69<br />
5.69<br />
5.69<br />
5.67<br />
5.63<br />
5.59<br />
5.58<br />
5.56<br />
Grade 5<br />
3.78<br />
3.81<br />
3.81<br />
3.86<br />
3.87<br />
3.89<br />
3.88<br />
3.86<br />
3.83<br />
3.80<br />
3.77<br />
3.74<br />
3.72<br />
3.71<br />
3.69<br />
3.66<br />
3.66<br />
4.68<br />
4.70<br />
4.73<br />
4.74<br />
4.75<br />
4.76<br />
4.76<br />
4.77<br />
4.73<br />
4.72<br />
4.69<br />
4.66<br />
4.63<br />
4.60<br />
4.55<br />
4.52<br />
4.52<br />
4.5<br />
Grade 4<br />
3.5<br />
85 86 87 88 89 90 91 92 93 94 95 96 97 98 99 00 01<br />
School Year Ending<br />
Grade 3<br />
Source: <strong>Iowa</strong> Testing Programs, University <strong>of</strong> <strong>Iowa</strong>.<br />
Notes: Baseline is midyear <strong>of</strong> 1965.<br />
The 1985-1993 composite does not include social studies and science.<br />
199
Average ITBS Reading Comprehension grade equivalent scores for <strong>Iowa</strong> students in grades<br />
three through eight have shown a general decline over the past 12 to 14 years in most grades.<br />
Scores for grades three and four represent the first departure from the declines <strong>of</strong> the recent<br />
years (Figure 101). Average grade equivalent scores for grades three and four increased<br />
between 1999-2000 and 2000-2001. The average grade equivalent scores in grades three<br />
through eight were the highest in 1987-1988 for the time period 1984-1985 to 2000-2001.<br />
The greatest decrease in grade equivalent scores since 1984-1985 occurred in grade seven.<br />
Figure 101<br />
IOWA ITBS AVERAGE READING COMPREHENSION SCORES<br />
FOR GRADES 3-8, 1985-2001<br />
IN TERMS OF 1965 “BASE YEAR” IOWA GRADE EQUIVALENTS<br />
8.5<br />
8.03<br />
8.07<br />
8.13<br />
8.15<br />
8.11<br />
8.13<br />
8.14<br />
8.10<br />
8.12<br />
8.11<br />
8.09<br />
8.08<br />
8.03<br />
7.99<br />
7.96<br />
7.92<br />
7.87<br />
Grade 8<br />
7.5<br />
7.26<br />
7.29<br />
7.34<br />
7.38<br />
7.32<br />
7.36<br />
7.32<br />
7.27<br />
7.25<br />
7.22<br />
7.20<br />
7.17<br />
7.14<br />
7.13<br />
7.09<br />
7.00<br />
6.97<br />
Grade 7<br />
<strong>Iowa</strong> Grade Equivalent<br />
6.5<br />
5.5<br />
6.45<br />
5.51<br />
6.48<br />
5.55<br />
6.51<br />
5.61<br />
6.55<br />
5.64<br />
6.51<br />
5.60<br />
6.50<br />
5.60<br />
6.48<br />
5.58<br />
6.45<br />
5.57<br />
6.45<br />
5.57<br />
6.43<br />
5.56<br />
6.41<br />
5.54<br />
6.38<br />
5.53<br />
6.35<br />
5.50<br />
6.32<br />
5.46<br />
6.25<br />
5.40<br />
6.19<br />
5.36<br />
6.17<br />
5.33<br />
Grade 6<br />
Grade 5<br />
4.5<br />
4.64<br />
4.66<br />
4.67<br />
4.67<br />
4.66<br />
4.66<br />
4.63<br />
4.64<br />
4.61<br />
4.59<br />
4.57<br />
4.54<br />
4.53<br />
4.50<br />
4.45<br />
4.43<br />
4.44<br />
Grade 4<br />
3.85<br />
3.88<br />
3.90<br />
3.91<br />
3.90<br />
3.91<br />
3.90<br />
3.85<br />
3.80<br />
3.76<br />
3.73<br />
3.70<br />
3.67<br />
3.65<br />
3.62<br />
3.61<br />
3.62<br />
Grade 3<br />
3.5<br />
85 86 87 88 89 90 91 92 93 94 95 96 97 98 99 00 01<br />
School Year Ending<br />
Source: <strong>Iowa</strong> Testing Programs, University <strong>of</strong> <strong>Iowa</strong>.<br />
Note: Baseline is midyear <strong>of</strong> 1965.<br />
200
Average ITBS Mathematics Total grade equivalent scores showed gradual increases from<br />
1985 through the early 1990s in grades three through eight. From the early 1990s to 2001,<br />
average Mathematics Total scores showed a gradual decline in grades three and four, while<br />
scores for grades five through eight remained relatively stable (Figure 102).<br />
Figure 102<br />
8.5<br />
IOWA ITBS AVERAGE MATHEMATICS TOTAL SCORES FOR<br />
GRADES 3-8, 1985-2001<br />
IN TERMS OF 1965 “BASE YEAR” IOWA GRADE EQUIVALENTS<br />
7.97<br />
8.00<br />
8.03<br />
8.14<br />
8.12<br />
8.14<br />
8.21<br />
8.21<br />
8.23<br />
8.24<br />
8.26<br />
8.27<br />
8.26<br />
8.24<br />
8.24<br />
8.22<br />
8.19<br />
Grade 8<br />
Student Performance<br />
<strong>State</strong> Indicators <strong>of</strong> Student Success<br />
7.5<br />
7.04<br />
7.08<br />
7.12<br />
7.17<br />
7.14<br />
7.23<br />
7.25<br />
7.26<br />
7.24<br />
7.24<br />
7.25<br />
7.23<br />
7.24<br />
7.24<br />
7.20<br />
7.14<br />
7.13<br />
Grade 7<br />
<strong>Iowa</strong> Grade Equivalent<br />
6.5<br />
5.5<br />
6.12<br />
5.28<br />
6.17<br />
5.34<br />
6.22<br />
5.41<br />
6.26<br />
5.44<br />
6.30<br />
5.47<br />
6.33<br />
5.49<br />
6.33<br />
5.50<br />
6.34<br />
5.52<br />
6.37<br />
5.52<br />
6.38<br />
5.54<br />
6.39<br />
5.57<br />
6.39<br />
5.59<br />
6.41<br />
5.59<br />
6.39<br />
5.56<br />
6.34<br />
5.53<br />
6.30<br />
5.52<br />
6.30<br />
5.53<br />
Grade 6<br />
Grade 5<br />
4.5<br />
4.46<br />
4.49<br />
4.52<br />
4.57<br />
4.59<br />
4.62<br />
4.62<br />
4.64<br />
4.62<br />
4.62<br />
4.61<br />
4.61<br />
4.58<br />
4.56<br />
4.53<br />
4.53<br />
4.55<br />
Grade 4<br />
3.64<br />
3.67<br />
3.71<br />
3.75<br />
3.76<br />
3.79<br />
3.79<br />
3.80<br />
3.80<br />
3.79<br />
3.77<br />
3.75<br />
3.73<br />
3.73<br />
3.71<br />
3.71<br />
3.72<br />
Grade 3<br />
3.5<br />
85 86 87 88 89 90 91 92 93 94 95 96 97 98 99 00 01<br />
Year Ending<br />
Source: <strong>Iowa</strong> Testing Programs, University <strong>of</strong> <strong>Iowa</strong>.<br />
Notes: Baseline is midyear <strong>of</strong> 1965.<br />
The Math Total does not include Math Computation.<br />
201
<strong>Iowa</strong> Tests <strong>of</strong> Educational Development (ITED)<br />
The ITED program <strong>of</strong>fers levels 15-17/18 tests for students in grades 9-12. The battery<br />
includes: 1) Vocabulary, 2) Reading Comprehension, 3) Language: Revising Written<br />
Materials, 4) Spelling, 5) Mathematics: Concepts and Problem Solving, 6) Computation, 7)<br />
Analysis <strong>of</strong> Social Studies Materials, 8) Analysis <strong>of</strong> Science Materials, and 9) Sources <strong>of</strong><br />
Information.<br />
<strong>Iowa</strong> Testing Programs provides the state average trend data for 1985 to 2000 on the ITED<br />
composite, Reading Comprehension, Mathematics total, and Science scores for <strong>Iowa</strong><br />
students in grades 9-11. Since 2001, there has been a transition <strong>of</strong> Forms A and B <strong>of</strong> the ITED<br />
with 2000 national norms for <strong>Iowa</strong> schools to replace Forms K and L with 1992 national<br />
norms. According to the <strong>Iowa</strong> Testing Programs, “After the 2003-2004 school year, sufficient<br />
data will be available to warrant sketching the first segments <strong>of</strong> new achievement trend lines.”<br />
Average ITED composite scores for <strong>Iowa</strong> students in grades nine through eleven showed<br />
increases from 1985 through 1993, were generally stable from 1993 through 1996, and have<br />
shown a slight decline over the last four years (Figure 103).<br />
Figure 103<br />
IOWA ITED AVERAGE COMPOSITE SCORES FOR GRADES 9-11<br />
1985-2000<br />
21<br />
20<br />
19<br />
Grade 11<br />
19.0 19.0 18.9<br />
18.8<br />
19.4<br />
19.3 19.3<br />
19.2<br />
291 292 292 292 292 290 289 287 288<br />
292<br />
18<br />
Old Standard Score<br />
17<br />
16<br />
15<br />
Grade 10<br />
17.1 17.1<br />
282<br />
16.6 16.7 16.8 16.9 16.9<br />
16.6<br />
282 283 283 282 282 281 280 279 279<br />
15.4<br />
Grade 9<br />
15.3 15.3 274<br />
15.2<br />
15.1<br />
14.6 14.7 14.8 274 275 275 274 274 282 272 271 271<br />
New Standard Score<br />
14<br />
13<br />
85 86 87 88 89 90 91 92 93 94 95 96 97 98 99 00<br />
Year<br />
202<br />
Source:<br />
Notes:<br />
<strong>Iowa</strong> Testing Programs, University <strong>of</strong> <strong>Iowa</strong>.<br />
In 1993 new scale scores were developed for ITED; therefore, both old and new scales are shown so<br />
that a consistent trend line can be provided. Scores provided are based on fall testing.
Figure 104 presents <strong>Iowa</strong> ITED average Reading Comprehension scores from 1985 through<br />
2000 for grades nine, ten, and eleven. Scores were stable through 1996 and have experienced<br />
a slight decline over the last four years.<br />
Figure 104<br />
21<br />
IOWA ITED AVERAGE READING COMPREHENSION SCORES<br />
FOR GRADES 9-11<br />
1985-2000<br />
Student Performance<br />
<strong>State</strong> Indicators <strong>of</strong> Student Success<br />
20<br />
19<br />
Old Standard Score<br />
18<br />
17<br />
16<br />
17.2<br />
15.6<br />
17.6<br />
15.8<br />
17.4 17.4 17.5 17.6 17.5 17.5<br />
292 292<br />
Grade 11<br />
15.9 15.9<br />
15.8 15.8<br />
15.7<br />
15.6<br />
293<br />
292 293 289 290 286<br />
289<br />
292<br />
278<br />
New Standard Score<br />
New Standard Score<br />
281 281 282<br />
279<br />
281<br />
278 278<br />
276 277<br />
15<br />
Grade 10<br />
14<br />
13.8<br />
14.0 14.1 14.3 14.3<br />
14.4 14.4 14.4<br />
274 274 274<br />
272<br />
274<br />
270 272 268<br />
271<br />
274<br />
13<br />
Grade 9<br />
85 86 87 88 89 90 91 92 93 94 95 96 97 98 99 00<br />
Year<br />
Source:<br />
Notes:<br />
<strong>Iowa</strong> Testing Programs, University <strong>of</strong> <strong>Iowa</strong>.<br />
In 1993 new scale scores were developed for ITED; therefore, both old and new scales are shown so<br />
that a consistent trend line can be provided. Scores provided are based on fall testing.<br />
203
Average ITED Mathematics scores for <strong>Iowa</strong> students in grades nine through eleven showed<br />
a general upward trend from 1986 through 1992, with scores remaining generally stable<br />
through 2000 (Figure 105).<br />
Figure 105<br />
IOWA ITED AVERAGE MATHEMATICS SCORES<br />
FOR GRADES 9-11<br />
1985-2000<br />
21<br />
20<br />
19<br />
18<br />
Grade 11<br />
17.3 17.3 17.4 17.8<br />
18.0<br />
18.2 18.2<br />
296 296 295<br />
298<br />
296 297 294 295 293<br />
296<br />
Old Standard Score<br />
17<br />
16<br />
16.8<br />
Grade 10<br />
15.3<br />
15.2<br />
15.1 15.0<br />
15.5 15.6 15.8<br />
16.0<br />
287 287 287 288 288 288<br />
286 286 285<br />
288<br />
New Standard Score<br />
15<br />
14<br />
Grade 9<br />
13.4 13.3<br />
13.5<br />
13.7<br />
13.9<br />
14.1 14.2 14.4<br />
278 280 280 280 280 280 279 278 278<br />
282<br />
13<br />
85 86 87 88 89 90 91 92 93 94 95 96 97 98 99 00<br />
Year<br />
Source:<br />
Notes:<br />
<strong>Iowa</strong> Testing Programs, University <strong>of</strong> <strong>Iowa</strong>.<br />
In 1993 new scale scores were developed for ITED; therefore, both old and new scales are shown so<br />
that a consistent trend line can be provided. Scores provided are based on fall testing.<br />
204
<strong>Iowa</strong> average ITED Science scores for students in grades nine through eleven have shown a<br />
generally stable pattern from 1993 through 2000, after a period reflecting increases from 1986<br />
through 1992 (Figure 106).<br />
Figure 106<br />
21<br />
20<br />
19<br />
18<br />
IOWA ITED AVERAGE SCIENCE SCORES FOR GRADES 9-11<br />
1985-2000<br />
18.6<br />
Grade 11<br />
18.2 18.1 18.1<br />
18.3<br />
Grade 10<br />
18.4<br />
18.5 18.5<br />
298 299 300 299 301 297 298 294<br />
298<br />
300<br />
Student Performance<br />
<strong>State</strong> Indicators <strong>of</strong> Student Success<br />
Old Standard Score<br />
17<br />
16<br />
15<br />
16.8<br />
16.6 16.6 16.5<br />
Grade 9<br />
15.0<br />
14.8<br />
14.7 14.6<br />
17.0<br />
16.9<br />
16.8 16.8<br />
291 290 290 288<br />
290 288 288 287 288<br />
15.4<br />
15.3 15.3<br />
15.2<br />
284 284<br />
282 283 282 282 282 281 282<br />
290<br />
282<br />
New Standard Score<br />
14<br />
Source:<br />
Notes:<br />
13<br />
85 86 87 88 89 90 91 92 93 94 95 96 97 98 99 00<br />
Year<br />
<strong>Iowa</strong> Testing Programs, University <strong>of</strong> <strong>Iowa</strong>.<br />
In 1993 new scale scores were developed for ITED; therefore, both old and new scales are shown so<br />
that a consistent trend line can be provided. Scores provided are based on fall testing.<br />
ITBS and ITED Student Norms<br />
Since 2001-2002, there has been a transition to Forms A and B <strong>of</strong> the ITBS and ITED with 2000<br />
national norms for <strong>Iowa</strong> students from Forms K and L with 1992 national norms. The same<br />
<strong>Iowa</strong> student norms have been used since 2001-2002. According to the <strong>Iowa</strong> Testing<br />
Programs, scores on Forms A and B <strong>of</strong> the ITBS and ITED have been equated so that the same<br />
norms can be used with both.<br />
205
Table 105 shows how 2001-2002 <strong>Iowa</strong> students scored compared to national students in<br />
grades 4, 8, and 11. Table 106 reflects how <strong>Iowa</strong> and national student performance compared<br />
in grades 3-8 averaged and grades 9-11 averaged in terms <strong>of</strong> their Core Total scores. The Core<br />
Total is the average <strong>of</strong> the standard scores for Reading Total, Language Total, and Math<br />
Total. The Core Total excludes social studies, science, and other subject areas. Selected<br />
national percentile rank ranges are listed in the left column. Overall, 2001-2002 <strong>Iowa</strong><br />
students performed better than the nation. There were 68, 62 and 70 percent <strong>Iowa</strong> students<br />
above the national median in grade 4, 8, and 11 respectively (Table 105). The grades 9-11<br />
average was comparable to the grades 3-8 average, with approximately two-thirds <strong>of</strong> <strong>Iowa</strong><br />
students scoring in the top half <strong>of</strong> students nationally and only about a third <strong>of</strong> the <strong>Iowa</strong><br />
students scoring in the lower half nationally in 2001-2002 (Table 106).<br />
Table 105<br />
PERCENT OF 2001-2002 IOWA STUDENTS IN GRADES 4, 8, AND 11<br />
PERFORMING WITHIN SELECTED NATIONAL STUDENT<br />
PERCENTILE RANK RANGES - CORE TOTAL SCORES<br />
National<br />
<strong>Iowa</strong> Percent<br />
Percentile<br />
National<br />
Rank Ranges Percent Grade 4 Grade 8 Grade 11<br />
90-99 10% 19% 16% 21%<br />
75-90 15 21 19 21<br />
50-75 25 28 27 28<br />
25-50 25 21 23 21<br />
10-25 15 8 10 6<br />
1-10 10 3 5 3<br />
% Above National Median 68 62 70<br />
% Below National Median 32 38 30<br />
Source: <strong>Iowa</strong> Testing Programs, University <strong>of</strong> <strong>Iowa</strong>.<br />
Table 106<br />
AVERAGE PERCENT OF 2001-2002 IOWA STUDENTS IN GRADES 3-8 AND<br />
GRADES 9-11 PERFORMING WITHIN SELECTED NATIONAL STUDENT<br />
PERCENTILE RANK RANGES - CORE TOTAL SCORES<br />
National <strong>Iowa</strong> Percent<br />
Percentile National Grades 3-8 Grades 9-11<br />
Rank Ranges Percent Average Average<br />
90-99 10% 17% 18%<br />
75-90 15 20 20<br />
50-75 25 28 28<br />
25-50 25 22 22<br />
10-25 15 9 8<br />
1-10 10 4 4<br />
% Above National Median 65 66<br />
% Below National Median 35 34<br />
206<br />
Source: <strong>Iowa</strong> Testing Programs, University <strong>of</strong> <strong>Iowa</strong>.
Figure 107 compares ITBS Core Total score distributions for <strong>Iowa</strong> students in grade 4 in<br />
1993-1994 and 2001-2002 in terms <strong>of</strong> the percent <strong>of</strong> students performing within selected<br />
national student percentile rank ranges. Similar comparisons are presented in Figures 108<br />
and 109 for <strong>Iowa</strong> students in grades 8 and 11 between 1993-1994 and 2001-2002. The 1993-<br />
1994 <strong>Iowa</strong> data were obtained one year after the 1992 national standardization, while the<br />
2001-2002 <strong>Iowa</strong> data were available one year after the 2000 national standardization.<br />
The purpose <strong>of</strong> the comparison is to show how <strong>Iowa</strong> students performed compared to their<br />
national peers in the two different school years. Since <strong>Iowa</strong> had a higher percent <strong>of</strong> students<br />
scores at the higher percentile rank ranges (50-75, 75-90, and 90-99) and a lower percent <strong>of</strong><br />
student scores at the lower percentile rank ranges (1-10, 10-25, and 25-50) than the nation,<br />
<strong>Iowa</strong> students performed better than the nation in all grades shown and in both years shown.<br />
More specifically, a significant high percent <strong>of</strong> <strong>Iowa</strong> students scored above the 90 th percentile<br />
for the nation (19 percent, 16 percent, and 21 percent for <strong>Iowa</strong> grades 4, 8 and 11 respectively)<br />
while a significant low percent <strong>of</strong> <strong>Iowa</strong> students scored below the 10 th percentile for the nation<br />
(3 percent for <strong>Iowa</strong> grades 4 and 11 and 5 percent for <strong>Iowa</strong> grade 8) in 2001-2002. A similar<br />
picture can be seen for 1993-1994 data (Figures 107 to 109).<br />
In 2001-2002, there was a bigger gap between the <strong>Iowa</strong> percent and the national percent in<br />
each percentile rank range for students in grade 4 than in 1993-1994, <strong>Iowa</strong> 4 th grade students<br />
have improved more compared to the nation (Figure 107). <strong>Iowa</strong> students in grades 8 and 11<br />
improved less relative to their national peers in 2001-2002 compared to 1993-1994 (Figures<br />
108 and 109).<br />
Student Performance<br />
<strong>State</strong> Indicators <strong>of</strong> Student Success<br />
Figure 107<br />
COMPARISON OF THE PERCENT OF IOWA FOURTH GRADE<br />
STUDENTS PERFORMING WITHIN SELECTED NATIONAL STUDENT<br />
PERCENTILE RANK RANGES: CORE TOTAL SCORES<br />
1993-1994 VS. 2001-2002<br />
National Percent<br />
<strong>Iowa</strong>, 1993-1994<br />
Percent<br />
30<br />
25<br />
20<br />
15<br />
10<br />
5<br />
10<br />
4<br />
3<br />
15<br />
10<br />
8<br />
28<br />
25 25<br />
22<br />
21<br />
28<br />
15<br />
20<br />
21<br />
<strong>Iowa</strong>, 2001-2002<br />
19<br />
16<br />
10<br />
0<br />
1-10 10-25 25-50 50-75 75-90 90-99<br />
Percentile Rank Range<br />
Source: <strong>Iowa</strong> Testing Programs, University <strong>of</strong> <strong>Iowa</strong>.<br />
207
Figure 108<br />
COMPARISON OF THE PERCENT OF IOWA EIGHTH GRADE<br />
STUDENTS PERFORMING WITHIN SELECTED NATIONAL STUDENT<br />
PERCENTILE RANK RANGES: CORE TOTAL SCORES<br />
1993-1994 VS. 2001-2002<br />
National Percent<br />
<strong>Iowa</strong>, 1993-1994<br />
Percent<br />
30<br />
25<br />
20<br />
15<br />
10<br />
5<br />
10<br />
4<br />
5<br />
15<br />
8<br />
10<br />
30<br />
27<br />
25 25<br />
23<br />
20<br />
<strong>Iowa</strong>, 2001-2002<br />
20<br />
19<br />
18<br />
15<br />
16<br />
10<br />
0<br />
1-10 10-25 25-50 50-75 75-90 90-99<br />
Percentile Rank Range<br />
Source: <strong>Iowa</strong> Testing Programs, University <strong>of</strong> <strong>Iowa</strong>.<br />
Figure 109<br />
COMPARISON OF THE PERCENT OF IOWA ELEVENTH GRADE<br />
STUDENTS PERFORMING WITHIN SELECTED NATIONAL STUDENT<br />
PERCENTILE RANK RANGES: CORE TOTAL SCORES<br />
1993-1994 VS. 2001-2002<br />
208<br />
Percent<br />
National Percent<br />
<strong>Iowa</strong>, 1993-1994<br />
<strong>Iowa</strong>, 2001-2002<br />
30<br />
25<br />
28 28<br />
25 25<br />
24<br />
21<br />
22 21 21<br />
20<br />
18<br />
15<br />
15<br />
15<br />
10<br />
10<br />
10<br />
6 6<br />
5 2 3<br />
0<br />
1-10 10-25 25-50 50-75 75-90 90-99<br />
Percentile Rank Range<br />
Source: <strong>Iowa</strong> Testing Programs, University <strong>of</strong> <strong>Iowa</strong>.
ITBS and ITED Achievement Level Distributions<br />
Student achievement level distributions are reported as two-year averages for pairs <strong>of</strong><br />
consecutive year. The achievement level distributions in ITBS/ITED Reading Comprehension<br />
and Mathematics are shown in the biennium periods 1993-1995 through 2001-2003 for all<br />
students in grades 4, 8, and 11. Forms K and L <strong>of</strong> both ITBS/ITED were first used in <strong>Iowa</strong><br />
in the 1993-1994 school year. Since 2001-2002, Forms A and B <strong>of</strong> both ITBS/ ITED with<br />
2000 national norms were used in <strong>Iowa</strong> schools instead <strong>of</strong> Forms K and L. The data for 2001-<br />
2002 were adjusted to 1992 norms to compute the 2000-2002 biennium values reported in the<br />
achievement level section. For the 2001-2003 biennium, the achievement level results from<br />
both 1992 and 2000 norms are reported. The terms “Low”, “Intermediate”, and “High” are<br />
used to designate student achievement levels. Descriptions for achievement levels, Low,<br />
Intermediate, and High, are shown at each figure to identify the student performance<br />
characteristics for a given grade and subject area (see the interpretive itatements by the ITP<br />
staff on pages 139-141).<br />
Achievement Levels for Reading Comprehension<br />
The reading comprehension achievement level distribution trends for all students in grades<br />
4, 8, and 11 are reported in Figures 110 through 112 based on 1992 national norms for the<br />
1993-1995 through 2001-2003 biennium periods. An additional point shows the value <strong>of</strong><br />
student performance for each achievement level in the 2001-2003 biennium period based on<br />
the 2000 national norms in Figure 110. There were no additional points for 2001-2003<br />
biennium with 2000 norms in Figures 111 and 112 because there was no norm difference in<br />
reading comprehension for grades 8 and 11.<br />
Student Performance<br />
<strong>State</strong> Indicators <strong>of</strong> Student Success<br />
Figure 110<br />
ITBS READING COMPREHENSION - GRADE 4 PERCENTAGES FOR IOWA<br />
ACHIEVEMENT LEVELS BIENNIUM PERIODS 1993-1995 TO 2001-2003<br />
Percent<br />
100<br />
90<br />
80<br />
70<br />
60<br />
50<br />
40<br />
30<br />
20<br />
10<br />
0<br />
28.4<br />
93-<br />
95<br />
28.8<br />
94-<br />
96<br />
Low<br />
29.4<br />
95-<br />
97<br />
30.2<br />
96-<br />
98<br />
31.4<br />
97-<br />
99<br />
32.4<br />
98-<br />
00<br />
32.2<br />
99-<br />
01<br />
31.0<br />
29.7<br />
00- 01-<br />
02 03<br />
24.2<br />
54.6<br />
93-<br />
95<br />
54.8<br />
94-<br />
96<br />
54.5<br />
95-<br />
97<br />
54.0<br />
Intermediate<br />
96-<br />
98<br />
53.7<br />
97-<br />
99<br />
53.4<br />
98-<br />
00<br />
53.6<br />
99-<br />
01<br />
53.8<br />
51.4<br />
00- 01-<br />
02 03<br />
56.9<br />
16.8<br />
93-<br />
95<br />
16.5<br />
94-<br />
96<br />
16.1<br />
Series1 1992 Norms<br />
Series2 2000 Norms<br />
15.8<br />
95-<br />
97<br />
96-<br />
98<br />
High<br />
14.9<br />
97-<br />
99<br />
14.3<br />
98-<br />
00<br />
14.2<br />
15.2<br />
19.0<br />
99-<br />
01<br />
00- 01-<br />
02 03<br />
19.0<br />
Biennium Period<br />
Source:<br />
Notes:<br />
<strong>Iowa</strong> Testing Programs, University <strong>of</strong> <strong>Iowa</strong>.<br />
The descriptions below indicate how the typical grade 4 student at each achievement level performs<br />
with respect to the ITBS Reading Comprehension test:<br />
HIGH PERFORMANCE LEVEL<br />
Understands factual information; draws conclusions and makes inferences about the motives<br />
and feelings <strong>of</strong> characters; identifies the main idea; evaluates the style and structure <strong>of</strong> the text;<br />
and interprets nonliteral language.<br />
INTERMEDIATE PERFORMANCE LEVEL<br />
Understands some factual information; sometimes can draw conclusions and make inferences<br />
about the motives and feelings <strong>of</strong> characters; and is beginning to be able to identify the main idea,<br />
evaluate the style and structure <strong>of</strong> the text, and interpret nonliteral language.<br />
LOW PERFORMANCE LEVEL<br />
Understands little factual information; seldom draws conclusions or makes simple inferences<br />
about characters; rarely grasps the main idea, evaluates the style and structure <strong>of</strong> the text, or<br />
interprets nonliteral language.<br />
Percentages for each biennium period represent average percentages for the two school years<br />
represented, e.g., 1997-1999 represents the average percent <strong>of</strong> students at each achievement<br />
level for the 1997-1998 and 1998-1999 school year.<br />
Figures may not total 100 percent due to rounding.<br />
209
There was about a four percentage point increase at the High achievement level and a 1.3<br />
percentage point decrease at the Low achievement level in the 2001-2003 biennium for grade<br />
4 reading (see Figure 110).<br />
Figure 111 shows grade 8 reading comprehension data. The grade 8 students performing at<br />
the Low achievement level were about the same and the students performing at the High<br />
achievement level increased about 1 percentage point in the 2001-2003 biennium compared<br />
to the 2000-2002 biennium.<br />
Figure 111<br />
ITBS READING COMPREHENSION - GRADE 8<br />
PERCENTAGES FOR IOWA ACHIEVEMENT LEVELS<br />
BIENNIUM PERIODS 1993-1995 TO 2001-2003<br />
100.0<br />
90.0<br />
80.0<br />
Intermediate<br />
Percent<br />
70.0<br />
60.0<br />
50.0<br />
40.0<br />
30.0<br />
20.0<br />
Low<br />
26.4<br />
26.6<br />
26.8<br />
27.8<br />
28.7<br />
30.2<br />
30.7<br />
30.6<br />
30.7<br />
58.3<br />
58.1<br />
58.0<br />
57.5<br />
56.6<br />
56.1<br />
56.1<br />
55.0<br />
54.0<br />
High<br />
15.2<br />
15.2<br />
15.2<br />
14.6<br />
14.2<br />
13.6<br />
13.2<br />
14.4<br />
15.3<br />
10.0<br />
0.0<br />
93- 94- 95-<br />
95 96 97<br />
96- 97- 98-<br />
98 99 00<br />
99- 00- 01-<br />
01 02 03<br />
93- 94- 95- 96-<br />
95 96 97 98<br />
97- 98- 99-<br />
99 00 01<br />
00- 01-<br />
02 03<br />
93-<br />
95<br />
94- 95- 96-<br />
96 97 98<br />
97- 98- 99- 00- 01-<br />
99 00 01 02 03<br />
Biennium Period<br />
Source:<br />
Notes:<br />
<strong>Iowa</strong> Testing Programs, University <strong>of</strong> <strong>Iowa</strong>.<br />
The descriptions below indicate how the typical grade 8 student at each achievement level performs<br />
with respect to the ITBS Reading Comprehension test:<br />
HIGH PERFORMANCE LEVEL<br />
Understands factual information; draws conclusions and makes inferences about the motives<br />
and feelings <strong>of</strong> characters; makes applications to new situations, identifies the main idea;<br />
evaluates the style and structure <strong>of</strong> the text; and interprets nonliteral language.<br />
INTERMEDIATE PERFORMANCE LEVEL<br />
Understands some factual information; sometimes can draw conclusions and make inferences<br />
about the motives and feelings <strong>of</strong> characters; and apply what has been read to new situations,<br />
and sometimes can identify the main idea, evaluate the style and structure <strong>of</strong> the text, and<br />
interpret nonliteral language.<br />
LOW PERFORMANCE LEVEL<br />
Understands little factual information; can seldom draw conclusions or make simple inferences<br />
about characters; usually cannot apply what has been read to new situations; can rarely grasp<br />
the main idea, evaluate the style and structure <strong>of</strong> the text, and interpret nonliteral language.<br />
Percentages for each biennium period represent average percentages for the two school years<br />
represented, e.g., 1997-1999 represents the average percent <strong>of</strong> students at each achievement<br />
level for the 1997-1998 and 1998-1999 school year.<br />
Figures may not total 100 percent due to rounding.<br />
210
Grade 11 reading comprehension is shown in Figure 112. The percent <strong>of</strong> students in grade 11<br />
performing at the Low achievement level was about the same while the percent <strong>of</strong> students<br />
performing at the High achievement level increased 0.6 percentage points in the 2001-2003<br />
biennium compared to the 2000-2002 biennium.<br />
In general, a higher percentage <strong>of</strong> students performed at the High achievement level for all<br />
grades shown since the 2000-2002 biennium. However, the percentage slightly decreased for<br />
grade 4 students performing at the Low achievement level and remained about the same for<br />
students in grades 8 and 11.<br />
Figure 112<br />
ITED READING COMPREHENSION - GRADE 11<br />
PERCENTAGES FOR IOWA ACHIEVEMENT LEVELS<br />
BIENNIUM PERIODS 1993-1995 TO 2001-2003<br />
Student Performance<br />
<strong>State</strong> Indicators <strong>of</strong> Student Success<br />
100<br />
90<br />
80<br />
70<br />
Intermediate<br />
60<br />
Percent<br />
50<br />
40<br />
30<br />
Low<br />
59.1<br />
58.2<br />
57.8<br />
57.6<br />
57.4<br />
57.0<br />
57.0<br />
58.5<br />
57.8<br />
High<br />
20<br />
10<br />
20.9<br />
21.6<br />
21.7<br />
22.4<br />
23.7<br />
25.0<br />
25.2<br />
22.9<br />
23.0<br />
20.0<br />
20.3<br />
20.6<br />
20.0<br />
19.0<br />
18.1<br />
17.8<br />
18.6<br />
19.2<br />
0<br />
93- 94- 95- 96- 97- 98- 99- 00- 01-<br />
95 96 97 98 99 00 01 02 03<br />
93- 94- 95- 96- 97- 98- 99- 00- 01-<br />
95 96 97 98 99 00 01 02 03<br />
Biennium Period<br />
93-<br />
95<br />
94- 95- 96- 97- 98- 99- 00- 01-<br />
96 97 98 99 00 01 02 03<br />
Source:<br />
Notes:<br />
<strong>Iowa</strong> Testing Programs, University <strong>of</strong> <strong>Iowa</strong>.<br />
The descriptions below indicate how the typical grade 11 student at each achievement level performs<br />
with respect to the ITED test tasks that determine the Reading Comprehension score:<br />
HIGH PERFORMANCE LEVEL<br />
Understands factual information; infers the traits and feelings <strong>of</strong> characters: identifies the main<br />
idea; identifies author viewpoint and style, interprets nonliteral language; and judges the<br />
validity <strong>of</strong> conclusions.<br />
INTERMEDIATE PERFORMANCE LEVEL<br />
Understands some factual information; sometimes can make inferences about characters,<br />
identify the main idea, and identify author viewpoint and style; occasionally can interpret<br />
nonliteral language and judge the validity <strong>of</strong> conclusions.<br />
LOW PERFORMANCE LEVEL<br />
Understands little factual information; seldom makes simple inferences; rarely grasps the main<br />
idea; and usually cannot identify author viewpoint and style, interpret nonliteral language, or<br />
judge the validity <strong>of</strong> conclusions.<br />
Percentages for each biennium period represent average percentages for the two school years<br />
represented, e.g., 1997-1999 represents the average percent <strong>of</strong> students at each achievement<br />
level for the 1997-1998 and 1998-1999 school year.<br />
Figures may not total 100 percent due to rounding.<br />
211
Achievement Levels for Mathematics<br />
Figures 113 through 115 show mathematics achievement level distributions for students in<br />
grades 4, 8, and 11 for biennium periods 1993-1995 through 2001-2003 with 1992 national<br />
norms. An additional point shows the value <strong>of</strong> student performance in grades 8 and 11 for<br />
each achievement level in the 2001-2003 biennium period based on the 2000 national norms<br />
(Figures 114 and 115). There was no extra point for grade 4 distributions because there was<br />
no difference due to the norms in mathematics for that grade (Figure 113) .<br />
In the 2001-2003 biennium period, 2.7 percent fewer students in grade 4 were classified at<br />
the Low achievement level while 2.7 percent more students were classified at the High<br />
achievement level compared to the 2000-2002 biennium.<br />
Figure 113<br />
ITBS MATHEMATICS - GRADE 4<br />
PERCENTAGES FOR IOWA ACHIEVEMENT LEVELS<br />
BIENNIUM PERIODS 1993-1995 TO 2001-2003<br />
100<br />
90<br />
80<br />
Intermediate<br />
70<br />
60<br />
57.6<br />
57.4<br />
57.0<br />
56.7<br />
56.1<br />
55.6<br />
55.8<br />
56.4<br />
56.3<br />
Percent<br />
50<br />
40<br />
30<br />
20<br />
25.4<br />
25.5<br />
26.4<br />
Low<br />
27.1<br />
28.5<br />
29.0<br />
28.4<br />
27.7<br />
25.0<br />
17.0<br />
17.1<br />
16.6<br />
High<br />
16.2<br />
15.4<br />
15.4<br />
15.6<br />
16.0<br />
18.7<br />
10<br />
0<br />
93-<br />
95<br />
94- 95- 96- 97- 98- 99- 00- 01-<br />
96 97 98 99 00 01 02 03<br />
93-<br />
95<br />
94- 95- 96- 97- 98- 99- 00- 01-<br />
96 97 98 99 00 01 02 03<br />
93- 94- 95- 96- 97- 98- 99- 00- 01-<br />
95 96 97 98 99 00 01 02 03<br />
Biennium Period<br />
Source:<br />
Notes:<br />
<strong>Iowa</strong> Testing Programs, University <strong>of</strong> <strong>Iowa</strong>.<br />
The descriptions below indicate how the typical grade 4 student at each achievement level performs<br />
with respect to the ITBS test tasks that determine the Mathematics Total score:<br />
HIGH PERFORMANCE LEVEL<br />
Understands math concepts, solves complex word problems, uses various estimation methods, and<br />
is learning to interpret data from graphs and tables.<br />
INTERMEDIATE PERFORMANCE LEVEL<br />
Is developing and understanding <strong>of</strong> most math concepts, is developing the ability to solve simple and<br />
complex word problems and to use estimation methods, and is beginning to develop the ability to<br />
interpret data from graphics and tables.<br />
LOW PERFORMANCE LEVEL<br />
Is beginning to develop an understanding <strong>of</strong> many math concepts and an ability to solve simple word<br />
problems, is generally unable to use estimation methods, and is seldom able to interpret data from<br />
graphs and tables.<br />
Percentages for each biennium period represent average percentages for the two school years<br />
represented, e.g., 1997-1999 represents the average percent <strong>of</strong> students at each achievement<br />
level for the 1997-1998 and 1998-1999 school year.<br />
Figures may not total 100 percent due to rounding.<br />
212
Figures 114 and 115 show similar pictures for grades 8 and 11 mathematics achievement<br />
level distributions. With the 1992 national norms, a higher percentage <strong>of</strong> students performed<br />
at the High achievement level and a lower percentage <strong>of</strong> students performed at the Low<br />
achievement level for grades 8 and 11 during the 2001-2003 biennium.<br />
Figure 114<br />
ITBS MATHEMATICS - GRADE 8<br />
PERCENTAGES FOR IOWA ACHIEVEMENT LEVELS<br />
BIENNIUM PERIODS 1993-1995 TO 2001-2003<br />
Student Performance<br />
<strong>State</strong> Indicators <strong>of</strong> Student Success<br />
100<br />
90<br />
80<br />
Intermediate<br />
1992 Norms<br />
2000 Norms<br />
Percent<br />
70<br />
60<br />
50<br />
40<br />
Low<br />
59.1<br />
59.1<br />
58.8<br />
58.3<br />
57.4<br />
56.9<br />
56.8<br />
56.5<br />
56.8<br />
54.8<br />
High<br />
30<br />
20<br />
23.4<br />
22.7<br />
22.6<br />
23.6<br />
25.0<br />
25.9<br />
26.4<br />
26.9<br />
26.5<br />
28.5<br />
17.5<br />
18.2<br />
18.6<br />
18.2<br />
17.8<br />
17.2<br />
16.8<br />
16.6<br />
16.8<br />
16.8<br />
10<br />
0<br />
93-<br />
95<br />
94-<br />
96<br />
95-<br />
97<br />
96-<br />
98<br />
97-<br />
99<br />
98-<br />
00<br />
99-<br />
01<br />
00-<br />
02<br />
01-<br />
03<br />
93-<br />
95<br />
94-<br />
96<br />
95-<br />
97<br />
96-<br />
98<br />
97-<br />
99<br />
98-<br />
00<br />
Biennium Period<br />
99-<br />
01<br />
00-<br />
02<br />
01-<br />
03<br />
93-<br />
95<br />
94-<br />
96<br />
95-<br />
97<br />
96-<br />
98<br />
97-<br />
99<br />
98-<br />
00<br />
99-<br />
01<br />
00-<br />
02<br />
01-<br />
03<br />
Source:<br />
Notes:<br />
<strong>Iowa</strong> Testing Programs, University <strong>of</strong> <strong>Iowa</strong>.<br />
The descriptions below indicate how the typical grade 8 student at each achievement level performs<br />
with respect to the ITBS test tasks that determine the Mathematics Total score.<br />
HIGH PERFORMANCE LEVEL<br />
Understands math concepts and is developing the ability to solve complex word problems, use a<br />
variety <strong>of</strong> estimation methods and interpret data from graphs and tables.<br />
INTERMEDIATE PERFORMANCE LEVEL<br />
Is beginning to develop an understanding <strong>of</strong> most math concepts and to develop the ability the ability<br />
to solve word problems, use a variety <strong>of</strong> estimation methods, and interpret data from graphs and<br />
tables.<br />
LOW PERFORMANCE LEVEL<br />
Understands little about math concepts, is unable to solve most simple word problems or use<br />
estimation methods, and seldom able to interpret data from graphs and tables.<br />
Percentages for each biennium period represent average percentages for the two school years<br />
represented, e.g., 1997-1999 represents the average percent <strong>of</strong> students at each achievement<br />
level for the 1997-1998 and 1998-1999 school year.<br />
Figures may not total 100 percent due to rounding.<br />
213
Figure 115<br />
ITED MATHEMATICS - GRADE 11<br />
PERCENTAGES FOR IOWA ACHIEVEMENT LEVELS<br />
BIENNIUM PERIODS 1993-1995 TO 2001-2003<br />
100<br />
Percent<br />
90<br />
80<br />
70<br />
60<br />
50<br />
40<br />
30<br />
20<br />
17.7<br />
17.2<br />
17.2<br />
Low<br />
17.8<br />
18.6<br />
19.9<br />
20.4<br />
18.6<br />
20.8<br />
55.9<br />
55.1<br />
Intermediate<br />
54.6<br />
54.1<br />
54.0<br />
53.7<br />
53.4<br />
54.4<br />
52.1<br />
56.2<br />
26.4<br />
27.6<br />
28.2<br />
28.2<br />
1992 Norms<br />
2000 Norms<br />
High<br />
27.4<br />
26.4<br />
26.2<br />
26.9<br />
30.4<br />
23.0<br />
10<br />
17.5<br />
0<br />
93-<br />
95<br />
94- 95- 96- 97- 98- 99- 00- 01-<br />
96 97 98 99 00 01 02 03<br />
93-<br />
95<br />
94- 95- 96- 97- 98- 99- 00- 01-<br />
96 97 98 99 00 01 02 03<br />
93- 94- 95- 96- 97- 98- 99- 00- 01-<br />
95 96 97 98 99 00 01 02 03<br />
Biennium Report<br />
Source:<br />
Notes:<br />
<strong>Iowa</strong> Testing Programs, University <strong>of</strong> <strong>Iowa</strong>.<br />
The descriptions below indicate how the typical grade 11 student at each level performs with<br />
respect to concepts and problems in the ITED Mathematics test:<br />
HIGH PERFORMANCE LEVEL<br />
Understands how to apply math concepts and procedures, makes inferences with quantitative<br />
information, and solves a variety <strong>of</strong> novel quantitative reasoning problems.<br />
INTERMEDIATE PERFORMANCE LEVEL<br />
Is beginning to develop the ability to apply a variety <strong>of</strong> math concepts and procedures, make<br />
inferences about quantitative information, and solve a variety <strong>of</strong> novel quantitative reasoning<br />
problems.<br />
LOW PERFORMANCE LEVEL<br />
Demonstrates little understanding about how to apply math concepts and procedures, generally<br />
cannot make inferences with quantitative information, and cannot solve most novel quantitative<br />
reasoning problems.<br />
Percentages for each biennium period represent average percentages for the two school years<br />
represented, e.g., 1997-1999 represents the average percent <strong>of</strong> students at each achievement<br />
level for the 1997-1998 and 1998-1999 school year.<br />
Figures may not total 100 percent due to rounding.<br />
214
Achievement Levels for Science<br />
Figure 116 shows ITBS science achievement level distributions for students in grade 8 and<br />
Figure 117 shows ITED science achievement level distributions for students in grade 11. This<br />
is the first time The Annual Condition <strong>of</strong> Education Report has reported science data. Data<br />
displayed is for the biennium period 2001-2003 with 2000 national norms. These values<br />
represent baseline information for gauging improvement in future years.<br />
A total <strong>of</strong> 16.4 percent <strong>of</strong> <strong>Iowa</strong> 8 th graders performed at the High achievement level and 22.8<br />
percent were at the Low achievement level in the 2001-2003 biennium period. There was a<br />
higher percent <strong>of</strong> <strong>Iowa</strong> students in grade 11 at the High achievement level (23.8 percent) than<br />
at the Low achievement level (21.2 percent).<br />
Figure 116<br />
ITBS SCIENCE - GRADE 8<br />
PERCENTAGES FOR IOWA ACHIEVEMENT LEVELS<br />
BIENNIUM PERIOD 2001-2003 (2000 NORMS)<br />
Student Performance<br />
<strong>State</strong> Indicators <strong>of</strong> Student Success<br />
Percent<br />
100<br />
80<br />
60<br />
40<br />
20<br />
0<br />
60.9<br />
22.8<br />
16.4<br />
Low Intermediate High<br />
Achievement Level<br />
Source:<br />
Notes:<br />
<strong>Iowa</strong> Testing Programs, University <strong>of</strong> <strong>Iowa</strong>.<br />
The descriptions below indicate how the typical grade 8 student at each achievement level<br />
performs with respect to the ITBS Science test:<br />
HIGH PERFORMANCE LEVEL<br />
Usually understands ideas related to Earth and the universe and to the life sciences. Understands<br />
ideas related to the physical sciences and is able to demonstrate the skills <strong>of</strong> scientific<br />
inquiry.<br />
INTERMEDIATE PERFORMANCE LEVEL<br />
Sometimes understands ideas related to Earth and the universe, the life sciences, and the<br />
physical sciences. Often can demonstrate the skills <strong>of</strong> scientific inquiry.<br />
LOW PERFORMANCE LEVEL<br />
Sometimes understands ideas related to Earth and the universe but seldom understands ideas<br />
about the life sciences or the physical sciences. Rarely demonstrates the skills <strong>of</strong> scientific<br />
inquiry.<br />
215
Figure 117<br />
ITED SCIENCE - GRADE 11<br />
PERCENTAGES FOR IOWA ACHIEVEMENT LEVELS<br />
BIENNIUM PERIOD 2001-2003 (2000 NORMS)<br />
100<br />
Percent<br />
80<br />
60<br />
40<br />
20<br />
0<br />
54.9<br />
21.2<br />
23.8<br />
Low Intermediate High<br />
Achievement Level<br />
Source:<br />
Notes:<br />
<strong>Iowa</strong> Testing Programs, University <strong>of</strong> <strong>Iowa</strong>.<br />
The descriptions below indicate how the typical grade 11 student at each achievement level<br />
perform with respect to the ITED Science test:<br />
HIGH PERFORMANCE LEVEL<br />
Makes inferences and predictions from data, recognizes the rationale for and limitations <strong>of</strong><br />
scientific procedures, and usually judges the relevance and adequacy <strong>of</strong> information.<br />
INTERMEDIATE PERFORMANCE LEVEL<br />
Sometimes makes inferences or predictions from data, judges the relevance and adequacy <strong>of</strong><br />
information, and recognizes the rationale for and limitations <strong>of</strong> scientific procedures.<br />
LOW PERFORMANCE LEVEL<br />
Rarely makes inferences or predictions from data, judges the relevance and adequacy <strong>of</strong><br />
information, or recognizes the rationale for and limitations <strong>of</strong> scientific procedures.<br />
<strong>State</strong> ITBS and ITED Participation Rates for Public and Nonpublic Students<br />
The estimated participation rates on ITBS and ITED reading and mathematics are shown in<br />
Table 107 for <strong>Iowa</strong> public and nonpublic school students in grades 4, 8, and 11 for the<br />
biennium periods 1997-1999 through 2001-2003. Also shown in Table 105 are the estimated<br />
participation rates for <strong>Iowa</strong> grades 8 and 11 students on ITBS and ITED science for the<br />
biennium period 2001-2003. The enrollments are averages from two years <strong>of</strong> Fall BEDS<br />
(Basic Educational Data Survey) reports, and the numbers tested are also averages from a<br />
given biennium period. This is the first time the Department has reported science data. The<br />
estimated participation rates for reading and mathematics have increased for all grades<br />
shown. Both grade 8 and grade 11 had greatest participation increases in both reading and<br />
mathematics from the 1997-1999 biennium to 2001-2003 biennium.<br />
216
Table 107<br />
IOWA STUDENT STATE PARTICIPATION RATES IN ITBS AND ITED<br />
READING COMPREHENSION AND MATHEMATICS<br />
GRADES 4, 8 AND 11, 1997-1999 TO 2001-2003;<br />
AND SCIENCE GRADES 8 AND 11, 2001-2003<br />
Reading Comprehension Mathematics Science<br />
Biennium Period Grade 4 Grade 8 Grade 11 Grade 4 Grade 8 Grade 11 Grade 8 Grade 11<br />
1997-1999<br />
Average Annual Enrollment 39,293 41,088 40,268 39,293 41,088 40,268 x x<br />
Approximate Average # Tested 37,000 36,000 29,000 37,000 36,000 29,000 x x<br />
Estimated Percent Tested 94.2% 87.6% 72.0% 94.2% 87.6% 72.0% x x<br />
1998-2000<br />
Average Annual Enrollment 40,182 41,267 40,407 40,182 41,267 40,407 x x<br />
Approximate Average # Tested 38,700 38,800 31,100 38,400 38,600 31,700 x x<br />
Estimated Percent Tested 96.3% 94.0% 77.0% 95.6% 93.5% 78.5% x x<br />
Student Performance<br />
<strong>State</strong> Indicators <strong>of</strong> Student Success<br />
1999-2001<br />
Average Annual Enrollment 40,415 40,198 39,964 40,415 40,198 39,964 x x<br />
Approximate Average # Tested 39,200 38,700 32,300 40,195 38,300 33,300 x x<br />
Estimated Percent Tested 97.0% 96.3% 80.8% 99.5% 95.3% 83.3% x x<br />
2000-2002<br />
Average Annual Enrollment 39,952 39,640 40,188 39,952 39,640 40,188 x x<br />
Approximate Average # Tested 40,000 39,200 34,680 40,095 38,634 35,100 x x<br />
Estimated Percent Tested 100.0% 98.9% 86.3% 100.0% 97.5% 87.3% x x<br />
2001-2003<br />
Average Annual Enrollment 39,003 40,053 40,357 39,003 40,053 40,357 40,053 40,357<br />
Approximate Average # Tested 39,440 40,510 36,830 39,390 40,110 36,760 39,680 36,540<br />
Estimated Percent Tested 100.0% 100.0% 91.3% 100.0% 100.0% 91.1% 99.1% 90.5%<br />
Source: <strong>Iowa</strong> Testing Programs, University <strong>of</strong> <strong>Iowa</strong> and <strong>Iowa</strong> Department <strong>of</strong> Education, Bureau <strong>of</strong> Planning,<br />
Research, and Evaluation, Basic Educational Data Survey, Enrollment Files.<br />
Note: The number tested and enrollment included both public and nonpublic students.<br />
American College Testing (ACT) Assessment<br />
American College Testing designed the ACT Assessment to measure high school students’<br />
general educational development and ability to succeed at the college level. A composite<br />
ACT score measures overall educational development and is based on assessments for<br />
English, mathematics, reading, and science reasoning. The ACT scores range from a low <strong>of</strong><br />
1 to a high <strong>of</strong> 36 and data is reported for various subgroups <strong>of</strong> students. Subgroups reported<br />
in this report include high school program type and gender. High school program types are<br />
classified as “core” and “less than core”. ACT defines “core” as high school programs<br />
consisting <strong>of</strong> four years <strong>of</strong> English, and three or more years <strong>of</strong> mathematics, natural science,<br />
and social studies. Students not meeting the “core” program standard are considered “less<br />
than core” completers.<br />
217
The percentage <strong>of</strong> <strong>Iowa</strong> graduates that took the ACT Assessment for the years 1985 through<br />
2003 is shown in Figure 118. The percentage remained unchanged for between 2002 and<br />
2003 at 66.0 percent. The percentage <strong>of</strong> <strong>Iowa</strong> graduates that took the ACT Assessment has<br />
remained at or above 66.0 percent since 1999.<br />
Figure 118<br />
Percent<br />
100<br />
90<br />
80<br />
70<br />
60<br />
50<br />
40<br />
30<br />
20<br />
10<br />
Source:<br />
0<br />
PERCENT OF IOWA GRADUATES TAKING THE ACT ASSESSMENT<br />
1985 - 2003<br />
57.8<br />
1985<br />
1986<br />
57.9<br />
59.2<br />
60.3<br />
60.5<br />
61.2<br />
61.0<br />
62.0<br />
61.5<br />
62.0<br />
1987<br />
1988<br />
1989<br />
1990<br />
1991<br />
1992<br />
1993<br />
1994<br />
1995<br />
Graduating Class<br />
64.0<br />
64.0<br />
64.0<br />
65.0<br />
66.0<br />
69.0<br />
American College Testing Program, The High School Pr<strong>of</strong>ile Report for <strong>Iowa</strong>.<br />
67.0<br />
66.0<br />
66.0<br />
1996<br />
1997<br />
1998<br />
1999<br />
2000<br />
2001<br />
2002<br />
2003<br />
ACT Composite Score Comparisons <strong>of</strong> <strong>Iowa</strong>, Midwest <strong>State</strong>s,<br />
and the Nation<br />
<strong>Iowa</strong> ACT average composite score remained at 22.0 for the fifth consecutive year.<br />
Wisconsin lead the nation (22.2) and <strong>Iowa</strong> was tied with Minnesota for second among the<br />
states where the ACT Assessment test has been taken by more than 50 percent <strong>of</strong> high school<br />
graduates. <strong>Iowa</strong> has ranked third or above in the nation for all years shown (Table 108).<br />
Table 108<br />
IOWA’S RANK IN THE NATION ON AVERAGE COMPOSITE<br />
ACT SCORES AMONG STATES WHERE ACT<br />
IS THE PRIMARY COLLEGE ENTRANCE EXAMINATION, 1989-2003<br />
ACT Average<br />
Graduating Class Composite Score Rank<br />
1989 21.8 2<br />
1990 21.8 1 tied with WI<br />
1991 21.7 1 tied with WI<br />
1992 21.6 1 tied with WI<br />
1993 21.8 1 tied with WI<br />
1994 21.9 1<br />
1995 21.8 3<br />
1996 21.9 3<br />
1997 22.1 2 tied with MN<br />
1998 22.1 3<br />
1999 22.0 3<br />
2000 22.0 2 tied with MN<br />
2001 22.0 3<br />
2002 22.0 3<br />
2003 22.0 2 tied with MN<br />
218<br />
Source:<br />
American College Testing Program, ACT assessment results, Summary Report for <strong>Iowa</strong>.
Average ACT composite scores for <strong>Iowa</strong>, Midwest states, and the nation for graduating<br />
classes 2001 through 2003 are displayed in Table 109. In 2003, all Midwest states with the<br />
exception <strong>of</strong> Illinois had average composite scores above the national average. <strong>Iowa</strong> and<br />
Minnesota ranked second in the nation, while Wisconsin ranked first. Comparisons <strong>of</strong> ACT<br />
composite scores between states are valid only for the 25 states where the ACT is the<br />
predominant test, defined as those states where at least 50 percent <strong>of</strong> graduates take the ACT<br />
exam. <strong>State</strong>s with fewer than 50 percent taking the ACT exam may have a sample <strong>of</strong> students<br />
not representative <strong>of</strong> that state’s overall student population.<br />
Table 109<br />
ACT AVERAGE COMPOSITE SCORES FOR IOWA, THE NATION<br />
AND MIDWEST STATES — 2001 TO 2003<br />
Class <strong>of</strong> 2001 Class <strong>of</strong> 2002 Class <strong>of</strong> 2003<br />
% <strong>of</strong> % <strong>of</strong> % <strong>of</strong><br />
Nation ACT Graduates % <strong>of</strong> Core ACT Graduates % <strong>of</strong> Core ACT Graduates % <strong>of</strong> Core<br />
& <strong>State</strong> Composite Tested Completers Composite Tested Completers Composite Tested Completers<br />
Student Performance<br />
<strong>State</strong> Indicators <strong>of</strong> Student Success<br />
Nation 21.0 38% 60% 20.8 39% 58% 20.8 40% 57%<br />
<strong>Iowa</strong> 22.0 67 66 22.0 66 66 22.0 66 66<br />
Illinois 21.6 71 53 20.1 99 42 20.2 100 41<br />
Kansas 21.6 78 66 21.6 76 66 21.5 76 66<br />
Minnesota 22.1 66 67 22.1 65 66 22.0 67 64<br />
Missouri 21.4 70 59 21.5 68 58 21.4 69 58<br />
Nebraska 21.6 74 67 21.7 72 66 21.7 73 67<br />
North Dakota 21.4 80 63 21.2 78 61 21.3 80 59<br />
South Dakota 21.4 70 62 21.4 71 61 21.4 70 60<br />
Wisconsin 22.2 68 62 22.2 68 60 22.2 69 61<br />
Source:<br />
Note:<br />
American College Testing Program, ACT Assessment Results.<br />
ACT classifies high school programs consisting <strong>of</strong> four years <strong>of</strong> English and three or more<br />
years each <strong>of</strong> mathematics, natural science, and social studies as “core” programs.<br />
<strong>Iowa</strong> average ACT composite scores (22.0) remained above the nation’s average ACT<br />
Composite scores (20.8) in 2003, continuing the trend for all years shown. For all years<br />
shown, <strong>Iowa</strong>’s composite score has been at or above 1.0 points higher than the nation’s<br />
average composite score (Table 110 and Figure 119). The percentage <strong>of</strong> <strong>Iowa</strong>’s 2003<br />
graduating class that took the ACT remained at 66.0 percent, unchanged from 2002.<br />
Nationally, the percentage <strong>of</strong> graduating students that took the ACT increased for the second<br />
consecutive year in 2003, moving from 39.0 percent in 2002 to 40.0 percent in 2003.<br />
Table 110<br />
IOWA AND NATIONAL ACT AVERAGE COMPOSITE SCORES<br />
AND PARTICIPATION RATES, 1991 TO 2003<br />
Average ACT Composite Percent <strong>Iowa</strong> Average ACT Composite Percent Nation<br />
Class <strong>of</strong> Score - <strong>Iowa</strong> Student Participation* Score - Nation Student Participation<br />
1991 21.7 61.0 %<br />
20.6 —%%<br />
1992 21.6 62.0 20.6 —%<br />
1993 21.8 61.5** 20.7 —%<br />
1994 21.9 62.0 20.8 —%<br />
1995 21.8 64.0 20.8 37.0<br />
1996 21.9 64.0 20.9 35.0<br />
1997 22.1 64.0 21.0 35.0<br />
1998 22.1 65.0 21.0 35.0<br />
1999 22.0 66.0 21.0 36.0<br />
2000 22.0 69.0 21.0 38.0<br />
2001 22.0 67.0 21.0 38.0<br />
2002 22.0 66.0 20.8 39.0<br />
2003 22.0 66.0 20.8 40.0<br />
Source:<br />
Notes:<br />
American College Testing Program, ACT Assessment Results, Summary Report <strong>Iowa</strong>.<br />
*From 1991-1992, and 1994-2003 ACT News Releases.<br />
**1993 estimated percentage is based on <strong>Iowa</strong> Department <strong>of</strong> Education, Basic Educational<br />
Data Survey, Enrollment Files.<br />
219
Figure 119<br />
ores<br />
36<br />
31<br />
IOWA AND NATIONAL ACT AVERAGE COMPOSITE SCORES<br />
1991-2003<br />
<strong>Iowa</strong><br />
Nation<br />
ACT Score<br />
26<br />
21<br />
16<br />
21.7 21.6 21.8 21.9 21.8 21.9 22.1 22.1 22.0 22.0 22.0 22.0 22.0<br />
20.6 20.6 20.7 20.8 20.8 20.9 21.0 21.0 21.0 21.0 21.0 20.8 20.8<br />
11<br />
6<br />
1<br />
1991 1992 1993 1994 1995 1996 1997 1998 1999 2000 2001 2002 2003<br />
Graduating Class<br />
Source:<br />
American College Testing Program, The High School Pr<strong>of</strong>ile Report for <strong>Iowa</strong>.<br />
ACT Score Comparisons for English, Mathematics, Reading, and<br />
Science Reasoning<br />
The thirteen year trend <strong>of</strong> <strong>Iowa</strong> and the Nation’s ACT assessment scores in the four skill areas<br />
(English, mathematics, reading, and science reasoning) are displayed in Table 111 and<br />
Figures 120 through 123. <strong>Iowa</strong>’s average English scores increased a tenth <strong>of</strong> a point while<br />
<strong>Iowa</strong> average mathematics scores decreased a tenth <strong>of</strong> a point in 2003. Nationally, average<br />
English and reading scores increased a tenth <strong>of</strong> a point while average scores for mathematics<br />
and science reasoning remained unchanged between 2002 and 2003.<br />
Table 111<br />
AVERAGE ACT SCORES FOR IOWA AND THE NATION<br />
GRADUATING CLASSES 1991 - 2003<br />
<strong>Iowa</strong><br />
Nation<br />
Class Science Science<br />
<strong>of</strong> English Mathematics Reading Reasoning English Mathematics Reading Reasoning<br />
1991 21.3 21.0 22.2 21.9 20.3 20.0 21.2 20.7<br />
1992 21.2 21.0 21.9 21.9 20.2 20.0 21.1 20.7<br />
1993 21.3 21.1 22.2 22.0 20.3 20.1 21.2 20.8<br />
1994 21.4 21.2 22.2 22.3 20.3 20.2 21.2 20.9<br />
1995 21.3 21.2 22.1 22.1 20.2 20.2 21.3 21.0<br />
1996 21.4 21.3 22.2 22.3 20.3 20.2 21.3 21.1<br />
1997 21.4 21.5 22.4 22.4 20.3 20.6 21.3 21.1<br />
1998 21.5 21.9 22.3 22.4 20.4 20.8 21.4 21.1<br />
1999 21.5 21.6 22.2 22.1 20.5 20.7 21.4 21.0<br />
2000 21.3 21.6 22.3 22.1 20.5 20.7 21.4 21.0<br />
2001 21.3 21.6 22.3 22.2 20.5 20.7 21.3 21.0<br />
2002 21.2 21.7 22.4 22.1 20.2 20.6 21.1 20.8<br />
2003 21.3 21.6 22.4 22.1 20.3 20.6 21.2 20.8<br />
Source:<br />
American College Testing Program, The High School Pr<strong>of</strong>ile Report for <strong>Iowa</strong><br />
220
Figure 120<br />
ACT Score<br />
36<br />
31<br />
26<br />
21<br />
16<br />
11<br />
6<br />
AVERAGE ACT ENGLISH SCORES<br />
IOWA VS. NATION — 1991-2003<br />
21.3 21.2 21.3 21.4 21.3 21.4 21.4 21.5 21.5 21.3 21.3 21.2 21.3<br />
20.3 20.2 20.3 20.3 20.2 20.3 20.3 20.4 20.5 20.5 20.5 20.2 20.3<br />
<strong>Iowa</strong><br />
Nation<br />
Student Performance<br />
<strong>State</strong> Indicators <strong>of</strong> Student Success<br />
1<br />
1991 1992 1993 1994 1995 1996 1997 1998 1999 2000 2001 2002 2003<br />
Graduating Class<br />
Source:<br />
American College Testing Program, The High School Pr<strong>of</strong>ile Report for <strong>Iowa</strong>.<br />
Figure 121<br />
AVERAGE ACT MATHEMATICS SCORES<br />
IOWA VS. NATION — 1991-2003<br />
36<br />
31<br />
ACT Score<br />
26<br />
21<br />
16<br />
21.0 21.0 21.1 21.2 21.2 21.3 21.5 21.9 21.6 21.6 21.6 21.7 21.6<br />
20.0 20.0 20.1 20.2 20.2 20.2 20.6 20.8 20.7 20.7 20.7 20.6 20.6<br />
11<br />
6<br />
1<br />
<strong>Iowa</strong><br />
Nation<br />
1991 1992 1993 1994 1995 1996 1997 1998 1999 2000 2001 2002 2003<br />
Graduating Class<br />
Source:<br />
American College Testing Program, The High School Pr<strong>of</strong>ile Report for <strong>Iowa</strong>.<br />
221
Figure 122<br />
AVERAGE ACT READING SCORES<br />
IOWA VS. NATION — 1991-2003<br />
36<br />
31<br />
ACT Score<br />
26<br />
21<br />
16<br />
22.2 21.9 22.2 22.2 22.1 22.2 22.4 22.3 22.2 22.3 22.3 22.4 22.4<br />
21.2 21.1 21.2 21.2 21.3 21.3 21.3 21.4 21.4 21.4 21.3 21.1 21.2<br />
11<br />
6<br />
1<br />
<strong>Iowa</strong><br />
Nation<br />
1991 1992 1993 1994 1995 1996 1997 1998 1999 2000 2001 2002 2003<br />
Graduating Class<br />
Source:<br />
American College Testing Program, The High School Pr<strong>of</strong>ile Report for <strong>Iowa</strong>.<br />
Figure 123<br />
AVERAGE ACT SCIENCE REASONING SCORES<br />
IOWA VS. NATION — 1991-2003<br />
36<br />
31<br />
ACT Score<br />
26<br />
21<br />
16<br />
21.9 21.9 22.0 22.3 22.1 22.3 22.4 22.4 22.1 22.1 22.2 22.1 22.1<br />
20.7 20.7 20.8 20.9 21.0 21.1 21.1 21.1 21.0 21.0 21.0 20.8 20.8<br />
11<br />
6<br />
1<br />
<strong>Iowa</strong><br />
Nation<br />
1991 1992 1993 1994 1995 1996 1997 1998 1999 2000 2001 2002 2003<br />
Graduating Class<br />
Source:<br />
American College Testing Program, The High School Pr<strong>of</strong>ile Report for <strong>Iowa</strong>.<br />
222
ACT Scores for Core and Less than Core Students<br />
ACT defines the college-preparatory core curriculum as at least four years <strong>of</strong> English and<br />
at least three years each <strong>of</strong> mathematics, natural sciences, and social studies. Core<br />
mathematics and natural science courses are beyond the introductory level. For example, a<br />
typical minimal core mathematics course might include Algebra I, Algebra II, and Geometry<br />
one year each. A typical minimal core natural science course might include one year each<br />
<strong>of</strong> General Science, Biology, and Chemistry or Physics. Table 112 shows the ACT standards<br />
for core high school programs.<br />
Table 112<br />
ACT STANDARDS FOR CORE HIGH SCHOOL PROGRAMS<br />
Core Area Years Course Credit<br />
English 4 or more English 9, 10, 11, 12 1 year each<br />
Student Performance<br />
<strong>State</strong> Indicators <strong>of</strong> Student Success<br />
Mathematics 3 or more Algebra I & II, Geometry 1 year each<br />
Trigonometry & calculus (not precalculus),<br />
Other math courses beyond Algebra II,<br />
Computer math/computer science<br />
1/2 year each<br />
Social Studies 3 or more American history, world history, 1 year each<br />
American government<br />
Economics, geography,<br />
psychology, other history<br />
1/2 year each<br />
Natural Science 3 or more General/physical/earth science, biology, 1 year each<br />
chemistry, physics<br />
Source:<br />
American College Testing Program, ACT Assessment 2003 Results.<br />
The percent <strong>of</strong> ACT participants that took the core high school program in <strong>Iowa</strong> and the nation<br />
is detailed in Table 113 and Figure 124. <strong>Iowa</strong> ACT tested graduates completing a core<br />
program remained at 66.0 percent for the fifth consecutive year in 2003. For the nation, that<br />
percentage decreased to 57.0 percent and continued the downward trend that began in 2001.<br />
Table 113<br />
PERCENT OF ACT PARTICIPANTS TAKING CORE HIGH SCHOOL PROGRAM<br />
1991-2003<br />
Graduating Class <strong>Iowa</strong> Nation<br />
1991<br />
1992<br />
58.0 %<br />
59.4<br />
48.6 %<br />
50.4<br />
1993 61.6 51.7<br />
1994 62.2 53.7<br />
1995 63.1 56.0<br />
1996 65.8 59.0<br />
1997 66.0 59.0<br />
1998 68.0 61.0<br />
1999 66.0 60.0<br />
2000 66.0 61.0<br />
2001 66.0 60.0<br />
2002 66.0 58.0<br />
2003 66.0 57.0<br />
Source:<br />
Note:<br />
American College Testing Program, The High School Pr<strong>of</strong>ile Report for <strong>Iowa</strong>.<br />
ACT classifies high school programs consisting <strong>of</strong> four years <strong>of</strong> English and three or more years<br />
each <strong>of</strong> mathematics, natural science, and social studies as “core” programs.<br />
223
Figure 124<br />
PERCENT OF ACT PARTICIPANTS TAKING CORE HIGH SCHOOL PROGRAM<br />
1991-2003<br />
100<br />
90<br />
Percent<br />
80<br />
70<br />
60<br />
50<br />
40<br />
58.0 59.4<br />
61.6 62.2 63.1<br />
48.6 50.4 51.7<br />
53.7<br />
56.0<br />
65.8 66.0<br />
59.0 59.0<br />
68.0<br />
66.0 66.0 66.0 66.0 66.0<br />
61.0 60.0 61.0 60.0 58.0 57.0<br />
30<br />
20<br />
10<br />
0<br />
<strong>Iowa</strong><br />
Nation<br />
1991 1992 1993 1994 1995 1996 1997 1998 1999 2000 2001 2002 2003<br />
Graduating Class<br />
Source:<br />
Note:<br />
American College Testing Program, The High School Pr<strong>of</strong>ile Report for <strong>Iowa</strong>.<br />
ACT classifies high school programs consisting <strong>of</strong> four years <strong>of</strong> English and three or more years<br />
each <strong>of</strong> mathematics, natural science, and social studies as “core” programs.<br />
Table 114 and Figure 125 show ACT average composite scores for core and less than core<br />
groups for <strong>Iowa</strong> and the nation. <strong>Iowa</strong> composite scores for the core group were 2.9 points<br />
higher than the less than core group in 2003. Overall in <strong>Iowa</strong>, the core group has scored<br />
approximately three points higher than the less than core group for all years shown, matching<br />
the national trend. Both <strong>Iowa</strong> groups have outscored their national counterparts for each year<br />
shown.<br />
Table 114<br />
AVERAGE ACT COMPOSITE SCORES FOR<br />
CORE AND LESS THAN CORE TEST TAKERS, 1991-2003<br />
<strong>Iowa</strong> Nation<br />
Graduating Class Core Less than Core Core Less than Core<br />
1991 23.1 19.7 22.1 19.1<br />
1992 23.0 19.6 22.0 19.1<br />
1993 23.0 19.7 22.0 19.1<br />
1994 23.1 19.8 22.0 19.1<br />
1995 22.9 19.7 22.0 19.1<br />
1996 23.0 19.8 22.0 19.2<br />
1997 23.1 20.0 22.1 19.3<br />
1998 23.2 20.0 22.1 19.3<br />
1999 23.0 19.9 22.0 19.4<br />
2000 23.0 20.0 22.0 19.5<br />
2001 22.9 20.0 21.9 19.5<br />
2002 22.9 19.9 21.8 19.2<br />
2003 22.9 20.0 21.8 19.3<br />
224<br />
Source:<br />
Note:<br />
American College Testing Program, The High School Pr<strong>of</strong>ile Report for <strong>Iowa</strong>.<br />
ACT classifies high school programs consisting <strong>of</strong> four years <strong>of</strong> English and three or more years<br />
each <strong>of</strong> mathematics, natural science, and social studies as “core” programs.
Figure 125<br />
ACT Score<br />
36<br />
31<br />
26<br />
21<br />
16<br />
11<br />
6<br />
AVERAGE ACT COMPOSITE SCORES FOR<br />
CORE AND LESS THAN CORE TEST TAKERS, 1991-2003<br />
<strong>Iowa</strong> Core<br />
Nation Core<br />
<strong>Iowa</strong> Less than Core<br />
Nation Less than Core<br />
Student Performance<br />
<strong>State</strong> Indicators <strong>of</strong> Student Success<br />
1<br />
1991 1992 1993 1994 1995 1996 1997 1998 1999 2000 2001 2002 2003<br />
Graduating Class<br />
Source:<br />
Note:<br />
American College Testing Program, The High School Pr<strong>of</strong>ile Report for <strong>Iowa</strong>.<br />
ACT classifies high school programs consisting <strong>of</strong> four years <strong>of</strong> English and three or more years<br />
each <strong>of</strong> mathematics, natural science, and social studies as “core” programs.<br />
ACT Composite Score Distributions<br />
<strong>Iowa</strong> ACT composite score distributions for 1991,1995, 2002, and 2003 are provided in<br />
Table 115. <strong>Iowa</strong> score distributions have remained relatively stable for the years shown. The<br />
percentage <strong>of</strong> <strong>Iowa</strong> graduates that achieved an ACT composite score <strong>of</strong> 21 or above<br />
increased to 60.7 percent in 2003 from 60.4 percent in 2002 and 58.3 in 1991. Figure 126<br />
shows the distribution <strong>of</strong> <strong>Iowa</strong> ACT composite scores for 2003.<br />
Table 115<br />
IOWA ACT COMPOSITE SCORE DISTRIBUTIONS<br />
1991, 1995, 2002 AND 2003<br />
Year<br />
1991 1995 2002 2003<br />
Percent Percent at Percent Percent at Percent Percent at Percent Percent at<br />
Score At and Above At and Above At and Above At and Above<br />
Figure 126<br />
DISTRIBUTION OF IOWA ACT COMPOSITE SCORES - 2003<br />
10<br />
Percent<br />
9<br />
8<br />
7<br />
6<br />
5<br />
4<br />
3<br />
2<br />
1<br />
0<br />
8.6 8.7<br />
8.5<br />
7.8<br />
7.7<br />
6.8<br />
7.3<br />
6.6<br />
5.5<br />
5.4<br />
4.4<br />
4.5<br />
3.7<br />
2.7<br />
2.5<br />
2.3<br />
1.7<br />
1.7<br />
1.5<br />
1.0 0.6<br />
0.4<br />
13<<br />
14 15 16 17 18 19 20 21 22 23 24 25 26 27 28 29 30 31 32 33 34+<br />
ACT Score<br />
Source:<br />
American College Testing Program, The High School Pr<strong>of</strong>ile Report for <strong>Iowa</strong>.<br />
ACT Scores by Enrollment Category<br />
<strong>Iowa</strong> public school average ACT scores by enrollment category for graduating classes <strong>of</strong><br />
2001 and 2002 are shown in Table 116. On average, students in the enrollment categories<br />
<strong>of</strong> less than 2,499 students were at or below the state average in all ACT test areas for both<br />
2001 and 2002. Average ACT scores for the less than 250 enrollment category decreased<br />
from 2001 and were the lowest <strong>of</strong> all the enrollment categories. Average ACT scores for the<br />
2,500-7,499 category were the highest <strong>of</strong> all the enrollment categories for each area tested<br />
in both 2001 and 2002.<br />
Table 116<br />
IOWA PUBLIC SCHOOL AVERAGE ACT SCORES BY<br />
ENROLLMENT CATEGORY GRADUATING CLASSES OF 2001AND 2002<br />
Number Estimated % ACT Scores<br />
<strong>of</strong> Students <strong>of</strong> Students<br />
Enrollment Tested Tested English Math Reading Science Composite<br />
Category 2001 2002 2001 2002 2001 2002 2001 2002 2001 2002 2001 2002 2001 2002<br />
Table 117 and Figure 127 provide data on the average ACT composite scores for <strong>Iowa</strong> core<br />
and less than core groups by enrollment category. In general, the scores <strong>of</strong> both groups<br />
increased as the enrollment category increased up to the 2,500-7,499 enrollment category<br />
and then decreased for the 7,500 or more enrollment category. In 2003, average scores for<br />
less than core students in the 2,500-7,499 enrollment category (21.2) were above the average<br />
scores for the core students in the less than 250 enrollment category (20.9).<br />
Table 117<br />
AVERAGE ACT COMPOSITE SCORES FOR IOWA PUBLIC HIGH SCHOOL<br />
GRADUATING CLASSES 2001 AND 2002 BY ENROLLMENT<br />
CATEGORY AND COURSE OF STUDY<br />
Course <strong>of</strong> Study<br />
Enrollment Core Less than Core<br />
Category 2001 2002 2001 2002<br />
Student Performance<br />
<strong>State</strong> Indicators <strong>of</strong> Student Success<br />
ACT Scores by Gender<br />
Figure 128 compares average ACT composite scores by gender for <strong>Iowa</strong> and the nation.<br />
Males had higher average composite scores than females in <strong>Iowa</strong> and the nation for all years<br />
shown. <strong>Iowa</strong> males increased the gap in 2003 by scoring 0.4 points higher on average<br />
compared to 0.2 in 2002. Nationally, the gap remained at 0.2 points between male and female<br />
average composite score for the third consecutive year. Overall, the gap decreased from 1991<br />
to 2003 for both <strong>Iowa</strong> and the nation.<br />
Figure 128<br />
ACT AVERAGE COMPOSITE SCORES BY GENDER<br />
1991 - 2003<br />
23<br />
ACT Score<br />
22<br />
21<br />
20<br />
22.0 22.0<br />
21.8<br />
21.5 21.4<br />
20.9 20.9<br />
21.6<br />
21.0<br />
20.5 20.5<br />
20.4<br />
22.3 22.3<br />
22.1 22.1<br />
22.1 22.1 22.1 22.1<br />
22.0<br />
22.0<br />
21.8<br />
21.9<br />
21.7 21.6<br />
21.2<br />
21.1<br />
20.9<br />
21.0 21.0<br />
21.9 21.9<br />
21.8<br />
21.9<br />
21.1 21.2 21.1<br />
20.9<br />
20.9 20.9 20.9 20.9<br />
20.8 20.8<br />
20.7 20.7<br />
20.7<br />
<strong>Iowa</strong> Male <strong>Iowa</strong> Female<br />
U.S. Male U.S. Female<br />
22.2<br />
21.8<br />
21.0<br />
20.8<br />
19<br />
1991 1992 1993 1994 1995 1996 1997 1998 1999 2000 2001 2002 2003<br />
Graduating Class<br />
Source:<br />
American College Testing Program, The High School Pr<strong>of</strong>ile Report for <strong>Iowa</strong>.<br />
<strong>Iowa</strong> average ACT scores by gender for English, mathematics, reading, science reasoning,<br />
and composite are displayed in Table 118 for 2002 and 2003. On average, females scored<br />
higher in English and reading and males scored higher in mathematics, science reasoning,<br />
and composite for both years shown. More females took the ACT Assessment than males<br />
in 2002 and 2003.<br />
Table 118<br />
IOWA AVERAGE ACT SCORES BY GENDER<br />
2002 AND 2003<br />
Average ACT Scores<br />
Science<br />
Number <strong>of</strong> Test-takers English Mathematics Reading Reasoning Composite<br />
Gender 2002 2003 2002 2003 2002 2003 2002 2003 2002 2003 2002 2003<br />
Male 10,672 10,954 20.7 20.9 22.4 22.4 22.1 22.3 22.7 22.7 22.1 22.2<br />
Female 13,013 13,121 21.7 21.7 21.1 21.0 22.6 22.5 21.5 21.6 21.9 21.8<br />
Unreported* 120 125<br />
228<br />
Source:<br />
Note:<br />
American College Testing Program, The High School Pr<strong>of</strong>ile Report for <strong>Iowa</strong>.<br />
*ACT test-takers not reporting gender.
ACT Composite Scores by Student Planned Educational Majors<br />
Table 119 details the ACT average composite scores by planned educational majors.<br />
American College <strong>of</strong> Testing (ACT) tested graduates self-report their planned college majors<br />
when they register to take the ACT Assessment. In 2003, the area that had the most planned<br />
majors in <strong>Iowa</strong> and the nation was health science and allied health fields. In <strong>Iowa</strong>, graduates<br />
that reported a planned major in mathematics had the highest average composite score (25.3).<br />
Table 119<br />
ACT AVERAGE COMPOSITE SCORES BY PLANNED EDUCATIONAL MAJORS<br />
1991, 1994, 1997, AND 2000-2003<br />
Number<br />
Average ACT Composite Score<br />
<strong>of</strong> Students<br />
Planned Major Year 1991 1994 1997 2000 2001 2002 2003 2003<br />
Agriculture Science/ <strong>Iowa</strong> 20.0 20.2 20.4 20.3 20.5 20.2 19.9 631<br />
Technologies Nation 19.0 19.2 19.5 19.1 19.0 18.6 18.7 18,209<br />
Architecture & Envi- <strong>Iowa</strong> 21.9 21.5 22.0 21.6 21.6 21.6 21.7 644<br />
ronmental Design Nation 20.5 20.4 20.8 20.8 20.8 20.7 20.7 25,987<br />
Business & <strong>Iowa</strong> 21.4 21.4 21.6 21.4 21.5 21.4 21.6 2,327<br />
Management Nation 20.2 20.1 20.5 20.6 20.5 20.4 20.4 97,549<br />
Student Performance<br />
<strong>State</strong> Indicators <strong>of</strong> Student Success<br />
Business & <strong>Iowa</strong> 18.9 19.1 19.1 19.5 19.9 19.8 19.9 236<br />
Office Nation 17.7 17.7 18.0 18.5 18.8 18.7 18.9 7,577<br />
Marketing & <strong>Iowa</strong> 18.7 19.7 19.8 20.4 20.4 20.5 20.2 145<br />
Distribution Nation 18.7 18.7 19.2 19.6 19.9 19.8 19.9 7,618<br />
Communications & <strong>Iowa</strong> 21.7 21.9 22.3 22.4 22.3 22.5 22.0 845<br />
Comm. Tech. Nation 20.9 20.9 21.2 21.4 21.4 21.3 21.3 37,289<br />
Community & <strong>Iowa</strong> 19.3 19.5 19.7 20.0 19.8 19.9 19.9 759<br />
Personal Service Nation 18.3 18.5 18.7 18.8 18.7 18.6 18.6 30,899<br />
Computer and <strong>Iowa</strong> 22.1 22.6 22.9 22.6 22.5 22.5 22.6 844<br />
Information Science Nation 20.0 20.5 21.1 21.3 21.3 21.1 21.1 38,432<br />
Cross-Disciplinary <strong>Iowa</strong> 22.7 24.0 22.3 24.3 23.5 22.2 22.7 37<br />
Studies Nation 23.3 23.3 23.5 23.3 23.3 23.5 23.5 1,337<br />
Education <strong>Iowa</strong> 21.0 21.1 21.0 20.8 21.0 20.8 21.3 1,340<br />
Nation 20.0 20.1 20.2 20.3 20.3 20.3 20.4 52,768<br />
Teacher Education <strong>Iowa</strong> 21.3 21.1 21.3 21.2 21.2 21.0 21.2 729<br />
Nation 20.0 20.1 20.3 20.3 20.2 20.1 20.1 31,676<br />
Engineering <strong>Iowa</strong> 24.4 24.7 24.8 24.1 24.1 24.1 24.3 1,065<br />
Nation 22.9 22.9 22.9 22.6 22.5 22.1 22.2 51,445<br />
Engineering-Related <strong>Iowa</strong> 21.6 22.1 22.6 22.5 22.8 22.9 23.2 472<br />
Technologies Nation 20.5 20.5 20.9 21.4 21.6 21.5 21.7 26,588<br />
Foreign <strong>Iowa</strong> 24.1 24.0 23.0 23.9 23.6 24.0 24.2 95<br />
Language Nation 23.0 23.0 23.1 23.4 23.2 23.1 23.2 4,344<br />
Health Science & <strong>Iowa</strong> 22.1 22.1 22.3 22.2 22.1 21.9 21.8 3,651<br />
Allied Health Fields Nation 20.6 20.7 20.9 20.9 20.8 20.5 20.4 185,603<br />
Human/Family/ <strong>Iowa</strong> 19.0 19.1 19.6 19.7 19.7 20.4 20.0 256<br />
Consumer Science Nation 18.2 18.3 18.9 18.8 18.9 18.7 18.7 10,734<br />
Letters <strong>Iowa</strong> 25.1 24.7 25.1 25.0 24.9 25.3 24.9 180<br />
Nation 24.4 24.3 24.8 24.7 24.6 24.4 24.4 6,426<br />
Mathematics <strong>Iowa</strong> 25.1 25.7 25.8 25.5 25.3 25.1 25.3 105<br />
Nation 24.0 24.1 24.3 24.3 24.3 24.1 24.1 4,499<br />
Philosophy, Religion <strong>Iowa</strong> 23.1 22.1 23.6 23.1 23.4 23.2 23.3 155<br />
& Theology Nation 21.7 21.9 22.4 22.5 22.6 22.4 22.5 6,798<br />
Sciences <strong>Iowa</strong> 23.9 24.3 24.2 24.0 23.9 24.1 24.1 884<br />
Nation 23.3 23.3 23.5 23.3 23.3 23.2 23.2 46,489<br />
Social <strong>Iowa</strong> 22.6 22.6 22.9 22.8 22.9 22.8 23.0 1,628<br />
Sciences Nation 21.5 21.6 21.8 21.9 21.9 21.8 21.8 82,943<br />
Trade & <strong>Iowa</strong> 19.5 19.2 19.8 19.7 19.8 19.6 19.7 330<br />
Industrial Nation 18.7 18.5 18.7 18.9 19.0 18.5 18.6 13,715<br />
Visual & Performing <strong>Iowa</strong> 22.2 22.0 22.3 22.2 22.0 22.1 22.0 1,311<br />
Arts Nation 20.7 21.0 21.3 21.3 21.1 20.8 20.8 64,131<br />
Source:<br />
Note:<br />
American College Testing Program, The High School Pr<strong>of</strong>ile Report for <strong>Iowa</strong>.<br />
Letters consists <strong>of</strong> preparation in the areas <strong>of</strong> classics, comparative literature, creative writing,<br />
general English, linguistics, literature, speech, debate, and forensics.<br />
229
The average ACT composite scores by planned educational major for <strong>Iowa</strong> and the nation<br />
are shown in Table 120. Students indicating a mathematics major had the highest average<br />
scores in <strong>Iowa</strong> and were second highest nationally. Students indicating a major in letters<br />
(preparation in the areas <strong>of</strong> classics, comparative literature, creative writing, general<br />
English, linguistics, literature, speech, debate, and forensics) had the highest average scores<br />
nationally and were second highest in <strong>Iowa</strong>. The lowest average scores for <strong>Iowa</strong> and the<br />
nation were for those students that indicated a planned major in trade and industrial.<br />
Education and teacher education planned majors had average ACT scores that ranked 16 th<br />
and 17 th respectively in <strong>Iowa</strong> and 15 th and 17 th respectively nationally.<br />
Table 120<br />
ACT AVERAGE COMPOSITE SCORES BY<br />
PLANNED EDUCATIONAL MAJORS<br />
2003<br />
<strong>Iowa</strong> <strong>Iowa</strong> National National<br />
Planned Major Score Rank Score Rank<br />
Mathematics 25.3 1 24.1 2<br />
Letters* 24.9 2 24.4 1<br />
Engineering 24.3 3 22.2 7<br />
Foreign Language 24.2 4 23.2 4.5<br />
Sciences 24.1 5 23.2 4.5<br />
Philosophy, Religion, & Theology 23.3 6 22.5 6<br />
Engineer-Related Technologies 23.2 7 21.7 9<br />
Social Sciences 23.0 8 21.8 8<br />
Cross-Disciplinary Studies 22.7 19 23.5 3<br />
Computer & Information Science 22.6 10 21.1 11<br />
Communication & Communication Tech. 22.0 11.5 21.3 10<br />
Visual & Performing Arts 22.0 11.5 20.8 12<br />
Health Science & Allied Health Fields 21.8 13 20.4 15<br />
Architecture & Environmental Design 21.7 14 20.7 13<br />
Business & Management 21.6 15 20.4 15<br />
Education 21.3 16 20.4 15<br />
Teacher Education 21.2 17 20.1 17<br />
Marketing & Distribution 20.2 18 19.9 18<br />
Human/Family/Consumer Science 20.0 19 18.7 20.5<br />
Agriculture Science/Technologies 19.9 21 18.7 20.5<br />
Business & Office 19.9 21 18.9 19<br />
Community & Personal Services 19.9 21 18.6 22.5<br />
Trade & Industrial 19.7 23 18.6 22.5<br />
Source:<br />
Note:<br />
American College Testing Program, The High School Pr<strong>of</strong>ile Report for <strong>Iowa</strong>.<br />
*Letters consists <strong>of</strong> preparation in the areas <strong>of</strong> classics, comparative literature, creative writing,<br />
general English, linguistics, literature, speech, debate, and forensics.<br />
230
<strong>Iowa</strong> Student ACT Scores Compared to Self-Reported<br />
High School Performance<br />
Table 121 shows <strong>Iowa</strong> average composite ACT scores by the student’s self reported grade<br />
point average (GPA) for 2003. Students self report their high school grade point average and<br />
high school rank before they take the ACT. Slightly more than 45 percent <strong>of</strong> <strong>Iowa</strong> ACT<br />
tested graduates reported a grade point average <strong>of</strong> 3.5 or greater. These students had an<br />
average ACT composite score <strong>of</strong> 24.7 compared to the overall state average <strong>of</strong> 22.0 in 2003<br />
(see Table 110).<br />
Table 121<br />
IOWA AVERAGE ACT SCORES BY STUDENT SELF-REPORTED<br />
HIGH SCHOOL GRADE POINT AVERAGE, 2003<br />
Average ACT Scores<br />
Science<br />
GPA Number* Percent English Mathematics Reading Reasoning Composite<br />
3.5+ 9,778 45.2% 24.3 24.5 25.3 24.3 24.7<br />
3.0 - 3.49 5,965 27.6 20.4 20.7 21.5 21.5 21.1<br />
2.5 - 2.99 3,718 17.2 18.5 18.7 19.6 20.0 19.3<br />
2.0 - 2.49 1,720 7.9 17.0 17.7 18.3 19.0 18.1<br />
<strong>Iowa</strong> Student Satisfaction with Selected Aspects <strong>of</strong> the<br />
Local High School<br />
Table . 122 reports the 2003 <strong>Iowa</strong> ACT tested graduates’ satisfaction with selected aspects <strong>of</strong><br />
their high school program. The 2003 <strong>Iowa</strong> graduates rated their high schools on a scale <strong>of</strong><br />
1 to 4 (1 – satisfied, 2 – neutral, 3 – dissatisfied, 4 – no experience). Forty-six percent <strong>of</strong> the<br />
graduates indicated that they were satisfied with classroom instruction and the number and<br />
variety <strong>of</strong> course <strong>of</strong>ferings in their local high schools. The 2003 group <strong>of</strong> ACT test takers had<br />
21 percent that were dissatisfied with the number and variety <strong>of</strong> course <strong>of</strong>ferings and 9<br />
percent that were dissatisfied with the classroom instruction.<br />
Table 122<br />
IOWA ACT TEST TAKERS’ DEGREE OF SATISFACTION WITH<br />
SELECTED ASPECTS OF HIGH SCHOOL PROGRAM, 2003<br />
Satisfied Neutral Dissatisfied No<br />
Program Area (No change necessary) (Improvement Needed) Experience<br />
N % N % N % N %<br />
Classroom Instruction 11,100 46% 8,756 36% 2,094 9% 104 0%<br />
Number & Variety <strong>of</strong> 11,015 46% 5,921 24% 5,000 21% 127 1%<br />
Course Offerings<br />
Source: American College Testing Program, High School Pr<strong>of</strong>ile Report, High School Graduating Class<br />
<strong>of</strong> 2003, <strong>Iowa</strong>.<br />
Note: The total number <strong>of</strong> <strong>Iowa</strong> students tested in 2003 was 24,200.<br />
Scholastic Assessment Test (SAT)<br />
The first Scholastic Assessment Test (SAT) was administered in June 1926 to 8,040<br />
candidates. The number <strong>of</strong> candidates that took the SAT I:Reasoning Test in 2003 totaled<br />
over 1.4 million. Nationwide, approximately 36 percent <strong>of</strong> the SAT tested graduates were<br />
minority and 54 percent were female.<br />
The two primary components <strong>of</strong> the SAT are the SAT I: Reasoning Test and the SAT II:<br />
Subject Tests. The SAT I: Reasoning Test includes SAT verbal and SAT mathematics and<br />
the SAT II: Subject Tests have over 20 tests in five general subject areas. The SAT is one<br />
<strong>of</strong> the national college entrance examinations developed by the College Board. Scores for the<br />
mathematics and verbal tests <strong>of</strong> SAT I range from a low <strong>of</strong> 200 to a high <strong>of</strong> 800. The College<br />
Board reports national and state average scores for SAT I verbal and mathematics.<br />
The number <strong>of</strong> <strong>Iowa</strong> high school graduates that took SAT I in 2003 totaled 1,944 which<br />
accounted for approximately 5.3 percent <strong>of</strong> the 2003 <strong>Iowa</strong> graduates. In 2003, 51.3 percent<br />
<strong>of</strong> the <strong>Iowa</strong> SAT: I test takers were female and 9.2 percent self reported that they were<br />
minority students.<br />
232
<strong>Iowa</strong> SAT test takers had an average score <strong>of</strong> 586 on verbal and 597 on mathematics in 2003.<br />
<strong>Iowa</strong> average SAT verbal and math scores decreased from 2002 average scores but remained<br />
79 points above the national average in SAT verbal and 78 points above the national average<br />
in SAT math. Data in Table 123 and Figure 130 detail average SAT verbal and mathematics<br />
scores for test takers in <strong>Iowa</strong> and the nation’s graduating classes for 1991-2003. <strong>Iowa</strong>’s<br />
average scores for both verbal and mathematics have decreased for two consecutive years<br />
while the nation’s average verbal scores increased in 2003 and average math scores have<br />
increased two consecutive years.<br />
Table 123<br />
TRENDS OF AVERAGE SAT<br />
SCORES FOR IOWA AND THE NATION, 1991-2003<br />
SAT Verbal<br />
SAT Math<br />
Graduating Class <strong>Iowa</strong> Nation <strong>Iowa</strong> Nation<br />
Student Performance<br />
<strong>State</strong> Indicators <strong>of</strong> Student Success<br />
1991 588 499 591 500<br />
1992 585 500 596 501<br />
1993 593 500 595 503<br />
1994 580 499 586 504<br />
1995 589 504 595 506<br />
1996 590 505 600 508<br />
1997 589 505 601 511<br />
1998 593 505 601 512<br />
1999 594 505 598 511<br />
2000 589 505 600 514<br />
2001 593 506 603 514<br />
2002 591 504 602 516<br />
2003 586 507 597 519<br />
Source:<br />
Notes:<br />
The College Board, 2003 Pr<strong>of</strong>ile <strong>of</strong> SAT Program Test Takers.<br />
The <strong>Iowa</strong> participation rate in SAT for the class <strong>of</strong> 2003 was 5 percent.<br />
Historically, <strong>Iowa</strong> scores are based on a sample <strong>of</strong> 3 to 5 percent <strong>of</strong> the graduating class.<br />
233
Figure 130<br />
TRENDS OF AVERAGE SAT SCORES<br />
FOR IOWA AND THE NATION, 1991-2003<br />
800<br />
700<br />
SAT Score<br />
600<br />
500<br />
400<br />
300<br />
200<br />
<strong>Iowa</strong> SAT Verbal<br />
Nation SAT Verbal<br />
<strong>Iowa</strong> SAT Math<br />
Nation SAT Math<br />
1991 1992 1993 1994 1995 1996 1997 1998 1999 2000 2001 2002 2003<br />
Graduating Class<br />
Source:<br />
Note:<br />
The College Board, 2003 Pr<strong>of</strong>ile <strong>of</strong> SAT Program Test Takers.<br />
The <strong>Iowa</strong> participation rate in SAT for the class <strong>of</strong> 2003 was 5 percent.<br />
Historically, <strong>Iowa</strong> scores are based on 3 to 5 percent <strong>of</strong> the graduating class.<br />
Average SAT scores for <strong>Iowa</strong>, the nation and the midwest states are presented in Table 124.<br />
North Dakota ranked first in both mathematics and verbal while <strong>Iowa</strong> ranked second in the<br />
mathematics test and third in the verbal test in the nation and among midwest states.<br />
Comparisons across midwest states that have a low percentage <strong>of</strong> SAT tested students may<br />
be appropriate, however comparisons made between <strong>Iowa</strong> and other states with a high<br />
percentage <strong>of</strong> SAT tested graduates is not recommended. Illinois had the highest percentage<br />
<strong>of</strong> graduating students that took the SAT I test in 2003 among the midwest states at 11 percent.<br />
Table 124<br />
AVERAGE SAT SCORES FOR<br />
IOWA, THE NATION AND MIDWEST STATES<br />
1992, 1997 AND 2001 TO 2003<br />
V=Verbal M=Math Graduating Class<br />
% <strong>of</strong> Graduating<br />
Class <strong>of</strong> 2003<br />
Nation and <strong>State</strong> 1992 1997 2001 2002 2003 Taking<br />
V M V M V M V M V M SAT<br />
<strong>Iowa</strong> 585 595 589 601 593 603 591 602 586 597 5%<br />
Nation 500 501 505 511 506 514 504 516 507 519 48<br />
Illinois 549 555 562 578 576 589 578 596 583 596 11<br />
Kansas 562 562 578 575 577 580 578 580 578 582 9<br />
Minnesota 567 575 582 592 580 589 581 591 582 591 10<br />
Missouri 550 547 567 568 577 577 574 580 582 583 8<br />
Nebraska 553 557 562 564 562 568 561 570 573 578 8<br />
North Dakota 576 580 588 595 592 599 597 610 602 613 4<br />
South Dakota 565 565 574 570 577 582 576 586 588 588 4<br />
Wisconsin 556 564 579 590 584 596 583 599 585 594 7<br />
<strong>Iowa</strong>’s Rank in Nation 1 1 1 1 1 1 2 2 3 2<br />
234<br />
Source:<br />
Note:<br />
The College Board, 2003 Pr<strong>of</strong>ile <strong>of</strong> SAT Program Test Takers.<br />
Historically, <strong>Iowa</strong> scores are based on a sample <strong>of</strong> 3 to 5 percent <strong>of</strong> the graduating class.
Figures 131 and 132 detail <strong>Iowa</strong> average SAT scores by gender and test type from 1998 to<br />
2003. Average scores for males remain above female scores for both SAT verbal and<br />
mathematics, continuing the overall trend.<br />
Figure 131<br />
SAT Score<br />
800<br />
600<br />
IOWA AVERAGE SAT VERBAL SCORES BY GENDER<br />
1998-2003<br />
593<br />
594<br />
589<br />
593<br />
591<br />
586<br />
1998 1999 2000 2001 2002 2003<br />
596<br />
601<br />
589<br />
593<br />
594<br />
588<br />
591<br />
588<br />
589<br />
593<br />
589<br />
584<br />
Student Performance<br />
<strong>State</strong> Indicators <strong>of</strong> Student Success<br />
400<br />
200<br />
Total Male Female<br />
Source:<br />
Notes:<br />
The College Board, 2003 Pr<strong>of</strong>ile <strong>of</strong> SAT Program Test Takers.<br />
The <strong>Iowa</strong> participation rate in SAT for the class <strong>of</strong> 2003 was 5 percent.<br />
Historically, <strong>Iowa</strong> scores are based on 3 to 5 percent <strong>of</strong> the graduating class.<br />
Figure 132<br />
IOWA AVERAGE SAT MATHEMATICS SCORES BY GENDER<br />
1998-2003<br />
800<br />
1998 1999 2000 2001 2002 2003<br />
600<br />
601<br />
598<br />
600<br />
603<br />
602<br />
597<br />
619<br />
621<br />
621<br />
621<br />
621<br />
615<br />
585<br />
578<br />
581<br />
586<br />
586<br />
580<br />
SAT Scores<br />
400<br />
200<br />
Total Male Female<br />
Source:<br />
Notes:<br />
The College Board, 2003 Pr<strong>of</strong>ile <strong>of</strong> SAT Program Test Takers.<br />
The <strong>Iowa</strong> participation rate in SAT for the class <strong>of</strong> 2003 was 5 percent.<br />
Historically, <strong>Iowa</strong> scores are based on 3 to 5 percent <strong>of</strong> the graduating class.<br />
235
Advanced Placement (AP)<br />
The Advanced Placement (AP) Program, sponsored by the College Board, provides<br />
secondary school students the opportunity to take college-level courses in a high school<br />
setting. The AP program currently <strong>of</strong>fers more than 30 courses in 19 subject areas. AP<br />
courses are taught by highly qualified high school teachers who use the AP Course<br />
Descriptions to guide them and AP examinations are <strong>of</strong>fered once a year in May by the<br />
College Board.<br />
Advanced Placement examination grades are reported on a five-point scale: 1-No<br />
recommendation for college credit; 2-Possibly qualified; 3-Qualified; 4-Well qualified; and<br />
5-Extremely well qualified.<br />
Nearly 1.71 million AP examinations were taken in the United <strong>State</strong>s in 2003, while 7,721<br />
AP exams were taken by <strong>Iowa</strong> high school students. The number <strong>of</strong> <strong>Iowa</strong> AP candidates has<br />
increased 249 percent from 1,475 students in 1991 to 5,141 students in 2003, while the<br />
number <strong>of</strong> <strong>Iowa</strong> examinations has increased nearly 282 percent over the same period<br />
(Table 125).<br />
Table 125<br />
ADVANCED PLACEMENT PARTICIPATION FOR IOWA STUDENTS<br />
1991-2003<br />
Number <strong>of</strong> % Increase in Candidates Number Percent Increase in Exams<br />
Year Candidates from Prior Year <strong>of</strong> Exams from Prior Year<br />
1991 1,475 7.3% 2,023 12.6%<br />
1992 1,649 15.2 2,289 13.1<br />
1993 2,030 19.5 2,788 21.8<br />
1994 2,279 17.2 3,037 8.9<br />
1995 2,601 9.3 3,627 19.4<br />
1996 2,929 12.6 4,112 13.4<br />
1997 3,313 13.1 4,647 13.0<br />
1998 3,470 4.7 4,874 4.9<br />
1999 3,659 5.4 5,241 7.5<br />
2000 3,844 5.1 5,591 6.7<br />
2001 4,069 5.9 5,995 7.2<br />
2002 4,499 10.6 6,565 9.5<br />
2003 5,141 12.5 7,721 15.0<br />
Source:<br />
The College Board, Advanced Placement Program, <strong>Iowa</strong> Summary Reports.<br />
236
Table 126 shows the average scores for <strong>Iowa</strong> and the national AP exam takers. <strong>Iowa</strong> average<br />
AP scores are above the national averages for all years listed. In 2003, both <strong>Iowa</strong> average and<br />
national average AP test scores decreased from the 2002 figures.<br />
Table 126<br />
AVERAGE ADVANCED PLACEMENT EXAMINATION SCORES<br />
FOR ALL CANDIDATES, 1991-2003<br />
<strong>Iowa</strong><br />
Nation<br />
Year Total Exams Taken Average AP Score Total Exams Taken Average AP Score<br />
1991 2,023 3.21 523,236 3.00<br />
1992 2,289 3.16 566,036 3.04<br />
1993 2,788 3.13 623,933 3.00<br />
1994 3,037 3.27 684,449 3.06<br />
1995 3,627 3.11 767,881 2.96<br />
1996 4,112 3.14 824,329 2.99<br />
1997 4,647 3.11 899,463 3.02<br />
1998 4,874 3.13 991,952 3.02<br />
1999 5,241 3.16 1,122,414 3.02<br />
2000 5,591 3.16 1,242,324 3.01<br />
2001 5,995 3.10 1,380,146 2.95<br />
2002 6,565 3.18 1,548,999 2.99<br />
2003 7,721 3.14 1,705,207 2.95<br />
Student Performance<br />
<strong>State</strong> Indicators <strong>of</strong> Student Success<br />
Source:<br />
Note:<br />
The College Board, Advanced Placement Program, <strong>Iowa</strong> and National Summary Reports.<br />
AP score <strong>of</strong> 1 = carries no recommendation, 2 = possibly qualified, 3 = qualified, 4 = well qualified<br />
5 = extremely well qualified.<br />
<strong>Iowa</strong> AP score distributions are displayed in Table 127 for all candidates from 1991 to 2003.<br />
The male and female score distributions are shown in Tables 128 and 129. In 2003, about<br />
69 percent <strong>of</strong> <strong>Iowa</strong> exams scored three or above. In general, <strong>Iowa</strong> males performed better<br />
than the females on AP examinations for the years shown except 1993.<br />
Table 127<br />
ADVANCED PLACEMENT EXAM SCORE DISTRIBUTION FOR<br />
IOWA STUDENTS, 1991-2003<br />
AP Score Distributions<br />
Percent <strong>of</strong><br />
Candidates with AP<br />
Year 1 2 3 4 5 Scores <strong>of</strong> 3 or Above<br />
1991 4.3% 23.1% 34.9% 22.4% 15.3% 72.6%<br />
1992 5.9 22.7 35.3 22.3 13.8 71.4<br />
1993<br />
1994<br />
6.5<br />
3.8<br />
24.4<br />
21.4<br />
33.0<br />
35.5<br />
22.2<br />
22.6<br />
13.9<br />
16.7<br />
69.1<br />
74.8<br />
1995 6.6 24.6 33.2 22.8 12.8 68.8<br />
1996<br />
1997<br />
5.8<br />
7.6<br />
24.1<br />
23.4<br />
33.9<br />
32.3<br />
23.1<br />
23.8<br />
13.2<br />
12.9<br />
70.2<br />
69.0<br />
1998 6.2 23.8 33.7 23.4 12.9 70.0<br />
1999<br />
2000<br />
6.9<br />
6.5<br />
23.3<br />
22.2<br />
31.6<br />
33.6<br />
23.1<br />
24.5<br />
15.1<br />
13.2<br />
69.8<br />
71.3<br />
2001 6.5 26.2 31.3 22.9 13.1 67.3<br />
2002<br />
2003<br />
7.0<br />
8.1<br />
23.0<br />
23.0<br />
30.0<br />
30.3<br />
24.6<br />
23.8<br />
15.4<br />
14.9<br />
70.0<br />
69.0<br />
Source:<br />
Note:<br />
The College Board, Advanced Placement Program, <strong>Iowa</strong> and National Summary Reports.<br />
AP score <strong>of</strong> 1 = carries no recommendation, 2 = possibly qualified, 3 = qualified, 4 = well qualified<br />
5 = extremely well qualified.<br />
237
Table 128<br />
ADVANCED PLACEMENT EXAM SCORE DISTRIBUTIONS<br />
FOR IOWA MALES, 1991-2003<br />
AP Score Distributions<br />
Percent <strong>of</strong><br />
Candidates with AP<br />
Year 1 2 3 4 5 Scores <strong>of</strong> 3 or Above<br />
1991 4.6% 19.5% 34.6% 23.3% 18.0% 75.9%<br />
1992 6.1 20.8 32.9 24.0 16.2 73.1<br />
1993 6.6 24.5 29.8 23.7 15.4 68.9<br />
1994 3.4 19.4 33.7 25.0 18.5 77.2<br />
1995 6.6 22.4 30.8 24.1 16.1 71.0<br />
1996 5.3 22.3 32.0 24.5 15.9 72.4<br />
1997 7.5 21.5 31.4 24.4 15.2 71.0<br />
1998 6.1 21.7 31.7 24.8 15.7 72.2<br />
1999 6.2 21.0 29.5 24.9 18.4 72.8<br />
2000 5.8 19.6 32.3 26.4 15.9 74.6<br />
2001 6.3 23.1 31.1 23.7 15.8 70.6<br />
2002 6.6 20.5 28.6 25.5 18.8 72.9<br />
2003 7.5 19.6 29.1 26.1 17.7 73.0<br />
Source:<br />
Note:<br />
The College Board, Advanced Placement Program, <strong>Iowa</strong> and National Summary Reports.<br />
AP score <strong>of</strong> 1 = carries no recommendation, 2 = possibly qualified, 3 = qualified, 4 = well qualified<br />
5 = extremely well qualified.<br />
Table 129<br />
ADVANCED PLACEMENT EXAM SCORE DISTRIBUTIONS<br />
FOR IOWA FEMALES, 1991-2003<br />
AP Score Distributions<br />
Percent <strong>of</strong><br />
Candidates with AP<br />
Year 1 2 3 4 5 Scores <strong>of</strong> 3 or Above<br />
1991 3.9% 27.1% 35.2% 21.4% 12.4% 69.0%<br />
1992 5.5 24.8 38.1 20.4 11.2 69.7<br />
1993 6.3 24.4 35.9 20.8 12.6 69.3<br />
1994 4.2 23.3 37.3 20.2 15.0 72.5<br />
1995 6.6 26.6 35.5 21.6 9.7 66.8<br />
1996 6.3 25.8 35.7 21.6 10.6 67.9<br />
1997 7.8 25.5 33.1 23.1 10.5 66.7<br />
1998 6.3 25.7 35.5 22.1 10.4 68.0<br />
1999 7.6 25.7 33.8 21.1 11.8 66.7<br />
2000 7.2 24.7 34.9 22.6 10.6 68.1<br />
2001 6.7 29.1 31.5 22.0 10.7 64.2<br />
2002 7.5 25.4 31.3 23.8 12.0 67.1<br />
2003 8.7 26.6 31.4 21.4 11.8 64.7<br />
Source:<br />
Note:<br />
The College Board, Advanced Placement Program, <strong>Iowa</strong> and National Summary Reports.<br />
AP score <strong>of</strong> 1 = carries no recommendation, 2 = possibly qualified, 3 = qualified, 4 = well qualified<br />
5 = extremely well qualified.<br />
238
Table 130 compares the score distributions between <strong>Iowa</strong> and the nation from 2000 to 2003.<br />
For each year listed, a larger percentage <strong>of</strong> <strong>Iowa</strong> students achieved an AP score <strong>of</strong> three or<br />
above compared to the national distribution. In 2003, a higher percentage <strong>of</strong> <strong>Iowa</strong> students<br />
achieved the highest AP score (5) than the nation (14.9 percent vs. 13.9 percent), and a lower<br />
percentage <strong>of</strong> <strong>Iowa</strong> AP test takers received the lowest score (1) than the national candidates<br />
(8.1 percent vs. 14.4 percent, see Figure 133).<br />
Table 130<br />
ADVANCED PLACEMENT SCORE DISTRIBUTION<br />
FOR IOWA AND THE NATION<br />
2000 TO 2003<br />
2000 2001 2002 2003<br />
Percent Percent Percent Percent Percent Percent Percent Percent<br />
Score <strong>Iowa</strong> Nation <strong>Iowa</strong> Nation <strong>Iowa</strong> Nation <strong>Iowa</strong> Nation<br />
1 6.5% 12.9% 6.5% 13.4% 7.0% 13.8% 8.1% 14.4%<br />
2 22.2 23.4 26.2 25.3 23.0 23.1 23.0 24.1<br />
3 33.6 28.0 31.3 27.4 30.0 27.4 30.3 27.2<br />
4 24.5 21.0 22.9 20.2 24.6 21.4 23.8 20.4<br />
5 13.2 14.7 13.1 13.7 15.4 14.3 14.9 13.9<br />
100.0 100.0 100.0 100.0 100.0 100.0 100.0 100.0<br />
Student Performance<br />
<strong>State</strong> Indicators <strong>of</strong> Student Success<br />
% <strong>of</strong> Candidates<br />
with AP<br />
Scores <strong>of</strong><br />
3 or above 71.3 63.7 67.3 61.3 70.0 63.1 69.0 61.5<br />
Source:<br />
Note:<br />
The College Board, Advanced Placement Program, <strong>Iowa</strong> and National Summary Reports.<br />
AP score <strong>of</strong> 1 = no recommendation, 2 = possibly qualified, 3 = qualified, 4 = well qualified, and<br />
5 = extremely well qualified.<br />
Figure 133<br />
ADVANCED PLACEMENT EXAM SCORE DISTRIBUTIONS FOR<br />
IOWA AND THE NATION - 2003<br />
50<br />
40<br />
<strong>Iowa</strong><br />
Nation<br />
Percent<br />
30<br />
20<br />
14.4<br />
23.0<br />
24.1<br />
30.3<br />
27.2<br />
23.8<br />
20.4<br />
14.9<br />
13.9<br />
10<br />
8.1<br />
0<br />
1 2 3 4 5<br />
AP Score<br />
Source:<br />
Note:<br />
The College Board, Advanced Placement Program, <strong>Iowa</strong> and National Summary Reports.<br />
AP score <strong>of</strong> 1 = carries no recommendation, 2 = possibly qualified, 3 = qualified, 4 = well qualified<br />
5 = extremely well qualified.<br />
239
Table 131 shows the AP school participation rates by state from 1991 to 2002. Nearly 59<br />
percent <strong>of</strong> U.S high schools participated in the AP program in 2002, a 34 percent increase<br />
from the 1991 figure. There are over 44 percent <strong>of</strong> <strong>Iowa</strong> high schools in AP programs in<br />
2002, a 146 percent increase from the 1991 figure. <strong>Iowa</strong>’s AP school participation rate<br />
ranked 38 th among the 50 states and the District <strong>of</strong> Columbia in 2002 and 46 th in 1991.<br />
Table 131<br />
PERCENT OF TOTAL SCHOOLS PARTICIPATING IN ADVANCED PLACEMENT<br />
1991-2002<br />
Rank<br />
Year<br />
2002 <strong>State</strong> 2002 2001 2000 1999 1998 1997 1996 1995 1994 1993 1992 1991<br />
240<br />
1 Massachusetts 85.8 87.5 86.4 82.5 82.3 80.4 80 78 78 75 74 73<br />
2 Connecticut 85.4 84.6 85.2 87.9 82.3 82.1 84 80 78 78 77 77<br />
3 New Jersey 84.2 87.3 87.8 87.4 83.7 85.0 85 83 80 78 77 75<br />
4 New York 78.6 77.8 76.7 75.2 74.6 73.7 72 71 69 68 66 65<br />
5.5 Maryland 78.2 78.4 79.3 74.9 74.1 72.5 71 69 72 69 68 68<br />
5.5 Utah 78.2 74.8 78.6 69.4 71.6 73.0 70 70 74 68 69 63<br />
7 Dist. <strong>of</strong> Col. 76.6 70.2 94.7 72.5 73.2 82.5 100 100 78 81 76 97<br />
8 California 75.6 74.3 74.7 72.3 69.7 68.9 69 66 65 64 63 60<br />
9 Virginia 74.3 72.7 74.7 71.8 69.5 69.4 70 68 69 69 67 66<br />
10 Rhode Island 72.3 63.2 70.1 76.1 74.6 72.6 74 73 68 63 66 59<br />
11 Vermont 72.2 71.7 72.2 76.8 69.5 74.7 66 66 61 65 61 56<br />
12 South Carolina 71.5 70.7 74.0 71.4 70.0 70.6 70 70 67 66 65 65<br />
13 New Hampshire 70.7 70.7 79.5 75.0 69.0 71.2 68 69 62 60 58 53<br />
14 Delaware 70.0 62.1 64.4 63.3 47.4 46.8 46 42 62 62 58 58<br />
15 Kentucky 69.4 65.0 66.4 64.8 60.0 62.5 62 58 60 59 58 53<br />
16 Wisconsin 68.9 67.4 65.3 64.1 60.1 56.9 56 52 52 47 46 36<br />
17 Maine 68.5 65.0 63.3 63.1 57.4 58.5 58 54 56 53 50 45<br />
18 North Carolina 68.0 66.4 67.7 67.6 63.3 63.9 64 64 67 67 60 57<br />
19 Texas 67.5 65.3 63.1 60.7 56.9 56.3 51 45 38 35 32 29<br />
20 Ohio 66.5 64.0 63.1 61.0 59.7 58.5 58 56 53 54 53 51<br />
21 Georgia 66.3 65.0 65.0 60.5 58.5 57.8 59 59 61 60 53 49<br />
22 Indiana 64.0 59.4 59.1 57.0 56.2 56.4 55 55 57 53 49 45<br />
23 Hawaii 63.8 74.4 72.7 82.7 73.3 69.9 68 65 65 72 68 65<br />
24 Pennsylvania 63.6 62.4 63.4 61.7 60.6 60.9 60 56 53 52 51 48<br />
25 West Virginia 62.3 56.6 55.2 49.4 55.3 57.5 63 64 60 59 59 55<br />
26 Washington 61.6 61.1 58.1 58.4 54.7 52.8 53 48 47 48 50 48<br />
United <strong>State</strong>s 58.9 57.3 57.3 56.0 53.8 52.9 52 50 49 48 46 44<br />
27 Michigan 57.8 57.2 56.7 56.5 54.1 53.1 52 50 51 51 48 47<br />
28.5 Florida 56.9 54.5 64.8 62.7 57.5 56.8 57 55 55 55 52 52<br />
28.5 Tennessee 56.9 55.6 53.1 53.2 50.6 50.2 50 47 45 45 43 44<br />
30 Illinois 56.0 54.1 54.1 52.0 51.8 52.2 50 49 47 45 44 42<br />
31 Oklahoma 54.6 49.3 42.0 33.7 24.8 18.0 16 17 17 15 15 16<br />
32 New Mexico 53.4 47.6 50.0 48.4 43.9 39.0 42 40 39 34 31 28<br />
33 Colorado 52.6 48.6 49.9 50.7 47.8 47.9 50 50 47 47 44 43<br />
34 Idaho 49.3 48.7 42.0 49.0 42.7 42.8 39 41 37 40 35 37<br />
35 Oregon 48.9 49.5 50.2 48.7 48.5 42.5 44 45 44 45 44 40<br />
36.5 Nevada 48.6 45.7 38.7 41.0 40.2 52.2 56 53 52 52 48 44<br />
36.5 Minnesota 48.6 47.7 44.6 45.3 43.1 43.1 44 42 35 34 30 30<br />
38 <strong>Iowa</strong> 44.2 36.6 33.3 35.6 36.3 31.9 29 30 27 25 22 18<br />
39 Montana 38.6 34.6 34.3 33.2 32.3 35.0 31 31 28 27 26 22<br />
40 Missouri 35.8 34.0 32.6 30.2 27.1 24.9 26 26 24 20 19 20<br />
41 Arizona 34.8 39.4 51.0 50.2 53.9 46.6 57 51 55 55 54 52<br />
42 Arkansas 34.7 32.5 33.0 32.2 30.5 30.2 27 22 23 21 20 19<br />
43 Mississippi 34.6 36.1 38.7 36.4 38.2 36.4 38 33 34 30 31 31<br />
44 Alabama 33.9 35.4 36.3 38.3 36.9 41.9 44 45 45 46 46 45<br />
45 Wyoming 31.2 29.6 33.3 30.5 29.1 30.4 30 30 34 34 33 31<br />
46 Kansas 28.0 24.6 24.4 26.0 24.1 22.8 24 25 22 20 20 18<br />
47 South Dakota 26.9 23.6 19.2 21.1 19.0 15.9 14 19 9 9 7 12<br />
48 Louisiana 26.7 27.0 24.6 24.4 23.8 23.9 24 25 24 24 23 21<br />
49 Nebraska 22.2 18.6 21.7 22.5 22.7 21.7 19 22 20 21 20 18<br />
50 Alaska 11.8 11.3 12.6 13.9 12.8 11.7 12 12 13 12 10 10<br />
51 North Dakota 11.2 8.7 8.8 8.2 7.6 7.4 7 5 5 5 5 4<br />
Source: The College Board, Advanced Placement Program, <strong>Iowa</strong> and National Summary Reports, 1991-2002.
Compared to 1991, the number <strong>of</strong> AP examinations per 1,000 high school juniors and seniors<br />
increased for most states and the U.S. average (Table 132). Although the <strong>Iowa</strong> AP<br />
examination rate increased in 2002, <strong>Iowa</strong>’s rank in the nation has not improved since 1995.<br />
Table 132<br />
NUMBER OF ADVANCED PLACEMENT EXAMINATIONS TAKEN<br />
PER THOUSAND 11TH AND 12TH GRADERS, 1991-2002<br />
Rank<br />
Year<br />
2002 <strong>State</strong> 2002 2001 2000 1999 1998 1997 1996 1995 1994 1993 1992 1991<br />
1 Virginia 356 344 316 302 249 241 227 221 209 184 170 161<br />
2 Dist. <strong>of</strong> Col. 351 *** 423 388 359 331 277 249 251 221 220 283<br />
3 New York 332 318 290 276 256 237 218 195 192 180 170 157<br />
4 Maryland 322 285 256 234 216 201 188 177 164 157 145 135<br />
5 California 307 282 259 238 221 206 195 178 167 157 147 139<br />
6 North Carolina 303 266 235 219 190 178 167 170 145 119 95 81<br />
7 Florida 295 273 241 226 215 183 197 190 189 171 181 156<br />
8 New Jersey 282 261 239 245 210 206 195 163 155 143 136 121<br />
9 Connecticut 280 271 250 233 218 188 171 152 144 138 134 123<br />
10 Utah 266 254 242 235 231 232 221 229 239 215 211 193<br />
11.5 Massachusetts 262 264 239 230 213 202 180 162 153 145 134 121<br />
11.5 Texas 262 243 210 178 149 136 115 103 82 69 57 52<br />
13 Delaware 261 216 187 182 176 168 155 136 132 135 120 103<br />
14 Hawaii 226 187 173 164 157 142 129 140 136 127 129 118<br />
15 South Carolina 221 197 190 193 191 184 178 171 165 152 141 130<br />
16 Georgia 218 205 186 169 144 122 110 144 154 125 85 77<br />
17 Colorado 212 194 179 158 147 131 124 119 122 121 123 115<br />
United <strong>State</strong>s 212 197 178 165 150 139 130 122 116 106 98 89<br />
18 Illinois 187 176 161 144 144 136 130 122 115 106 101 90<br />
19 Rhode Island 173 160 150 140 131 122 118 104 98 90 89 86<br />
20 Maine 169 160 141 137 118 125 104 96 84 80 71 63<br />
21.5 Pennsylvania 164 151 140 131 116 110 102 91 90 86 79 72<br />
21.5 Vermont 164 151 136 142 123 107 94 87 102 94 84 82<br />
23 Wisconsin 162 154 140 125 117 106 96 85 74 64 48 39<br />
24 Michigan 155 145 130 122 112 107 105 91 84 82 76 70<br />
25 Nevada 154 141 130 124 118 100 103 101 97 87 80 80<br />
26.5 Alaska 153 144 157 145 150 108 101 91 97 103 98 94<br />
26.5 Oklahoma 153 128 107 93 71 56 49 45 51 48 42 37<br />
28 New Mexico 149 138 114 106 83 80 76 74 78 74 80 72<br />
29 New Hampshire 148 158 150 147 138 127 122 111 95 91 83 74<br />
30 Kentucky 146 138 122 112 98 94 86 79 78 74 69 59<br />
31.5 Minnesota 143 140 120 123 105 80 75 77 51 46 40 35<br />
31.5 Washington 143 123 106 93 82 74 63 57 60 58 57 54<br />
33.5 Arizona 134 118 103 99 107 102 98 92 105 94 85 66<br />
33.5 Tennessee 134 132 126 121 104 97 94 88 89 80 74 70<br />
35 Ohio 128 119 113 112 103 96 88 83 72 68 63 55<br />
36 Indiana 121 113 107 98 91 89 97 92 84 68 59 50<br />
37 South Dakota 111 99 88 72 68 48 37 35 23 24 18 18<br />
38 Arkansas 108 99 84 72 62 54 42 41 37 32 29 29<br />
39 Montana 107 92 86 82 72 64 63 52 51 44 44 41<br />
40 Oregon 102 93 82 77 75 70 58 60 65 65 65 61<br />
41 Idaho 99 99 85 77 67 60 46 50 56 52 47 44<br />
42 West Virginia 98 88 81 72 66 72 68 68 62 58 55 48<br />
43 Missouri 94 84 71 64 56 51 48 47 47 44 38 34<br />
44 Alabama 92 84 79 82 84 94 88 88 81 73 70 62<br />
45 Wyoming 84 72 50 44 31 30 34 45 48 42 42 33<br />
46 Kansas 73 67 63 56 51 48 47 41 40 38 35 36<br />
47 <strong>Iowa</strong> 72 66 62 59 54 53 48 44 39 37 31 27<br />
48 North Dakota 67 54 48 41 38 28 32 24 21 19 19 19<br />
49 Mississippi 65 64 58 65 58 58 54 48 45 39 38 36<br />
50 Nebraska 58 53 47 45 50 49 44 48 46 47 41 39<br />
51 Louisiana 50 52 48 46 42 39 38 36 39 37 34 34<br />
Student Performance<br />
<strong>State</strong> Indicators <strong>of</strong> Student Success<br />
Source: The College Board, Advanced Placement Program, <strong>Iowa</strong> and National Summary Reports, 1991-2002.<br />
Note: ***AP exams per 1000 11th and 12th graders is not available for 2001.<br />
241
National Assessment <strong>of</strong> Educational Progress (NAEP)<br />
For more than a quarter <strong>of</strong> a century, the National Assessment <strong>of</strong> Educational Progress<br />
(NAEP), conducted by the U.S. Department <strong>of</strong> Education, has been the only nation-wide<br />
assessment <strong>of</strong> student achievement in various subject areas.<br />
A NAEP Reading assessment was conducted in 1992. The tests reflected the three purposes<br />
<strong>of</strong> reading: Reading for literary experience, reading to gain information, and reading to<br />
perform a task. All three grades were assessed on purposes one and two. Only 8 th and 12 th<br />
graders were assessed on reading to perform a task.<br />
In 2002, the NAEP Reading was assessed at 4 th , 8 th , and 12 th grade levels. The national data<br />
for the NEAP Reading are available for all three grades. However, state-by-state results are<br />
only available for grades 4 and 8. <strong>Iowa</strong>, along with 47 other states and jurisdictions,<br />
participated in the 2002 Reading at 4 th grade.<br />
Average Scale Scores<br />
The NAEP Reading Assessment scale score ranges from 0 to 500. Table 133 presents the<br />
overall performance <strong>of</strong> public school grade 4 students in <strong>Iowa</strong> and the nation. In all years<br />
show, the average scale scores for <strong>Iowa</strong> students were higher than the national averages. In<br />
1998, NAEP began testing the use <strong>of</strong> accommodations in reading, such as assessing these<br />
students in a small group setting or allowing them extra time. In 2002, about 19 percent <strong>of</strong> 4 th<br />
grade students nationwide selected for NAEP were identified as special needs students. This<br />
is almost double the size <strong>of</strong> the special needs population in 1992. Therefore, comparisons<br />
between the accommodations not permitted and accommodations permitted results should be<br />
interpreted with caution.<br />
Table 133<br />
NAEP, AVERAGE READING SCALE SCORES FOR GRADE 4<br />
PUBLIC SCHOOL STUDENTS, 1992, 1994, 1998 AND 2002<br />
Year <strong>Iowa</strong> Nation<br />
Accommodations Not Permitted<br />
1992 225 215<br />
1994 223 212*<br />
1998 223 215<br />
Accommodations Permitted<br />
1998 220 213*<br />
2002 223 217<br />
Source:<br />
Notes:<br />
U.S. Department <strong>of</strong> Education, National Center for Education Statistics, The Nation’s Report Card:<br />
<strong>State</strong> Reading 2002 Reports.<br />
In 1998, NAEP began to provide accommodations to special needs students.<br />
*The value is significantly different from the value for 2002.<br />
Percentage <strong>of</strong> Students by Achievement Levels<br />
242<br />
Student performance results are reported according to three achievement levels (Basic,<br />
Pr<strong>of</strong>icient, and Advanced) established by the National Assessment Governing Board (NAGB).<br />
These levels are intended to describe what students should know and be able to do at each<br />
achievement level. “Basic” represents partial mastery <strong>of</strong> prerequisite knowledge and skills<br />
that are fundamental for pr<strong>of</strong>icient work at each grade. “Pr<strong>of</strong>icient” represents solid academic<br />
performance, and “Advanced” represents superior performance.
The percentage <strong>of</strong> <strong>Iowa</strong> grade 4 students at or above pr<strong>of</strong>icient level was higher than the<br />
national average (Figure 134) in 2002. There were a total <strong>of</strong> 18 other states and jurisdictions<br />
(including four other midwest states: Kansas, Minnesota, Nebraska, and North Dakota) in the<br />
top category. Missouri student performance was not significantly different from the national<br />
average and three other midwest states (Illinois, South Dakota, and Wisconsin) did not<br />
participate in grade 4 NAEP Reading in 2002.<br />
Figure 134<br />
PERCENTAGE OF STUDENTS WITHIN EACH READING ACHIEVEMENT<br />
LEVEL RANGE, GRADE 4 PUBLIC SCHOOLS BY STATE<br />
2002<br />
Percentage at or above Pr<strong>of</strong>icient was higher than Nation (Public)<br />
below Basic Basic Pr<strong>of</strong>icient Advanced<br />
Student Performance<br />
<strong>State</strong> Indicators <strong>of</strong> Student Success<br />
<strong>Iowa</strong><br />
<strong>Iowa</strong><br />
Percentage at or above Pr<strong>of</strong>icient was not significantly different than Nation (Public)<br />
Percentage at or above Pr<strong>of</strong>icient was lower than Nation (Public)<br />
Source:<br />
Notes:<br />
Percent below Basic and Basic<br />
Percent Pr<strong>of</strong>icient and Advanced<br />
U.S. Department <strong>of</strong> Education, Institute <strong>of</strong> Education Sciences, National Center for Education<br />
Statistics, National Assessment <strong>of</strong> Educational Progress (NAEP), 2002 Reading Assessment.<br />
Percentages may not add to 100, due to rounding.<br />
t Indicates that the jurisdiction did not meet one or more <strong>of</strong> the guidelines for school<br />
participation in 2002.<br />
243
Pursuit <strong>of</strong> Postsecondary Education/Training<br />
Information presented in this section contains graduation follow-up data for years 1985 and<br />
1992 through 1996, a combination <strong>of</strong> graduation follow-up and graduate intentions data from<br />
1997 through 1999, and graduate intentions data from 2000 though 2003. The transition was<br />
caused by the actual practices <strong>of</strong> the school districts. Since many districts reported intentions,<br />
changes were made to assist in the implementation <strong>of</strong> collecting data via individual student<br />
records through Project EASIER (Electronic Access System for <strong>Iowa</strong> Education Records).<br />
The percent <strong>of</strong> <strong>Iowa</strong> public high school graduates who planned to pursue postsecondary<br />
education or training is displayed in Figure 135. The postsecondary institutions include fouryear<br />
public and private colleges, community colleges, public junior colleges, and private<br />
junior colleges and can be located in or out <strong>of</strong> <strong>Iowa</strong>. The percent <strong>of</strong> <strong>Iowa</strong> high school<br />
graduates that intended to pursue postsecondary education/training increased from 82.4<br />
percent in 2002 to 82.9 percent in 2003.<br />
Figure 135<br />
PERCENT OF IOWA PUBLIC HIGH SCHOOL GRADUATES/SENIORS PURSUING<br />
OR INTENDING TO PURSUE POSTSECONDARY EDUCATION/TRAINING<br />
GRADUATING CLASSES OF 1985 AND 1992-2003<br />
Percent<br />
90<br />
80<br />
70<br />
60<br />
50<br />
40<br />
30<br />
20<br />
61.4<br />
71.3 71.0 71.0 71.9 71.9 72.5 73.5<br />
75.8 78.7 82.7 82.4 82.9<br />
10<br />
0<br />
//<br />
1985 1992 1993 1994 1995 1996 1997 1998 1999 2000 2001 2002 2003<br />
Graduating Class<br />
Source:<br />
Note:<br />
<strong>Iowa</strong> Department <strong>of</strong> Education, Bureau <strong>of</strong> Planning, Research, and Evaluation, Basic Educational<br />
Data Survey, Graduate Follow-up/Intentions File.<br />
Due to the transition from collecting data on a graduate follow-up basis to collecting intentions for graduates,<br />
data for the graduating classes <strong>of</strong> 1997, 1998, and 1999 represent calculated estimates.<br />
244
The two smallest enrollment categories (less than 250 and 250-399) had the highest<br />
percentage <strong>of</strong> graduates that intended to pursue postsecondary education for the second year<br />
in a row in 2003. Both <strong>of</strong> those enrollment categories had 84.0 percent or more graduates<br />
that intended to seek higher education opportunities for both 2002 and 2003. All other<br />
enrollment categories were below 84.0 percent for 2002 and 2003 (see Table 134).<br />
Table 134<br />
PERCENT OF IOWA PUBLIC HIGH SCHOOL GRADUATES/SENIORS<br />
PURSUING OR INTENDING TO PURSUE POSTSECONDARY<br />
EDUCATION/TRAINING GRADUATING CLASSES OF<br />
1985 AND 1995 THROUGH 2003<br />
Graduating<br />
Enrollment Category<br />
Class
The percent <strong>of</strong> high school graduates that intend to go to a community college increased for<br />
the third straight year in 2003. Since 1985, the percentage <strong>of</strong> graduates that plan to attend<br />
a community college has almost doubled, moving from 18.2 percent to 35.5 percent.<br />
Graduates that indicated that they intend to go to a public four-year college decreased for<br />
the third consecutive year in 2003. Table 136 provides the percent <strong>of</strong> public high school<br />
graduates that intended to pursue postsecondary education by the institution type.<br />
Table 136<br />
PERCENT OF IOWA PUBLIC HIGH SCHOOL GRADUATES/SENIORS PURSUING<br />
OR INTENDING TO PURSUE POSTSECONDARY EDUCATION/TRAINING<br />
BY POSTSECONDARY INSTITUTION, 1985 AND 1996 TO 2003<br />
Graduating Class<br />
Postsecondary Institution 1985 1996 1997 1998 1999 2000 2001 2002 2003<br />
Private 4-Year College 12.3% 13.3% 13.1% 13.3% 14.0% 12.6% 14.9% 15.8% 15.4%<br />
Public 4-Year College 23.3 25.3 25.1 26.6 25.9 28.0 27.3 25.5 25.0<br />
Private 2-Year College 1.4 1.2 1.3 1.0 2.0 5.8 5.2 4.4 2.7<br />
Community College 18.2 28.3 29.4 28.8 30.4 28.9 31.0 32.3 35.5<br />
Other Training 6.2 3.8 3.6 4.0 3.6 3.3 4.3 4.4 4.3<br />
Total 61.4 71.9 72.5 73.7 75.9 78.6 82.7 82.4 82.9<br />
Source:<br />
Note:<br />
<strong>Iowa</strong> Department <strong>of</strong> Education, Bureau <strong>of</strong> Planning, Research, and Evaluation, Basic Educational<br />
Data Survey, Graduate Follow-up/Intentions Files.<br />
Due to the transition from collecting data on a graduate follow-up basis to collecting intentions for graduates,<br />
data for the graduating classes <strong>of</strong> 1997, 1998, and 1999 represent calculated estimates.<br />
The percent <strong>of</strong> <strong>Iowa</strong> public school graduates that intended to pursue postsecondary education<br />
at four-year and two-year colleges is shown in Table 137 and Figure 136. In 1985 the<br />
difference between the four-year and two-year colleges was 16.0 percentage points. That gap<br />
has narrowed and by 2003 that difference was 2.2 percentage points.<br />
Table 137<br />
PERCENT OF IOWA PUBLIC SCHOOL GRADUATES/SENIORS PURSUING OR<br />
INTENDING TO PURSUE POSTSECONDARY EDUCATION/TRAINING<br />
AT FOUR-YEAR AND TWO-YEAR COLLEGES, 1985 AND 1996-2003<br />
Graduating Class<br />
Postsecondary Institution 1985 1996 1997 1998 1999 2000 2001 2002 2003<br />
Four-Year College 35.6% 38.6% 38.2% 39.9% 39.9% 40.6% 42.2% 41.3% 40.4%<br />
Two-Year College 19.6 29.5 30.7 29.8 32.3 34.7 36.2 36.7 38.2<br />
Source:<br />
Note:<br />
<strong>Iowa</strong> Department <strong>of</strong> Education, Bureau <strong>of</strong> Planning, Research, and Evaluation, Basic Educational<br />
Data Survey, Graduate Follow-up/Intentions Files.<br />
Due to the transition from collecting data on a graduate follow-up basis to collecting intentions for graduates,<br />
data for the graduating classes <strong>of</strong> 1997, 1998, and 1999 represent calculated estimates.<br />
246
Figure 136<br />
Percent<br />
45<br />
40<br />
35<br />
30<br />
25<br />
20<br />
15<br />
10<br />
5<br />
0<br />
PERCENT OF IOWA PUBLIC SCHOOL GRADUATES/SENIORS PURSUING OR<br />
INTENDING TO PURSUE POSTSECONDARY EDUCATION/TRAINING<br />
AT FOUR-YEAR AND TWO-YEAR COLLEGES, 1985-2003<br />
35.6 36.5 38.1 37.7 37.8 38.8 38.5 39.1 39.0 39.2 38.5 38.6 38.2 39.9 39.9 40.6 42.2 41.3 40.4<br />
19.6 19.6 19.6 21.1 22.7 24.2 25.1 27.1 27.6 27.9 29.5 29.5 30.7 29.8 32.3 34.7 36.2 36.7 38.2<br />
Two-Year College<br />
Four-Year College<br />
1985 1986 1987 1988 1989 1990 1991 1992 1993 1994 1995 1996 1997 1998 1999 2000 2001 2002 2003<br />
Graduating Class<br />
Student Performance<br />
<strong>State</strong> Indicators <strong>of</strong> Student Success<br />
Source:<br />
Note:<br />
<strong>Iowa</strong> Department <strong>of</strong> Education, Bureau <strong>of</strong> Planning, Research, and Evaluation, Basic Educational<br />
Data Survey, Graduate Follow-up/Intentions Files.<br />
Due to the transition from collecting data on a graduate follow-up basis to collecting intentions for graduates,<br />
data for the graduating classes <strong>of</strong> 1997, 1998, and 1999 represent calculated estimates.<br />
Postsecondary Enrollment Options<br />
<strong>Iowa</strong> Code, Chapter 261C, provides <strong>Iowa</strong> high school students the opportunity to earn<br />
college credit in high school. The “Postsecondary Enrollment Options Act” (PSEO) became<br />
law in 1993 and limits eligibility to 11 th and 12 th grade students and 9 th and 10 th grade students<br />
that are identified as gifted and talented as determined by school district criteria and<br />
procedures. Participating school districts are required to pay a fee to postsecondary<br />
institutions providing the course <strong>of</strong>fered for college credit. The fee is the amount equal to<br />
the lesser <strong>of</strong> “actual and customary cost <strong>of</strong> tuition, textbooks, materials, and fees directly<br />
related to the course taken,” or the sum <strong>of</strong> $250, according to law.<br />
The number <strong>of</strong> students earning college credit while enrolled in high school and the number<br />
<strong>of</strong> courses taken under the postsecondary enrollment options program in displayed in<br />
Table 138 and Figure 137. Total enrollments and PSEO courses taken decreased for the first<br />
time in 2002-2003. The total number <strong>of</strong> students decreased by 165 (2.4 percent) and the<br />
number <strong>of</strong> courses taken decreased by 287 (2.4 percent) compared to 2001-2002.<br />
247
Table 138<br />
IOWA POSTSECONDARY ENROLLMENT OPTIONS<br />
ENROLLMENTS AND COURSES<br />
1992-1993 TO 2002-2003<br />
Year Enrollments Courses<br />
1992-1993 2,219 3,229<br />
1993-1994 2,978 4,421<br />
1994-1995 3,465 5,016<br />
1995-1996 4,098 5,645<br />
1996-1997 4,577 7,125<br />
1997-1998 5,524 8,226<br />
1998-1999 5,815 9,991<br />
1999-2000 6,121 10,361<br />
2000-2001 6,556 11,408<br />
2001-2002 6,899 11,961<br />
2002-2003 6,734 11,674<br />
Source:<br />
<strong>Iowa</strong> Department <strong>of</strong> Education, Bureau <strong>of</strong> Planning, Research, and Evaluation, Basic Educational<br />
Data Survey, Postsecondary Enrollment Options Files.<br />
Figure 137<br />
IOWA POSTSECONDARY ENROLLMENT OPTIONS<br />
ENROLLMENTS AND COURSES - 1992-1993 TO 2002-2003<br />
12,000<br />
11,408<br />
11,961 11,674<br />
11,000<br />
9,991<br />
10,361<br />
10,000<br />
9,000<br />
8,226<br />
Enrollments/Courses<br />
8,000<br />
7,000<br />
6,000<br />
5,000<br />
4,000<br />
3,000<br />
2,000<br />
1,000<br />
3,229<br />
2,219<br />
4,421<br />
2,978<br />
5,016<br />
3,465<br />
5,645<br />
4,098<br />
7,125<br />
4,577<br />
5,524<br />
5,815<br />
6,121<br />
6,556<br />
6,899 6,734<br />
Enrollments<br />
Courses<br />
0<br />
1992-93 1993-94 1994-95 1995-96 1996-97 1997-98 1998-99 1999-00 2000-01 2001-02 2002-03<br />
Year<br />
Source:<br />
<strong>Iowa</strong> Department <strong>of</strong> Education, Bureau <strong>of</strong> Planning, Research, and Evaluation, Basic Educational<br />
Data Survey, Postsecondary Enrollment Options Files.<br />
248
The number <strong>of</strong> <strong>Iowa</strong> high school students that participated in the PSEO courses by grade level<br />
is displayed in Table 139. All grades listed decreased from 2001-2002 to 2002-2003. The<br />
largest decrease occurred in grade 12 with a reduction <strong>of</strong> 144 students (2.8 percent).<br />
Table 139<br />
NUMBER OF IOWA HIGH SCHOOL STUDENTS PARTICIPATED<br />
IN THE POSTSECONDARY ENROLLMENT OPTIONS ACT<br />
1992-1993 AND 2000-2001 TO 2002-2003<br />
9th and Grade 11 Grade 12 Total<br />
School Year 10th Graders Students Students Participants<br />
1992-1993 32 378 1,809 2,219<br />
2000-2001 167 1,498 4,891 6,556<br />
2001-2002 244 1,575 5,080 6,899<br />
2002-2003 241 1,557 4,936 6,734<br />
Student Performance<br />
<strong>State</strong> Indicators <strong>of</strong> Student Success<br />
Source: <strong>Iowa</strong> Department <strong>of</strong> Education, Bureau <strong>of</strong> Planning, Research, and Evaluation, Basic Educational<br />
Data Survey, Postsecondary Enrollment Options Files.<br />
Table 140 details the number <strong>of</strong> PSEO courses taken by high school students by the type <strong>of</strong><br />
course and institution. As in previous years, community colleges had the highest participation<br />
in both the academic area and the vocational/technical area. However, both <strong>of</strong> those areas<br />
decreased slightly from 2001-2002 to 2002-2003.<br />
Table 140<br />
NUMBER OF POSTSECONDARY ENROLLMENT OPTIONS COURSES<br />
TAKEN BY IOWA HIGH SCHOOL STUDENTS BY TYPE OF COURSE<br />
AND TYPE OF INSTITUTION<br />
1992-1993 AND 2000-2001 TO 2002-2003<br />
Academic (Math, Science, English, Etc.)<br />
Vocational/Technical<br />
Private Private Private Private Total<br />
School Regents Community 4-Year 2-Year Regents Community 4-Year 2-Year Courses<br />
Year Institution College College College Institution College College College Taken<br />
1992-1993 245 2,099 382 10 9 457 26 1 3,229<br />
2000-2001 571 6,900 833 119 29 2,902 41 13 11,408<br />
2001-2002 614 7,596 769 166 10 2,762 30 14 11,961<br />
2002-2003 586 7,438 843 32 18 2,714 36 7 11,674<br />
Source: <strong>Iowa</strong> Department <strong>of</strong> Education, Bureau <strong>of</strong> Planning, Research, and Evaluation, Basic Educational<br />
Data Survey, Postsecondary Enrollment Options Files.<br />
249
Although the total number <strong>of</strong> courses taken through a community college decreased slightly,<br />
the overall percentage <strong>of</strong> the PSEO courses taken at community colleges increased to 87.0<br />
percent in 2002-2003, up from 86.6 percent in 2001-2002. The percentage <strong>of</strong> PSEO courses<br />
taken at private four-year colleges increased to 7.5 percent in 2002-2003 and the percentage<br />
<strong>of</strong> PSEO courses taken at <strong>Iowa</strong> regents institutions remained unchanged in 2002-2003 (see<br />
Figure 138).<br />
Figure 138<br />
PERCENTAGE DISTRIBUTION OF POSTSECONDARY ENROLLMENT<br />
OPTION COURSES TAKEN BY IOWA HIGH SCHOOL STUDENTS<br />
1992-1993 AND 2000-2001 TO 2002-2003<br />
100<br />
Percent<br />
90<br />
80<br />
70<br />
60<br />
50<br />
40<br />
79.2<br />
85.9<br />
86.6<br />
87.0<br />
1992-1993<br />
2000-2001<br />
2001-2002<br />
2002-2003<br />
30<br />
20<br />
10<br />
0<br />
7.9<br />
5.3<br />
5.2<br />
5.2<br />
12.6<br />
7.7<br />
6.7<br />
7.5<br />
Regents Institutions Community Colleges Private 4-Year<br />
Colleges<br />
Institution Type<br />
0.3<br />
1.2<br />
1.5<br />
0.3<br />
Private 2-Year<br />
Colleges<br />
Source:<br />
<strong>Iowa</strong> Department <strong>of</strong> Education, Bureau <strong>of</strong> Planning, Research, and Evaluation, Basic Educational<br />
Data Survey, Postsecondary Enrollment Options File.<br />
Dropouts<br />
Dropout data for grades 7-12 are collected through the Fall Basic Educational Data Survey<br />
(BEDS) for all public school districts. Districts participating in Project EASIER, however,<br />
report dropout information in both the spring and fall for a crosscheck. Dropout data are<br />
available by gender and race/ethnicity. The grade level dropout information makes it possible<br />
to get a single given grade dropout rate or calculate high school (grade 9-12) dropout rate.<br />
The National Center for Education Statistics (NCES) definition used for dropouts is students<br />
who satisfy one or more <strong>of</strong> the following conditions:<br />
• Was enrolled in a school at some time during the previous school year and<br />
was not enrolled by October 1 <strong>of</strong> the current year or<br />
• Was not enrolled by October 1 <strong>of</strong> the previous school year although was<br />
expected to be enrolled sometime during the previous school year and<br />
• Has not graduated from high school or completed a state or district-approved<br />
educational program; and<br />
• Does not meet any <strong>of</strong> the following exclusionary conditions: a) transfer to<br />
another public school district, private school, or state or district-approved<br />
educational program, b) temporary school-recognized absence for<br />
suspension or illness, and c) death.<br />
250
A student who has left the regular program to attend a program designed to earn a GED<br />
(not an alternative high school) is considered a dropout.<br />
Figure 139 shows the trend <strong>of</strong> <strong>Iowa</strong> public school grade 7-12 dropouts as a percent <strong>of</strong><br />
public school grade 7-12 enrollments. Public school grade 9-12 dropout rates are also shown<br />
in Figure 139 for the first time. Between 1991-1992 and 1998-1999, grade 7-12 dropout<br />
rates were in a downward trend. A similar pattern can be seen for grade 9-12 dropout rates<br />
from 1992-1993 to 1998-1999. There were slight increases in the dropout percents in grades<br />
7-12 and 9-12 in 1999-2000 and larger increases in 2000-2001. In 2001-2002, the dropout<br />
rates decreases significantly for both grades 7-12 average and 9-12 average. In 2001-2002<br />
the dropout rate for grade 9-12 was 2.41 percent and the dropout rate for grade 7-12 was<br />
1.62 percent.<br />
Figure 139<br />
IOWA PUBLIC SCHOOL GRADES 7-12 AND<br />
GRADES 9-12 DROPOUT RATES<br />
1985-1986 AND 1990-1991 THROUGH 2001-2002<br />
Student Performance<br />
<strong>State</strong> Indicators <strong>of</strong> Student Success<br />
Percent<br />
4.0<br />
3.5<br />
3.0<br />
2.5<br />
2.0<br />
2.29<br />
2.49<br />
3.49<br />
3.41<br />
2.30 2.23<br />
3.22<br />
2.11<br />
3.31<br />
2.21<br />
3.14<br />
2.10<br />
2.98 2.92<br />
2.02 1.98<br />
2.56 2.57<br />
1.74 1.75<br />
2.70<br />
1.85<br />
2.41<br />
1.62<br />
1.5<br />
1.0<br />
0.5<br />
0.0<br />
//<br />
85-86 90-91 91-92 92-93 93-94 94-95 95-96 96-97 97-98 98-99 99-00 00-01 01-02<br />
School Year<br />
Grade 7-12 Dropout Rate<br />
Grade 9-12 Dropout Rate<br />
Source:<br />
<strong>Iowa</strong> Department <strong>of</strong> Education, Bureau <strong>of</strong> Planning, Research, and Evaluation, Basic Educational<br />
Data Survey, Dropout Files.<br />
Dropout data by grade for the state and broken down by enrollment category are shown in<br />
Table 141 for 2001-2002. In 2001-2002, a total <strong>of</strong> 3,711 students were reported as dropouts.<br />
The largest percentage <strong>of</strong> dropouts was from grade 12 with 35 percent, followed by grade<br />
11 with 30 percent <strong>of</strong> total dropouts. Only 10 students dropped out from grades 7 and 8<br />
combined.<br />
A comparison is also made for grade 7-12 dropout distribution and grade 7-12 enrollment<br />
distribution by enrollment category (see Table 141). Districts with enrollments <strong>of</strong> 2,500 and<br />
above accounted for 70 percent <strong>of</strong> all dropouts and 45 percent <strong>of</strong> grade 7-12 enrollments.<br />
On average, the districts in enrollment categories under 2,500 had grade 7-12 dropout rates<br />
below the state average. Less than 1 percent <strong>of</strong> the students in grades 7-12 dropped out in<br />
districts with fewer than 1,000 students. The grade 7-12 dropout rate was above 3 percent<br />
for the districts with more than 7,500 students.<br />
251
Table 141<br />
TOTAL IOWA PUBLIC SCHOOL GRADE 7-12 DROPOUTS<br />
BY ENROLLMENT CATEGORY<br />
2001-2002<br />
Grade Level % <strong>of</strong> % <strong>of</strong> Drop-<br />
Enrollment Total Total Enroll Out<br />
Category 7 8 9 10 11 12 Dropouts Dropouts 7-12 Percent<br />
2001-2002 dropout data and grade 7-12 enrollment by race/ethnicity are shown in Table<br />
143. The data reflect that dropout rates were higher for all minority groups than for the nonminority.<br />
In 2001-2002, all minorities represented less than 9 percent <strong>of</strong> grade 7-12 enrollments,<br />
while representing over 21 percent <strong>of</strong> total dropouts. The dropout rate for minorities<br />
was 3.92 percent compared to 1.40 percent for non-minority. All minority groups except<br />
Asian had grade 7-12 dropout rates above 4 percent.<br />
Table 143<br />
2001-2002 IOWA PUBLIC SCHOOL GRADE 7-12<br />
DROPOUTS BY RACE/ETHNICITY<br />
Race/<br />
Dropout<br />
Ethnicity<br />
Group<br />
as a %<br />
<strong>of</strong> Enrollment<br />
Total<br />
Dropouts<br />
% <strong>of</strong> Total<br />
Dropouts<br />
Grade 7-12<br />
Enrollment<br />
% <strong>of</strong> 7-12<br />
Enrollment<br />
Non-Minority 1.40% 2,926 78.85% 208,631 91.25%<br />
All Minority 3.92 785 21.15 20,006 8.75<br />
American Indian 4.18 51 1.37 1,219 0.53<br />
Asian 1.85 72 1.94 3,888 1.70<br />
Hispanic 4.55 327 8.81 7,193 3.15<br />
African American 4.35 335 9.03 7,706 3.37<br />
<strong>State</strong> 1.62 3,711 100.00 228,637 100.00<br />
Student Performance<br />
<strong>State</strong> Indicators <strong>of</strong> Student Success<br />
Source:<br />
<strong>Iowa</strong> Department <strong>of</strong> Education, Bureau <strong>of</strong> Planning, Research, and Evaluation, Basic Educational<br />
Data Survey, Dropout File.<br />
Table 144 shows dropout and enrollment as a percentage <strong>of</strong> the total by race/ethnicity from<br />
1994-1995 to 2001-2002. The grade 7-12 white enrollment and white dropouts as a percentage<br />
<strong>of</strong> the total have been decreasing from 1994-1995 to 2001-2002. The white dropout rate<br />
decreased nearly 9 percentage points <strong>of</strong> the total over the eight-year period, while the decrease<br />
<strong>of</strong> proportion <strong>of</strong> white enrollment was less than 3 percentage points (also see<br />
Figure 140).<br />
Table 144<br />
PERCENT OF DROPOUTS AND PERCENT OF ENROLLMENT<br />
FOR IOWA PUBLIC SCHOOL GRADES 7-12<br />
BY RACE/ETHNICITY<br />
1994-1995 TO 2001-2002<br />
Racial/Ethnic Group 1994- 1995- 1996- 1997- 1998- 1999- 2000- 2001-<br />
1995 1996 1997 1998 1999 2000 2001 2002<br />
% <strong>of</strong> 7-12 Total Dropouts<br />
White 87.8% 83.6% 84.8% 83.3% 83.0% 83.5% 80.1% 78.9%<br />
African American 5.6 9.0 7.6 7.4 6.4 6.3 7.9 9.0<br />
Hispanic 4.3 4.6 5.4 6.7 7.7 7.3 8.8 8.8<br />
Asian 1.3 1.6 1.3 1.4 1.6 1.6 1.5 1.9<br />
American Indian 1.0 1.2 0.9 1.2 1.3 1.3 1.7 1.4<br />
% <strong>of</strong> 7-12 Enrollment<br />
White 94.0% 93.7% 93.4% 93.1% 92.8% 92.4% 91.8% 91.3%<br />
African American 2.7 2.7 2.8 2.8 2.9 3.0 3.1 3.4<br />
Hispanic 1.5 1.7 1.9 2.1 2.2 2.5 2.8 3.1<br />
Asian 1.5 1.5 1.6 1.6 1.7 1.7 1.8 1.7<br />
American Indian 0.3 0.4 0.3 0.4 0.4 0.4 0.5 0.5<br />
Source:<br />
<strong>Iowa</strong> Department <strong>of</strong> Education, Bureau <strong>of</strong> Planning, Research, and Evaluation, Basic Educational<br />
Data Survey, Dropout Files.<br />
253
Figure 140<br />
COMPARISON OF THE PERCENTAGE OF GRADE 7-12 ENROLLMENTS<br />
AND GRADE 7-12 DROPOUTS REPRESENTED BY<br />
MINORITY AND WHITE IOWA PUBLIC SCHOOL STUDENTS<br />
1994-1995 AND 2001-2002<br />
100<br />
90<br />
80<br />
94.0<br />
87.8<br />
91.3<br />
78.9<br />
Percent <strong>of</strong> Total<br />
Enrollment<br />
Percent <strong>of</strong> Total<br />
Dropouts<br />
70<br />
Percent<br />
60<br />
50<br />
40<br />
30<br />
20<br />
10<br />
6.0<br />
12.2<br />
8.7<br />
21.1<br />
0<br />
94-95 White 94-95 Minority 01-02 White 01-02 Minority<br />
Race/Ethnicity<br />
Source:<br />
<strong>Iowa</strong> Department <strong>of</strong> Education, Bureau <strong>of</strong> Planning, Research, and Evaluation, Basic Educational<br />
Data Survey, Dropout Files.<br />
Table 145 shows 2001-2002 grade 7-12 dropout rate distributions. Slightly more than 27<br />
percent <strong>of</strong> <strong>Iowa</strong> public school districts reported no dropouts, and over 69 percent <strong>of</strong> the<br />
districts had a dropout rate <strong>of</strong> 1.0 or less in 2001-2002.<br />
Table 145<br />
DISTRIBUTION OF GRADE 7-12 DROPOUT RATES FOR<br />
IOWA PUBLIC SCHOOL DISTRICTS 2001-2002<br />
Dropout Number <strong>of</strong> Percent <strong>of</strong> Cumulative<br />
Rate Districts Districts Percent<br />
0 102 27.5% 27.5%<br />
.01-.50 64 17.2 44.7<br />
.51-1.00 91 24.6 69.3<br />
1.01-1.50 38 10.2 79.5<br />
1.51-2.00 33 8.9 88.4<br />
2.01-2.50 19 5.1 93.5<br />
2.51-3.00 11 3.0 96.5<br />
3.01-3.50 7 1.9 98.4<br />
3.51-4.00 2 0.5 98.9<br />
>4.00 4 1.1 100.0<br />
Source:<br />
Note:<br />
<strong>Iowa</strong> Department <strong>of</strong> Education, Bureau <strong>of</strong> Planning, Research, and Evaluation, Basic Educational<br />
Data Survey, Dropout Files.<br />
Dropout rates are combined grade 7-12 dropouts divided by combined grade 7-12 enrollment<br />
and expressed as a percent.<br />
254
Table 146 presents data from the National Center for Education Statistics (NCES) on grade<br />
9-12 dropout rates by state for school years 1994-1995 to 1999-2000. The percentage <strong>of</strong> <strong>Iowa</strong><br />
grade 9-12 dropouts has decreased from 3.5 percent in 1994-1995 to 2.5 percent in 1998-<br />
1999 and 1999-2000. <strong>Iowa</strong> had the lowest grade 9-12 dropout rate in the nation in 1999-2000.<br />
Table 146<br />
PUBLIC HIGH SCHOOL - GRADE 9-12 1<br />
DROPOUT RATES BY STATES 1994-1995 TO 1999-2000<br />
1994-1995 1995-1996 1996-1997 1997-1998 1998-1999 1999-2000<br />
Percent Nat’l Percent Nat’l Percent Nat’l Percent Nat’l Percent Nat’l Percent Nat’l<br />
Dropout Rank Dropout Rank Dropout Rank Dropout Rank Dropout Rank Dropout Rank<br />
<strong>Iowa</strong> 3.5 % 5 3.1%<br />
3.5 2.9 % 3 2.9%<br />
3 2.5%<br />
2 2.5%<br />
1<br />
Wisconsin 2.7 2 2.4 1 2.7 1.5 2.8 1.5 2.6 3 2.6 2<br />
North Dakota 2.5 1 2.5 2 2.7 1.5 2.8 1.5 2.4 1 2.7 3<br />
Connecticut 5.0 16.5 4.8 16.5 3.9 7.5 3.5 7.5 3.3 5.5 3.1 4.5<br />
New Jersey 2 4.0 8 4.1 8.5 3.7 6 3.5 7.5 3.1 4 3.1 4.5<br />
Maine 3.4 3 3.1 3.5 3.2 4 3.2 5.5 3.3 5.5 3.3 6<br />
South Dakota 2 5.3 22.5 5.7 26 4.5 12 3.1 4 4.5 16 3.5 7<br />
Virginia 2 5.2 20 4.7 14.5 4.6 14.5 4.8 17.5 4.5 16 3.9 8<br />
Nebraska 4.5 11 4.5 11.5 4.3 10 4.4 13.5 4.2 11 4.0 9.5<br />
Pennsylvania 4.1 9 4.0 7 3.9 7.5 3.9 9 3.8 8 4.0 9.5<br />
Delaware 4.6 12.5 4.5 11.5 4.5 12 4.7 16 4.1 10 4.1 12.5<br />
Maryland 2 5.2 20 4.8 16.5 4.9 17.5 4.3 12 4.4 12.5 4.1 12.5<br />
Massachusetts 3.6 7 3.4 5 3.4 5 3.2 5.5 3.6 7 4.1 12.5<br />
Utah 3.5 5 4.4 10 4.5 12 5.2 24.5 4.7 21 4.1 12.5<br />
Montana - - 5.6 23 5.1 21.5 4.4 13.5 4.5 16 4.2 16<br />
Tennessee 2 5.0 16.5 4.9 18 5.1 21.5 5.0 21 4.6 19.5 4.2 16<br />
West Virginia 4.2 10 3.8 6 4.1 9 4.1 10 4.9 23.5 4.2 16<br />
Minnesota 5.2 20 5.2 19 5.5 25 4.9 19.5 4.5 16 4.3 18<br />
Missouri 7.0 29 6.5 30 5.8 26 5.2 24.5 4.8 22 4.4 19<br />
Alabama 2 6.2 25 5.6 23 5.3 24 4.8 17.5 4.4 12.5 4.5 20<br />
Vermont 2 4.7 14 5.3 20 5.0 19.5 5.2 24.5 4.6 19.5 4.7 21<br />
Rhode Island 4.6 12.5 4.6 13 4.7 16 4.9 19.5 4.5 16 4.8 22<br />
Mississippi 6.4 26 6.2 28 6.0 28 5.8 28.5 5.2 26 4.9 23<br />
Kentucky - - - - - - 5.2 24.5 4.9 23.5 5.0 25<br />
Ohio 5.3 22.5 5.4 21 5.2 23 5.1 22 3.9 9 5.0 25<br />
Texas - - - - - - - - - 5.0 25<br />
Oklahoma 2 5.8 24 5.7 26 5.9 27 5.8 28.5 5.2 26 5.4 27<br />
Alaska 2 - - 5.6 23 4.9 17.5 4.6 15 5.3 28 5.5 28<br />
Arkansas 4.9 15 4.1 8.5 5.0 19.5 5.4 27 6.0 29 5.7 29.5<br />
Wyoming 6.7 28 5.7 26 6.2 29 6.4 30 5.2 26 5.7 29.5<br />
Oregon 3 7.1 30 7.0 31 - - - - 6.5 30.5 5.8 31<br />
New Mexico 8.5 31 8.3 33 7.5 32 7.1 33 7.0 33 6.0 32<br />
Illinois 2 6.6 27 6.4 29 6.6 30 6.9 32 6.5 30.5 6.2 33.5<br />
Nevada 10.3 35 9.6 35 10.2 35 10.1 36 7.9 35 6.2 33.5<br />
Dist. <strong>of</strong> Col. 10.6 36 - - - - 12.8 38 8.2 36 7.2 35.5<br />
Georgia 9.0 32 8.5 34 8.2 33 7.3 34 7.4 34 7.2 35.5<br />
Louisiana 3.5 5 11.6 37 11.6 36 11.4 37 10.0 38 9.2 37<br />
Arizona 9.6 34 10.2 36 10.0 34 9.4 35 8.4 37 - -<br />
Idaho 2 9.2 33 8.0 32 7.2 31 6.7 31 6.9 32 - -<br />
Kansas 5.1 18 4.7 14.5 4.6 14.5 4.2 11 - - - -<br />
Student Performance<br />
<strong>State</strong> Indicators <strong>of</strong> Student Success<br />
Source:<br />
Notes:<br />
National Center for Education Statistics, Dropout Rates in the United <strong>State</strong>s: 1996-2000; Public High<br />
School Dropouts and Completers from the Common Core <strong>of</strong> Data: School Years 1998-99 and<br />
1999-2000, August 2002.<br />
“-” Data not available.<br />
“ 1 ” Ungraded students are prorated into the 9 th through 12 th grade total for dropout rate calculation<br />
purposes.<br />
“ 2 ”This state reported on an alternative July through June cycle rather than the specified October through<br />
September cycle.<br />
“ 3 ”Oregon dropout counts erroneously included students that were completers, these students count for<br />
approximately 0.2 percent <strong>of</strong> Oregon’s dropout counts.<br />
255
High School Graduation Rates<br />
The Department <strong>of</strong> Education collects high school graduation data in the spring through the<br />
Basic Educational Data Survey (BEDS). The National Center for Education Statistics (NCES)<br />
definitions for high school completers are:<br />
• Regular diplomas are given to most students for completing all unmodified graduation<br />
requirements for the districts in the regular high school program.<br />
• Other diplomas are given to students who have received this diploma from an<br />
alternative placement within the district, or who have had the requirements modified<br />
in accordance with a disability.<br />
• Other Completers are the students who have finished the high school program, but<br />
did not earn a diploma. These students may earn a certificate <strong>of</strong> attendance or other<br />
credential in lieu <strong>of</strong> a diploma.<br />
The No Child Left Behind (NCLB) Accountability System is based primarily on academic<br />
assessments and requires high school graduation rate as one <strong>of</strong> the additional indicators for<br />
public high schools. The NCLB Act defines the regular diploma recipients as high school<br />
graduates. Therefore the <strong>Iowa</strong> Accountability Plans under the Consolidated Application Process<br />
has a narrower definition for high school graduates:<br />
• Students receiving regular diplomas. Regular diplomas are given to students<br />
for completing all unmodified district graduation requirements in the standard<br />
number <strong>of</strong> four years.<br />
• Students receiving regular diplomas from an alternative placement within the<br />
district, or who have had the requirements modified in accordance with a disability.<br />
The other completers are not high school graduates based on the <strong>Iowa</strong> Consolidated <strong>State</strong><br />
Application Accountability Workbook. In 2001-2002, there were 43 other completers statewide<br />
and many <strong>of</strong> them were foreign exchange students. Other completers are neither counted<br />
as graduates nor counted as dropouts for the NCLB Act purpose.<br />
The high school graduation rate is calculated by dividing the number <strong>of</strong> high school graduates<br />
in a given year by the estimated number <strong>of</strong> 9 th graders four years previous. The estimated<br />
9 th grade enrollment is the sum <strong>of</strong> the number <strong>of</strong> high school graduates in that year<br />
and dropouts over the four series year period. More specifically: The total dropouts include<br />
the number <strong>of</strong> dropouts in grade 9 in year 1, the number <strong>of</strong> dropouts in grade 10 in year 2,<br />
the number <strong>of</strong> dropouts in grade 11 in year 3, and the number <strong>of</strong> dropouts in grade 12 in year<br />
4. <strong>Iowa</strong> high school graduation rate in year 4 equals the number <strong>of</strong> public high school regular<br />
diploma recipients in year 4 divided by the number <strong>of</strong> high school regular diploma recipients<br />
in year 4 plus the sum <strong>of</strong> dropouts in grades 9 through 12 from years 1 through 4<br />
respectively.<br />
GR i<br />
=<br />
G i<br />
G i<br />
+ D i<br />
+ D (i - 1)<br />
+ D (i-2)<br />
+D (i-3)<br />
Where:<br />
GR i<br />
is the graduation rate for a given year (i).<br />
G i<br />
is the number <strong>of</strong> students achieving a regular high school diploma for year i.<br />
D i<br />
is the number <strong>of</strong> dropouts in grade 12 for year i.<br />
D (i-1)<br />
is the number <strong>of</strong> dropouts in grade 11 for the first previous year (i-1).<br />
D (i-2)<br />
is the number <strong>of</strong> dropouts in grade 10 for the second previous year (i-2).<br />
D (i-3)<br />
is the number <strong>of</strong> dropouts in grade 9 for the third previous year (i-3).<br />
256
Table 147 shows the high school graduation data by gender and state total for graduating<br />
classes 1996 through 2002. The overall graduation rates increased annually from 87.0 percent<br />
in 1996 to 89.4 percent in 2002. A similar trend can be seen for females and males.<br />
Females had higher rates than the males for all seven classes shown (also see Figure 141).<br />
Table 147<br />
IOWA PUBLIC HIGH SCHOOL FOUR-YEAR GRADUATION RATES<br />
BY GENDER, GRADUATING CLASSES 1996-2002<br />
Graduating Number <strong>of</strong> Graduates Graduation Rate<br />
Class Females Males Total Females Males Total<br />
1996 15,874 15,969 31,843 88.8% 85.2% 87.0%<br />
1997 16,531 16,455 32,986 88.8 85.6 87.2<br />
1998 17,156 17,033 34,189 89.7 86.5 88.1<br />
1999 17,095 17,283 34,378 89.7 86.8 88.2<br />
Student Performance<br />
<strong>State</strong> Indicators <strong>of</strong> Student Success<br />
2000 16,966 16,868 33,834 90.3 87.2 88.7<br />
2001 16,871 16,903 33,774 90.5 87.9 89.2<br />
2002 16,850 16,939 33,789 90.6 88.3 89.4<br />
Source:<br />
<strong>Iowa</strong> Department <strong>of</strong> Education, Bureau <strong>of</strong> Planning, Research, and Evaluation, Basic<br />
Educational Data Survey, High School Completers andDropout Files.<br />
Figure 141<br />
100%<br />
IOWA PUBLIC HIGH SCHOOL FOUR-YEAR GRADUATION RATES<br />
95%<br />
90%<br />
85%<br />
BY GENDER AND STATE TOTAL GRADUATING CLASSES<br />
1996 TO 2002<br />
Graduation Rate<br />
80%<br />
75%<br />
70%<br />
65%<br />
60%<br />
55%<br />
50%<br />
Females Males Total<br />
1996 1997 1998 1999 2000 2001 2002<br />
Graduating Class<br />
Source:<br />
<strong>Iowa</strong> Department <strong>of</strong> Education, Bureau <strong>of</strong> Planning, Research, and Evaluation, Basic<br />
Educational Data Survey, High School Completers and Dropout Files.<br />
257
Graduation data by race/ethnicity are shown in Table 148 for 1996 to 2002 graduating<br />
classes. Asian and White had the highest graduation rates for all classes shown. The other<br />
three minority groups, American Indian, Hispanic, and African American had high school<br />
graduation rates below the state average. The rates for White have been increasing steadily,<br />
increasing from 88.2 percent in 1996 to 90.7 percent in 2002. Minority data presented were<br />
less stable due to small group sizes.<br />
Table 148<br />
IOWA PUBLIC HIGH SCHOOL FOUR YEAR<br />
GRADUATION RATES BY RACE/ETHNICITY,<br />
GRADUATING CLASSES 1996 TO 2002<br />
Graduating<br />
Class 1996 1997 1998 1999 2000 2001 2002<br />
Race/Ethnicity<br />
Number <strong>of</strong> Graduates with Diplomas<br />
American<br />
Indian 55 73 84 90 74 212 108<br />
Hispanic 408 524 531 500 537 582 660<br />
Asian 508 555 508 496 546 684 657<br />
African<br />
American 648 614 696 673 734 678 756<br />
White 30,224 31,220 32670 32,619 31,943 31,618 31,608<br />
Total 31,843 32,986 34,189 34,378 33,834 33,774 33,789<br />
Race/Ethnicity<br />
Graduation Rates<br />
American<br />
Indian 46.2% 55.7% 62.2% 62.1% 62.1% 73.4% 61.7%<br />
Hispanic 67.1 69.8 72.0 62.4 64.9 65.8 67.5<br />
Asian 84.4 88.4 88.0 88.4 86.4 93.8 90.9<br />
African<br />
American 63.8 64.0 67.6 66.2 68.4 70.6 71.4<br />
White 88.2 88.3 89.1 89.5 90.0 90.3 90.7<br />
Total 87.0 87.2 88.1 88.2 88.7 89.2 89.4<br />
Source:<br />
<strong>Iowa</strong> Department <strong>of</strong> Education, Bureau <strong>of</strong> Planning, Research, and Evaluation, Basic Educational<br />
Data Survey, High School Completers and Dropout Files.<br />
258
Table 149 displays the graduation rates by enrollment category for graduating classes 1996<br />
to 2002. On average, districts with enrollment 2,500 and above had graduation rates less<br />
than the state average while districts with enrollments less than 2,500 had graduation rates<br />
above the state average. Despite fluctuations, the graduation rates for graduating class 2002<br />
are higher than the rates for graduating class 1996 for all seven-enrollment categories.<br />
Table 149<br />
IOWA PUBLIC HIGH SCHOOL FOUR YEAR GRADUATION RATES<br />
BY ENROLLMENT CATEGORY<br />
GRADUATING CLASSES 1996 THROUGH 2002<br />
Graduating<br />
Class 1996 1997 1998 1999 2000 2001 2002<br />
Enrollment<br />
Category<br />
Number <strong>of</strong> Graduates with Diplomas<br />
Table 150 displays data from the National Center for Education Statistics (NCES) on fouryear<br />
high school graduation rates by state for the years <strong>of</strong> 1995, 1999 and 2000. <strong>Iowa</strong> high<br />
school graduation rate has increased from 87 percent in 1995 to 88.8 percent in 2000. <strong>Iowa</strong><br />
had the third highest graduation rate in the nation in all three years shown, just behind<br />
Wisconsin and North Dakota.<br />
Table 150<br />
FOUR-YEAR HIGH SCHOOL GRADUATION RATES BY STATE<br />
1995, 1999 AND 2000<br />
1995 1999 2000<br />
Graduation Nat’l Graduation Nat’l Graduation Nat’l<br />
Percent Rank Percent Rank Percent Rank<br />
Wisconsin 88 % 2 89.7% 1.5 89.3%<br />
1<br />
North Dakota 90 1 89.7 1.5 88.9 2<br />
<strong>Iowa</strong> 87 3.5 88.3 3 88.8 3<br />
New Jersey 84 9 85.2 6 86.7 4<br />
Connecticut 81 16 83.7 9 86.5 5<br />
Maine 87 3.5 86.4 4 86.2 6<br />
Massachusetts 85 7 86.0 5 85.5 7<br />
Nebraska 83 11 84.5 7 85.1 8<br />
Pennsylvania 84 9 84.0 8 84.1 9<br />
South Dakota 79 26 81.7 15 83.6 10<br />
West Virginia 84 9 83.2 10 82.6 11<br />
Montana - - 82.0 13 82.4 12<br />
Maryland 80 21.5 81.6 16 81.9 13<br />
Virginia 81 16 81.5 17 81.8 14<br />
Vermont 81 16 82.1 12 81.4 15.5<br />
Utah 86 5.5 80.1 21 81.4 15.5<br />
Minnesota 80 21.5 81.2 18 81.2 17<br />
Delaware 81 16 82.9 11 80.8 18.5<br />
Rhode Island 81 16 81.8 14 80.8 18.5<br />
Ohio 80 21.5 80.5 20 80.4 20<br />
Arkansas 80 21.5 81.0 19 80.1 21<br />
Alabama 77 29.5 78.9 22.5 79.8 22<br />
Missouri 74 35.5 77.8 26 79.6 23<br />
Oklahoma - - 78.7 24 78.8 24.5<br />
Tennessee 79 26 78.5 25 78.8 24.5<br />
Wyoming 76 31.5 77.2 27 77.6 26<br />
Alaska - - 78.9 22.5 77.3 27<br />
Mississippi 75 33.5 76.4 28 76.4 28<br />
Illinois 75 33.5 75.8 29 75.4 29<br />
New Mexico 68 39 70.6 30 73.0 30<br />
Georgia 67 40 68.9 31 70.7 31<br />
Nevada 63 41 66.9 32 70.2 32<br />
Louisiana - - 61.5 34 62.6 33<br />
Arizona 57 42 63.2 33 - -<br />
South Carolina 86 5.5 - - - -<br />
Indiana 82 12.5 - - - -<br />
New York 82 12.5 - - - -<br />
Hawaii 80 21.5 - - - -<br />
Kansas 80 21.5 - - - -<br />
Kentucky 79 26 - - - -<br />
California 78 28 - - - -<br />
Florida 77 29.5 - - - -<br />
North Carolina 76 31.5 - - - -<br />
Colorado 74 35.5 - - - -<br />
Oregon 73 37 - - - -<br />
Idaho 71 38 - - - -<br />
260<br />
Source:<br />
Note:<br />
National Center for Education Statistics, A Recommended Approach to Providing High School<br />
Dropout and Completion Rates at the <strong>State</strong> Level, and Public High School Dropout and<br />
Completers from the Common Core <strong>of</strong> Data: School Years 1998-99 and 1999-2000.<br />
“-” Data not available.
Schools in Need <strong>of</strong> Assistance<br />
Under the No Child Left Behind Act (NCLB), public school districts and schools must report<br />
the academic progress <strong>of</strong> all students in the areas <strong>of</strong> reading and mathematics. If schools do<br />
not meet the annual Adequate Yearly Progress (AYP) state goals for reading and mathematics<br />
at grades 4, 8, and 11 by subgroups, a 95 percent participation rate on the district-wide<br />
assessment, the state attendance rate goal for elementary and middle schools, or the state<br />
graduation rate goal for high schools, they are designated as a school in need <strong>of</strong> assistance.<br />
Eleven <strong>of</strong> 1,500 (0.7 percent) public school buildings were determined to be in need <strong>of</strong><br />
assistance following the 2002-2003 school year. A list <strong>of</strong> the schools in need <strong>of</strong> assistance<br />
and the school districts they are located in is presented in Table 151. Publication <strong>of</strong> this list<br />
in the <strong>State</strong> Report Card and The Annual Condition <strong>of</strong> Education Report is required under<br />
the provisions <strong>of</strong> the NCLB Act.<br />
Table 151<br />
SCHOOLS IN NEED OF ASSISTANCE<br />
2003<br />
Student Performance<br />
<strong>State</strong> Indicators <strong>of</strong> Student Success<br />
District Name<br />
Central Decatur<br />
Davenport<br />
Des Moines<br />
Midland<br />
North Cedar<br />
Oskaloosa<br />
Waterloo<br />
School Name<br />
Decatur Elementary<br />
Buchanan Elementary<br />
Fillmore Elementary<br />
Hayes Elementary<br />
Jefferson Elementary<br />
Moulton Elementary<br />
Lost Nation Middle<br />
Lowden Elementary<br />
Lincoln Elementary<br />
Central Middle<br />
Logan Middle<br />
Source: <strong>Iowa</strong> Department <strong>of</strong> Education, Bureau <strong>of</strong> Administration and School Improvement Services, Title I.<br />
261
Highly Qualified Teacher Comparison<br />
Table 152 provides a comparison between full-time teachers in school buildings in the top<br />
quartile (school buildings with a high percentage <strong>of</strong> students eligible for free or reduced price<br />
lunch) and full-time teachers in buildings in the bottom quartile (school buildings with a low<br />
percentage <strong>of</strong> students eligible for free or reduced price lunch) for the 2002-2003 school year.<br />
<strong>Iowa</strong> requires that all teachers hold a valid <strong>Iowa</strong> teaching license and are properly endorsed<br />
to teach in the areas for which they are assigned. The NCLB Act also requires that a state<br />
include in its annual state report the characteristics <strong>of</strong> teachers in high and low poverty<br />
schools. High and low poverty schools are defined in NCLB as the top and bottom quartiles<br />
<strong>of</strong> schools in poverty. The differences between the teachers in the two categories are not<br />
significant. Teachers in the bottom quartile have a higher percentage <strong>of</strong> advanced degrees<br />
(28.4 percent versus 27.4 percent), have slightly more years <strong>of</strong> experience (14.9 versus 14.1),<br />
and on average make $640 more than teachers in the top quartile.<br />
Table 152<br />
TEACHER CHARACTERISTIC COMPARISON BETWEEN TOP QUARTILE<br />
POVERTY SCHOOLS AND BOTTOM QUARTILE POVERTY SCHOOLS<br />
2002-2003<br />
Number Number <strong>of</strong> Number <strong>of</strong> Percentage Number <strong>of</strong> Average<br />
<strong>of</strong> Full-Time Advanced <strong>of</strong> Advanced Bachelors Exper- Average Average<br />
Students Teachers Degrees Degrees Degrees ience Age Salary<br />
Top Quartile - 108,464 7,560 2,068 27.4% 5,492 14.1 42.1 $39,186<br />
Schools with<br />
highest percentage<br />
<strong>of</strong> students<br />
eligible for free<br />
or reduced lunch.<br />
Bottom Quartile - 144,038 7,697 2,189 28.4% 5,508 14.9 41.5 $39,826<br />
Schools with<br />
lowest percentage<br />
<strong>of</strong> students<br />
eligible for free or<br />
reduced lunch.<br />
Source: <strong>Iowa</strong> Department <strong>of</strong> Education, Bureau <strong>of</strong> Planning, Research, and Evaluation, Basic Educational<br />
Data Survey, Free and Reduced Meal Eligibility and Staff Files.<br />
262
Table 153 presents the estimated 2002-2003 assignments by academic area for grades 7-12.<br />
Estimates are based on the number <strong>of</strong> teachers with teaching assignments in their endorsement<br />
area compared to the number <strong>of</strong> teachers with teaching assignments outside their<br />
endorsement area. This estimate provides a snapshot <strong>of</strong> the percentage <strong>of</strong> classes in specific<br />
academic areas that are taught by a highly qualified teacher. Of the eleven academic areas<br />
shown, seven are approximately 90 percent or greater. Economics and geography have the<br />
lowest percentage at 65 percent and 51 percent respectively. For all areas shown, just under<br />
95 percent <strong>of</strong> the courses in the academic areas listed were taught by a highly qualified<br />
teacher.<br />
Table 153<br />
PERCENT OF TEACHERS TEACHING IN ENDORSEMENT AREA<br />
GRADE 7-12 PUBLIC SCHOOL TEACHERS BY ACADEMIC AREA<br />
2002-2003<br />
Academic Area<br />
Percent <strong>of</strong> Teachers Teaching<br />
in Endorsement Area<br />
Student Performance<br />
<strong>State</strong> Indicators <strong>of</strong> Student Success<br />
English 97.6%<br />
Reading/Language Arts 93.7<br />
Mathematics 96.8<br />
Science 87.7<br />
Foreign Language 90.4<br />
Civics/Government 82.9<br />
Economics 65.3<br />
Arts 97.6<br />
History 89.8<br />
Geography 51.1<br />
Elementary 97.1<br />
Total 94.8<br />
Source: <strong>Iowa</strong> Department <strong>of</strong> Education, Licensure and Basic Educational Data Survey Staff Files.<br />
Source: <strong>Iowa</strong> Department <strong>of</strong> Education, Licensure and Staff Files.<br />
263
264
FINANCE<br />
The finance chapter provides budget information pertaining to property taxes, state aid, and<br />
income surtax revenues. Expenditure information is included and is detailed by functions<br />
(instruction, administration, operations, transportation, and services) and objects (salaries,<br />
benefits, purchased services, supplies, property and other). Information is displayed at the<br />
state level and in some cases at the enrollment size category level. The 1985-1986 school year<br />
is used as basis <strong>of</strong> comparison wherever possible.<br />
The most current data available at the time <strong>of</strong> preparation <strong>of</strong> The Annual Condition <strong>of</strong><br />
Education Report is displayed. Sources for the information include the 2001-2002 Certified<br />
Annual Financial Report, the 2003-2004 Department <strong>of</strong> Management Aid and Levy Worksheet<br />
database, and Program and Budget Summary information from the Fiscal Services, Legislative<br />
Services Agency (formerly known as the Legislative Fiscal Bureau).<br />
Function Category Expenditures<br />
Function categories are grouped into instruction, student support services, staff support<br />
services, administrative services, operations and maintenance, student transportation, central<br />
support services, food services subsidy, and community service and education. Function<br />
category expenditures as a percentage <strong>of</strong> total general fund expenditures are displayed in<br />
Table 154.<br />
The percent <strong>of</strong> expenditures for instruction increased slightly between 2000-2001 and 2001-<br />
2002, and remained as the highest function category expenditure at 70.0 percent. Expenditures<br />
for operations and maintenance decreased by 0.8 percentage points from the 2000-2001<br />
school year. Student support services accounted for 3.8 percent <strong>of</strong> the function category<br />
expenditures for the last three years.<br />
Since the 1985-1986 school year, instruction expenditures increased from 65.3 percent to 70.0<br />
percent <strong>of</strong> the total expenditures. Other increases include student support services and staff<br />
support services with percentage point increases <strong>of</strong> 0.9 and 0.5 respectively. Noticeable<br />
decreases from the 1985-1986 school year include expenditures for operations and maintenance<br />
(3.8 percentage points), student transportation (1.6 percentage points) and administrative<br />
services (0.5 percentage points).<br />
Table 154<br />
FUNCTION CATEGORY EXPENDITURES AS A PERCENT OF<br />
TOTAL GENERAL FUND EXPENDITURES IN IOWA PUBLIC SCHOOLS<br />
1985-1986 AND 1999-2000 TO 2001-2002<br />
Year<br />
Function Category 1985-1986 1999-2000 2000-2001 2001-2002<br />
Instruction 65.3% 69.2% 69.0% 70.0%<br />
Student Support Services 2.9 3.8 3.8 3.8<br />
Staff Support Services 3.2 3.9 4.0 3.7<br />
Administrative Services 10.2 9.6 9.5 9.7<br />
Operations and Maintenance 12.2 8.7 9.2 8.4<br />
Student Transportation 5.2 3.9 3.8 3.6<br />
Central Support Services 0.6 0.6 0.4 0.5<br />
Food Services Subsidy 0.2 0.1 0.1 0.1<br />
Community Service and Education 0.2 0.2 0.2 0.2<br />
Finance<br />
Source:<br />
<strong>Iowa</strong> Department <strong>of</strong> Education, Division <strong>of</strong> Financial and Information Services, Certified Annual<br />
Financial Reports.<br />
265
Table 155 provides function category expenditures as a percent <strong>of</strong> total general fund<br />
expenditures by enrollment category. Expenditures on instruction ranged from 72.1 percent<br />
on average for districts with enrollments less than 250 to 69.2 percent on average for districts<br />
with enrollments between 400-599. On average, operations and maintenance expenditures<br />
accounted for a larger percentage <strong>of</strong> expenditures in districts with enrollments greater than<br />
600 students (all over 8.0 percent) than in districts with less than 600 students (all under 8.0<br />
percent). Student transportation costs were 2.6 percent <strong>of</strong> total expenditures in the 7,500+<br />
enrollment category and were 4.8 percent <strong>of</strong> total expenditures in the 600-999 enrollment category.<br />
Table 155<br />
FUNCTION CATEGORY EXPENDITURES AS A PERCENT OF TOTAL<br />
GENERAL FUND EXPENDITURES IN IOWA PUBLIC SCHOOLS<br />
BY ENROLLMENT CATEGORY 2001-2002<br />
Enrollment Category<br />
Function Category
Percentage <strong>of</strong> object category expenditures by enrollment category is provided in Table 157.<br />
Expenditures on salaries ranged from 52.2 percent <strong>of</strong> total expenditures in the school districts<br />
with less than 250 students to 66.5 percent in school districts with enrollments between 2,500<br />
and 7,499. On average, schools in the enrollment categories greater than 1,000 students spent<br />
a higher portion on salaries than the state average <strong>of</strong> 65.0 percent, while districts in the<br />
enrollment categories with less than 1,000 students spent less on salaries than the state average.<br />
A similar trend is noticeable in benefits expenditures as well. Districts in the 7,500+ enrollment<br />
category spent 18.0 <strong>of</strong> general fund expenditures on benefits while the districts in the less than<br />
250 enrollment category spent 13.1 percent on average. Purchased services continued to<br />
remain a substantial portion <strong>of</strong> expenditures for districts with less than 250 students. On<br />
average, the smallest districts spent 26.2 percent <strong>of</strong> the general fund expenditures on purchased<br />
services. These expenditures may result from costs <strong>of</strong> purchasing instructional and administrative<br />
services associated with whole grade sharing.<br />
Table 157<br />
OBJECT CATEGORY EXPENDITURES AS A PERCENT OF<br />
TOTAL GENERAL FUND EXPENDITURES IN IOWA PUBLIC SCHOOLS<br />
BY ENROLLMENT CATEGORY 2001-2002<br />
Enrollment Category<br />
1,000- 2,500-<br />
Object Category
Table 158<br />
REVENUES BY SOURCE AS A PERCENT OF TOTAL<br />
GENERAL FUND REVENUES IN IOWA PUBLIC SCHOOLS<br />
1985-1986 AND 1999-2000 TO 2001-2002<br />
Year<br />
Source <strong>of</strong> Revenue 1985-1986 1999-2000 2000-2001 2001-2002<br />
Local Taxes 47.3% 31.6% 32.0% 32.8%<br />
Interagency 1.4 3.9 3.9 4.2<br />
Other Local Sources 1.8 2.6 2.6 2.2<br />
Intermediate Sources 0.1 0.2 0.3 0.3<br />
<strong>State</strong> Foundation Aid 46.0 52.9 52.3 50.6<br />
Other <strong>State</strong> Sources 0.7 5.3 5.3 5.7<br />
Federal Sources 2.4 3.3 3.4 3.9<br />
Other Financing Sources 0.3 0.2 0.1 0.2<br />
Source:<br />
Notes:<br />
<strong>Iowa</strong> Department <strong>of</strong> Education, Division <strong>of</strong> Financial and Information Services, Certified Annual<br />
Financial Reports.<br />
Interagency includes revenues from services provided to other LEAs such as tuition, transportation<br />
services, and other purchased services.<br />
Intermediate sources include grants-in-aid revenues in lieu <strong>of</strong> taxes received from AEAs, cities<br />
and counties.<br />
Other local sources include interest, textbook sales, rents and fines, student fees, and community<br />
service fees.<br />
Other financing sources include the proceeds from long-term debt such as loans, capital leases<br />
and insurance settlements for loss <strong>of</strong> fixed assets.<br />
Totals may not equal 100 percent due to rounding.<br />
The three largest sources <strong>of</strong> general fund revenue are local taxes, state foundation aid and other<br />
state sources. Figure 142 examines changes in these revenue sources for past years. Total state aid<br />
is the combination <strong>of</strong> state foundation aid and other state sources and accounted for 56.3 percent<br />
<strong>of</strong> the total general fund revenue for schools in 2001-2002. This was the lowest percentage <strong>of</strong> total<br />
state aid since the 1995-1996 school year when total state aid was 55.3 percent <strong>of</strong> total general fund<br />
revenue. Local tax as a percentage <strong>of</strong> total general fund revenues has increased for two consecutive<br />
years, moving from 31.6 percent in 1999-2000 to 32.8 percent in 2001-2002.<br />
Figure 142<br />
PERCENT OF TOTAL GENERAL FUND REVENUES FROM LOCAL TAXES, STATE<br />
FOUNDATION AID, AND TOTAL STATE AID IN IOWA PUBLIC SCHOOLS<br />
1985-1986 AND 1994-1995 TO 2001-2002<br />
Percent<br />
100<br />
90<br />
80<br />
70<br />
60<br />
50<br />
40<br />
30<br />
20<br />
10<br />
0<br />
Total <strong>State</strong> Aid<br />
Local Taxes<br />
<strong>State</strong> Foundation Aid<br />
56.3 55.3<br />
58.6 58.2 57.4 58.2 57.6 56.3<br />
46.7<br />
46.0 51.9<br />
50.9<br />
53.3 53.1 52.4 52.9 52.3 50.6<br />
47.3<br />
35.4 35.8<br />
32.4 32.6 33.2 31.6 32.0 32.8<br />
1985-86 1994-95 1995-96 1996-97 1997-98 1998-99 1999-00 2000-01 2001-02<br />
Year<br />
268<br />
Source:<br />
<strong>Iowa</strong> Department <strong>of</strong> Education, Division <strong>of</strong> Financial and Information Services, Certified Annual<br />
Financial Reports.
Table 159 and Figure 142 provide information regarding the source <strong>of</strong> general fund revenues<br />
by enrollment category for 2001-2002. Of all the enrollment categories, the less than 250<br />
students has the largest percentage <strong>of</strong> revenues from local taxes (39.9 percent) and the lowest<br />
percentage <strong>of</strong> state foundation aid (36.4 percent). The three largest enrollment categories had<br />
state foundation aid percentages greater than the state average <strong>of</strong> 50.6 percent. Other state<br />
sources ranged from 7.3 percent in the less than 250 students enrollment category to 5.3<br />
percent in the 2,500-7,499 enrollment category.<br />
The percentage <strong>of</strong> total state aid (state foundation aid plus other state sources) remains above<br />
the percentage <strong>of</strong> local taxes for all enrollment categories. Figure 143 details the difference<br />
between total state aid and local tax by enrollment category. A trend beginning at the less than<br />
250 enrollment category and continuing to the 1,000-2,499 enrollment category shows that<br />
as the districts get larger, the gap between the percentage <strong>of</strong> revenues from local tax and the<br />
percentage from total state aid widens.<br />
Table 159<br />
REVENUES BY SOURCE AS A PERCENT OF TOTAL GENERAL FUND<br />
REVENUES IN IOWA PUBLIC SCHOOLS<br />
2001-2002<br />
Enrollment Category<br />
Source <strong>of</strong> Revenue
Figure 143<br />
PERCENT OF TOTAL GENERAL FUND REVENUES FROM LOCAL<br />
TAXES AND TOTAL STATE AID IN IOWA PUBLIC SCHOOLS<br />
BY ENROLLMENT CATEGORY<br />
2001-2002<br />
100<br />
90<br />
80<br />
Local Taxes, <strong>State</strong> = 32.8%<br />
Total <strong>State</strong> Aid, <strong>State</strong> = 56.3%<br />
Percent<br />
70<br />
60<br />
50<br />
40<br />
30<br />
20<br />
43.7<br />
39.9<br />
50.7<br />
52.8 54.6<br />
35.7 35.0 34.4<br />
57.9 57.3 57.6<br />
31.3 33.0 31.6<br />
10<br />
0<br />
Figure 144<br />
IOWA AVERAGE TAXABLE VALUATION PER PUPIL<br />
1995-1996 TO 2003-2004<br />
Taxable Valuation Per Pup<br />
$250,000<br />
$200,000<br />
$150,000<br />
$100,000<br />
$50,000<br />
$156,840<br />
$157,441<br />
$160,950<br />
$169,138<br />
$177,088<br />
$185,750<br />
$195,630<br />
$202,844<br />
$208,711<br />
$0<br />
1995-96 1996-97 1997-98 1998-99 1999-00 2000-01 2001-02 2002-03 2003-04<br />
Year<br />
Source:<br />
Note:<br />
<strong>Iowa</strong> Department <strong>of</strong> Management, School Budget Master Files.<br />
Per pupil amounts are based on budget enrollments.<br />
As seen in Table 160, per pupil taxable valuations remain highest in the less than 250 enrollment<br />
category in 2003-2004. The less than 250 enrollment category had a per pupil taxable valuation<br />
<strong>of</strong> $331,663 which was an increase <strong>of</strong> 36.1 percent over 2003-2004. The largest enrollment<br />
category continued to have the lowest taxable valuation per pupil in 2003-2004 at $191,431.<br />
Enrollment categories with less than 1,000 students all had average taxable valuations per pupil<br />
greater than the state average <strong>of</strong> $208,711 for all years shown. They also had percentage changes<br />
greater than the state average <strong>of</strong> 23.4 percent for 2003-2004. Enrollment categories with 1,000<br />
students or greater each had average per pupil taxable valuations less than the state average for all<br />
years shown. The range between taxable valuations per pupil in 1998-1999 by enrollment category<br />
was $85,520 and had increased to $140,232 in 2003-2004, an increase <strong>of</strong> 64.0 percent.<br />
Table 160<br />
IOWA AVERAGE TAXABLE VALUATION<br />
PER PUPIL BY ENROLLMENT CATEGORY<br />
1998-1999 TO 2003-2004<br />
Per Pupil Taxable Valuation<br />
% Increase<br />
1998-1999<br />
Enrollment Year to<br />
Category 1998-1999 1999-2000 2000-2001 2001-2002 2002-2003 2003-2004 2003-2004<br />
Taxable valuations per pupil vary within enrollment categories. Table 161 provides information<br />
pertaining to the minimum and maximum taxable valuations per pupil within each enrollment<br />
category. The maximum value ($632,888 in 2003-2004) for all school districts is in the less than<br />
250 enrollment category. That enrollment category has the state maximum for all years shown.<br />
The ratio <strong>of</strong> the highest valuation per pupil district to the lowest valuation per pupil district is<br />
approximately 6.1 to 1 for 2003-2004. The district with the lowest taxable valuation per pupil was<br />
in the 400-599 enrollment category with a value <strong>of</strong> $103,847 for 2003-2004. That enrollment<br />
category continued to have the greatest ratio <strong>of</strong> maximum to minimum at 4.2 to 1. The statewide<br />
ratio <strong>of</strong> maximum to minimum in 1990-1991 was 6.8 to 1. That figure decreased to 6.1 to 1 in 2003-<br />
2004.<br />
Table 161<br />
NET TAXABLE VALUATIONS PER<br />
BUDGET ENROLLMENT<br />
1990-1991 AND 2000-2001 TO 2003-2004<br />
Enrollment 1990-1991 2000-2001 2001-2002 2002-2003 2003-2004<br />
Category Minimum Maximum Minimum Maximum Minimum Maximum Minimum Maximum Minimum Maximum<br />
Table 162<br />
AVERAGE GENERAL FUND PER PUPIL EXPENDITURES<br />
FOR IOWA PUBLIC SCHOOLS BY ENROLLMENT CATEGORY<br />
1985-1986, AND 1997-1998 THROUGH 2001-2002<br />
Enrollment<br />
Category 1985-1986 1997-1998 1998-1999 1999-2000 2000-2001 2001-2002<br />
Figure 145<br />
IOWA AND MIDWEST STATES PUBLIC SCHOOL<br />
AVERAGE PER PUPIL EXPENDITURES<br />
1985-1986 AND 2001-2002<br />
Per Pupil Expenditures<br />
$10,000<br />
$9,000<br />
$8,000<br />
$7,000<br />
$6,000<br />
$5,000<br />
$4,000<br />
$3,000<br />
$2,794<br />
$6,759<br />
1985-86 2001-02<br />
$2,908<br />
$6,540<br />
$3,101<br />
$6,811<br />
$3,301<br />
$8,914<br />
$3,357<br />
$6,819<br />
$3,481<br />
$7,548<br />
$3,573<br />
$7,354<br />
$3,766<br />
$7,567<br />
$3,878<br />
$8,604<br />
$2,000<br />
$1,000<br />
$0<br />
Missouri<br />
South<br />
Dakota<br />
Nebraska Illinois <strong>Iowa</strong><br />
Nation Kansas Minnesota Wisconsin<br />
<strong>State</strong><br />
Source:<br />
National Education Association, Ranking <strong>of</strong> the <strong>State</strong>s and Estimates <strong>of</strong> School Statistics.<br />
<strong>State</strong> Aid<br />
School districts receive state aid through appropriations made from the state’s general fund<br />
each year. <strong>State</strong> aid programs for schools include School Foundation Aid, Educational<br />
Excellence, Instructional Support, Class Size Reduction, and Student Achievement/Teacher<br />
Quality. Funding for Technology/School Improvement which ended in 2001-2002 and<br />
funding for Phase III <strong>of</strong> Educational Excellence which was discontinued in 2003-2004 are<br />
included for years applicable. <strong>State</strong> aid to districts totaled $1,963.5 million and accounted for<br />
43.1 percent <strong>of</strong> the total general fund appropriations in 2003-2004. Table 164 provides<br />
information on state aid funding to school districts and overall general fund appropriations<br />
from 1981-1982 through 2003-2004.<br />
<strong>State</strong> aid amounts were impacted in 1996-1997 and 1999-2000 due to legislative action. In<br />
1996-1997, the state foundation level was increased from 83.0 percent to 87.5 percent. In<br />
1999-2000, the special education foundation level was increased from 79.0 percent to 87.5<br />
percent. These foundation level changes did not increase school district budgets; however,<br />
they increased the amount <strong>of</strong> state aid and lowered the amount <strong>of</strong> property tax.<br />
Other changes in recent years include the following: a 4.3 percent reduction ($77.5 million)<br />
to the 2001-2002 <strong>State</strong> Foundation Aid amount; the establishment <strong>of</strong> the Student Achievement/<br />
Teacher Quality Program in 2001-2002 ($40.0 million); a non-general fund appropriation <strong>of</strong><br />
$45.0 million in 2002-2003 for <strong>State</strong> Foundation Aid; and a reduction <strong>of</strong> $13.5 million in<br />
<strong>State</strong> Foundation Aid which was the difference between the appropriated aid amount and the<br />
amount needed to fully fund <strong>State</strong> Foundation Aid in 2002-2003.<br />
274
Table 164<br />
TOTAL IOWA GOVERNMENT APPROPRIATIONS<br />
(IN MILLIONS)<br />
1981-1982 TO 2003-2004<br />
<strong>State</strong> Aid General Fund Percent Spent<br />
Year to Districts Appropriations on Education<br />
2003-2004 $1,963.5 $4,562.4 43.0%<br />
2002-2003 1,936.0 4,468.8 43.3<br />
2001-2002 1,900.8 4,610.3 41.2<br />
2000-2001 1,893.0 4,880.1 38.8<br />
1999-2000 1,840.3 4,786.6 38.4<br />
1998-1999 1,739.7 4,522.0 38.5<br />
1997-1998 1,686.0 4,359.9 38.7<br />
1996-1997 1,615.8 4,122.2 39.2<br />
1995-1996 1,425.5 3,842.0 37.1<br />
1994-1995 1,360.5 3,615.6 37.6<br />
1993-1994 1,324.8 3,471.7 38.2<br />
1992-1993 1,273.1 3,394.3 37.5<br />
1991-1992 1,185.4 3,178.8 37.3<br />
1990-1991 1,147.7 3,130.9 36.7<br />
1989-1990 1,047.8 2,853.4 36.7<br />
1988-1989 964.1 2,667.5 36.1<br />
1987-1988 905.7 2,422.3 37.4<br />
1986-1987 761.1 2,190.2 34.8<br />
1985-1986 712.3 2,207.0 32.3<br />
1984-1985 708.5 2,088.6 33.9<br />
Source:<br />
Note:<br />
1983-1984 660.3 1,976.6 33.4<br />
1982-1983 642.3 1,870.9 34.3<br />
1981-1982 621.0 1,762.6 35.2<br />
Legislative Fiscal Bureau, Session Fiscal Report.<br />
Includes school foundation aid, educational excellence, instructional support, technology/school<br />
improvement, class size reduction/school improvement, and teacher quality/compensation<br />
appropriations.<br />
Finance<br />
275
Property Taxes<br />
Table 165 displays the average general fund levy and management levy by enrollment class<br />
for 2003-2004. <strong>State</strong>wide, the average general fund levy was $11.6991 per $1,000 per taxable<br />
valuation. Average rates varied across enrollment categories with the highest average rate in<br />
the 7,500+ enrollment category and the lowest average rate in the 400-599 enrollment<br />
category. All 370 districts levy for the general fund.<br />
There is no restriction on the management levy rate, however the purpose for which proceeds<br />
may be used is restricted. The management levy may be used for paying tort claims, insurance<br />
premiums (except health insurance), unemployment benefits, and the cost <strong>of</strong> retirement<br />
benefits. In 2003-2004, seven districts began use <strong>of</strong> the management levy increasing the total<br />
number <strong>of</strong> districts to 364 (98.4 percent). The average statewide management levy rate was<br />
$0.74827 per $1,000 <strong>of</strong> taxable valuation in 2003-2004. The three largest enrollment<br />
categories had 100.0 percent participation in the use <strong>of</strong> the management levy.<br />
Table 165<br />
PROPERTY TAX RATES AND NUMBER OF DISTRICTS LEVYING PROPERTY<br />
TAXES FOR THE GENERAL FUND AND MANAGEMENT FUND FOR THE<br />
2003-2004 YEAR BY ENROLLMENT CATEGORY<br />
General Fund Levy<br />
Management Levy<br />
Number Average Number <strong>of</strong> Percent <strong>of</strong> Average<br />
Enrollment <strong>of</strong> Tax Districts Districts Tax<br />
Category Districts Rate with Levy with Levy Rate<br />
Of the 370 school districts in 2003-2004, 361 (97.6 percent) levied the Regular PPEL. Three<br />
enrollment categories (less than 250, 2,500-7,499, and 7,500+) had 100 percent participation<br />
using the Regular PPEL and the other four enrollment categories were over 96.0 participation.<br />
The voter-approved PPEL was levied by 274 districts (74.1 percent) during 2003-2004. The<br />
three largest enrollment categories had the greatest participation with each over 83.0 percent.<br />
The 600-999 enrollment category had the lowest percentage <strong>of</strong> participation at 64.3 percent.<br />
The 2,500-7,499 enrollment category had an average voter-approved PPEL rate <strong>of</strong> $0.91431<br />
per $1,000 <strong>of</strong> taxable valuation <strong>of</strong> all the enrollment categories. The state average <strong>of</strong> the voterapproved<br />
PPEL rate was $0.75762 in 2003-2004, an increase <strong>of</strong> almost two cents per $1,000<br />
<strong>of</strong> taxable valuation (2.6 percent) from the previous year (Table 166).<br />
Table 166<br />
PROPERTY TAX RATES AND NUMBER OF DISTRICTS LEVYING<br />
PROPERTY TAXES FOR THE REGULAR PHYSICAL PLANT<br />
AND EQUIPMENT LEVY AND THE VOTER-APPROVED<br />
PHYSICAL PLANT AND EQUIPMENT LEVY FOR THE<br />
2003-2004 YEAR BY ENROLLMENT CATEGORY<br />
Regular PPEL<br />
Voter-Approved PPEL<br />
Number Number <strong>of</strong> Percent <strong>of</strong> Average Number <strong>of</strong> Percent <strong>of</strong> Average<br />
Enrollment <strong>of</strong> Districts Districts Tax Districts Districts Tax<br />
Category Districts with Levy with Levy Rate with Levy with Levy Rate<br />
Table 167 provides total property tax information pertaining to the Public Education and<br />
Recreation Levy (PERL - also known as playground equipment and recreation levy) and the<br />
debt services levy by enrollment category for the 2003-2004 school year.<br />
The number <strong>of</strong> school districts that levied for the PERL totaled 22 (5.9 percent) in 2003-2004.<br />
The 7,500+ enrollment category had the highest percentage <strong>of</strong> districts (22.2 percent) that<br />
levied for the PERL. The 400-599 enrollment category had 2 <strong>of</strong> 79 (2.5 percent) districts that<br />
levied for the PERL during the 2003-2004 school year, the lowest percentage among all<br />
enrollment categories. The maximum rate for the PERL is $0.135 per $1,000 <strong>of</strong> taxable<br />
valuation.<br />
Of the 370 school districts, 217 (58.6 percent) levied for debt services with an average levy<br />
rate <strong>of</strong> $1.40910 per $1,000 <strong>of</strong> taxable valuation in 2003-2004. The number <strong>of</strong> districts that<br />
levied for debt service remained the same from 2002-2003, however the average levy rate<br />
decreased by nearly seven cents (4.6 percent) per $1,000 <strong>of</strong> taxable valuation. The 1,000-<br />
2,499 enrollment category had 78.5 percent <strong>of</strong> districts that levied for debt services, the<br />
highest across enrollment categories. On average, districts in the largest enrollment category<br />
(7,500+) had the lowest average debt services tax rate at $0.66002 per $1,000 <strong>of</strong> taxable<br />
valuation. Districts in the 400-599 enrollment category had an average debt services tax rate<br />
<strong>of</strong> $2.24066 per $1,000 <strong>of</strong> taxable valuation, nearly 3.4 times the amount <strong>of</strong> the districts in<br />
the largest enrollment category.<br />
Table 167<br />
TOTAL PROPERTY TAXES FOR THE PUBLIC EDUCATION AND RECREATION<br />
AND DEBT SERVICES LEVIES BY ENROLLMENT CATEGORY<br />
2003-2004<br />
PERL Levy<br />
Debt Service Levy<br />
Number Number <strong>of</strong> Percent <strong>of</strong> Average Number <strong>of</strong> Percent <strong>of</strong> Average<br />
Enrollment <strong>of</strong> Districts Districts Tax Districts Districts Tax<br />
Category Districts with Levy with Levy Rate with Levy with Levy Rate<br />
The total amount <strong>of</strong> property taxes (including estimated utility replacement excise tax) and<br />
income surtax for school districts general fund and the total property tax levied for the<br />
management fund are shown in Table 168. Taxes included in school district’s general fund<br />
include property tax for school foundation aid, instructional support property tax and income<br />
surtax, and educational improvement property tax and income surtax.<br />
In general, total school district general fund taxes increased with enrollment category size<br />
with a state total <strong>of</strong> $1,236.2 million. Income surtax accounted for 3.8 percent <strong>of</strong> the total<br />
general fund tax in 2003-2004, while property tax accounted for the remaining 96.2 percent.<br />
Districts in the smallest enrollment category had an average combined total general fund tax<br />
amount per pupil <strong>of</strong> $3,905, nearly $800 higher than the second highest amount <strong>of</strong> $3,109 in<br />
the 250-399 enrollment category. Enrollment categories with districts <strong>of</strong> more than 1,000<br />
students each had an average combined total general fund tax amount per pupil below the state<br />
average <strong>of</strong> $2,538 in 2003-2004.<br />
The total amount levied for the management fund was $75.5 million in 2003-2004. On<br />
average, districts in the less than 250 enrollment category had an average management fund<br />
property tax amount per pupil <strong>of</strong> $183 and districts in the 7,500+ enrollment category had an<br />
average management fund property tax amount per pupil <strong>of</strong> $192, both above the state<br />
average <strong>of</strong> $156 per pupil. All other enrollment categories were below the state average per<br />
pupil amount.<br />
Table 168<br />
TOTAL PROPERTY TAXES AND ESTIMATED UTILITY REPLACEMENT<br />
EXCISE TAX AND INCOME SURTAXES FOR THE<br />
GENERAL FUND PROPERTY TAXES FOR THE<br />
MANAGEMENT FUND AND AVERAGE AMOUNT PER PUPIL<br />
BY ENROLLMENT CATEGORY 2003-2004<br />
General Fund<br />
Management Fund<br />
Number Average Number <strong>of</strong> Average<br />
Enrollment <strong>of</strong> Property Income Combined Districts Property Property Tax<br />
Category Districts Tax Surtax Total Per Pupil With Levy Tax Per Pupil<br />
Total taxes for the regular and voter-approved physical plant and equipment levy (PPEL) and<br />
average amounts per pupil for 2003-2004 are shown in Table 169 for each enrollment category<br />
and the state. The state property tax total for the regular PPEL was $34.6 million with an<br />
average amount per pupil <strong>of</strong> $72. The smallest enrollment category had the highest average<br />
per pupil regular PPEL with $110. The largest enrollment category had the lowest average per<br />
pupil regular PPEL amount with $67.<br />
The voter-approved PPEL may be funded through property tax and income surtax and totaled<br />
$73.9 million in 2003-2004. Income surtax accounted for $7.4 million (10.1 percent) while<br />
property tax accounted for $66.4 million (89.9 percent) <strong>of</strong> the total voter-approved PPEL.<br />
Districts in the largest enrollment category received 100 percent <strong>of</strong> the voter-approved PPEL<br />
through property tax. The voter-approved PPEL average tax per pupil varied across enrollment<br />
categories. On average, districts in the less than 250 enrollment category had the highest<br />
average tax per pupil with $238 while districts in the 7,500+ enrollment category had the<br />
lowest average per pupil with $167. Two (7,500+ and 1,000-2,499) <strong>of</strong> the seven enrollment<br />
categories had per pupil averages below the state average while the other five were greater than<br />
the state average per pupil.<br />
Table 169<br />
TOTAL PROPERTY TAXES AND ESTIMATED UTILITY REPLACEMENT<br />
EXCISE TAX AND INCOME SURTAXES FOR THE REGULAR AND<br />
VOTER-APPROVED PHYSICAL PLANT AND EQUIPMENT LEVY<br />
BY ENROLLMENT CATEGORY, 2003-2004<br />
Regular PPEL<br />
Voter-Approved PPEL Levy<br />
Number Number Average Number Average<br />
Enrollment <strong>of</strong> <strong>of</strong> Districts Property Per <strong>of</strong> Districts Property Income Per<br />
Category Districts with Levy Tax Pupil with Levy Tax Surtax Total Pupil<br />
The total amount <strong>of</strong> property tax generated from the debt service levy decreased by $3.1<br />
million between 2002-2003 and 2003-2004. The state debt service levy per pupil was $314<br />
with a total debt service levy <strong>of</strong> $102.4 million in 2003-2004. The 7,500+ enrollment<br />
category had the lowest debt service levy per pupil with $139 and was the only enrollment<br />
category below the state average. The 400-599 enrollment category had the highest at $518<br />
per pupil.<br />
Table 170<br />
TOTAL PROPERTY TAXES AND ESTIMATED UTILITY REPLACEMENT<br />
EXCISE TAXES FOR THE PUBLIC EDUCATION AND RECREATION,<br />
DEBT SERVICES LEVIES, AND AVERAGE AMOUNT PER PUPIL BY<br />
ENROLLMENT CATEGORY, 2003-2004<br />
PERL Levy<br />
Debt Service Levy<br />
Number Number <strong>of</strong> Average Number <strong>of</strong> Average<br />
Enrollment <strong>of</strong> Districts Property Per Districts Property Per<br />
Category Districts with Levy Tax Pupil with Levy Tax Pupil<br />
through 2003-2004, two enrollment categories (1,000-2,499 and 2,500-7,499) were below the<br />
state average <strong>of</strong> income surtax per budget enrollment while the other enrollment categories were<br />
at or above the state average (Table 171).<br />
Table 171<br />
NUMBER AND PERCENT OF DISTRICTS WITH INCOME SURTAXES,<br />
SURTAX PER PUPIL, AND AVERAGE SURTAX RATES BY ENROLLMENT CATEGORY<br />
1990-1991, 1995-1996, AND 2000-2001 TO 2003-2004<br />
Enrollment Category<br />
250 400 600 1,000 2,500<br />
1990-1991
Instructional Support<br />
The instructional support program provides additional funding to a district and must be<br />
approved through board action or referendum. If the instructional support program is<br />
approved through a referendum, it may be imposed for up to ten years. Board enactment will<br />
allow the program to be in place for up to five years. The maximum amount that a budget may<br />
be increased through the instructional support program is 10 percent <strong>of</strong> the district’s regular<br />
program cost. Once the program is enacted, districts receive state aid to fund a portion <strong>of</strong> the<br />
program and fund the remaining portion <strong>of</strong> the program through a property tax and if<br />
approved, income surtax.<br />
Tables 172 and 173 and Figures 146 and 147 provide information detailing the distribution<br />
<strong>of</strong> state aid, property tax, and income surtax for the instructional support program for 1991-<br />
1992 through 2003-2004. <strong>State</strong> aid has been frozen at $14.8 million since 1992-1993 and<br />
continues to decrease as a portion <strong>of</strong> the total program funding as more districts enact the<br />
instructional support program (Table 172). In 1991-1992, state aid accounted for 26.3 percent<br />
<strong>of</strong> the instructional support program revenues. That percentage had decreased to 11.0 percent<br />
in 2003-2004 (Table 173). Income surtax as a percentage <strong>of</strong> total program revenues and the<br />
dollar amount from income surtax declined for only the second time for the 13 school years<br />
shown. Property tax revenue increased for every year shown and the percentage <strong>of</strong> property<br />
tax revenue to total instructional support revenue increased in 2003-2004 for the first time<br />
since 2000-2001.<br />
Table 172<br />
INSTRUCTIONAL SUPPORT PROGRAM BY REVENUE SOURCE<br />
PROPERTY TAX, INCOME SURTAX, AND STATE AID<br />
1991-1992 TO 2003-2004<br />
School Year Property Tax Income Surtax <strong>State</strong> Aid Total<br />
2003-2004 $73,189,750 $46,888,458 $14,798,227 $134,876,408<br />
2002-2003 67,852,553 47,141,637 14,798,227 129,792,417<br />
2001-2002 63,925,572 42,063,966 14,798,227 120,787,765<br />
2000-2001 58,678,106 36,273,229 14,798,227 109,749,562<br />
1999-2000 50,360,669 38,144,264 14,798,227 103,303,156<br />
1998-1999 49,381,901 33,770,990 14,798,227 97,951,116<br />
1997-1998 45,836,992 31,165,860 14,798,227 91,801,074<br />
1996-1997 43,266,948 24,605,939 14,798,227 82,671,109<br />
1995-1996 41,057,909 20,334,907 14,798,227 76,191,036<br />
1994-1995 37,824,551 18,661,622 14,798,227 71,284,400<br />
Finance<br />
1993-1994 33,179,223 16,612,565 14,798,227 64,590,015<br />
1992-1993 29,480,409 14,787,371 14,798,225 59,066,005<br />
1991-1992 24,396,419 10,610,537 12,507,656 47,514,612<br />
Source:<br />
<strong>Iowa</strong> Department <strong>of</strong> Management, Master Budget Files.<br />
283
Figure 146<br />
INSTRUCTIONAL SUPPORT PROGRAM REVENUES<br />
1991-1992 TO 2003-2004<br />
$160,000,000<br />
$140,000,000<br />
$120,000,000<br />
$100,000,000<br />
Property Tax<br />
<strong>State</strong> Aid<br />
Income Surtax<br />
Total<br />
Amount<br />
$80,000,000<br />
$60,000,000<br />
$40,000,000<br />
$20,000,000<br />
$0<br />
1991-<br />
92<br />
1992-<br />
93<br />
1993-<br />
94<br />
1994-<br />
95<br />
1995-<br />
96<br />
1996-<br />
97<br />
1997-<br />
98<br />
1998-<br />
99<br />
1999-<br />
00<br />
2000-<br />
01<br />
2001-<br />
02<br />
2002-<br />
03<br />
2003-<br />
04<br />
School Year<br />
Source:<br />
Department <strong>of</strong> Management, Annual Aid and Levy Worksheets.<br />
Table 173<br />
PERCENT DISTRIBUTION OF<br />
INSTRUCTIONAL SUPPORT PROGRAM REVENUES<br />
1991-1992 TO 2003-2004<br />
School Percent Percent Percent<br />
Year Property Tax Income Surtax <strong>State</strong> Aid<br />
2003-2004 54.3% 34.8% 11.0%<br />
2002-2003 52.3 36.3 11.4<br />
2001-2002 52.9 34.8 12.3<br />
2000-2001 53.5 33.1 13.5<br />
1999-2000 48.8 36.9 14.3<br />
1998-1999 50.4 34.5 15.1<br />
1997-1998 49.9 34.0 16.1<br />
1996-1997 52.3 29.8 17.9<br />
1995-1996 53.9 26.7 19.4<br />
1994-1995 53.1 26.2 20.8<br />
1993-1994 51.4 25.7 22.9<br />
1992-1993 49.9 25.0 25.1<br />
1991-1992 51.4 22.3 26.3<br />
Source:<br />
<strong>Iowa</strong> Department <strong>of</strong> Management, Annual Aid and Levy Worksheets.<br />
284
Figure 147<br />
PERCENT DISTRIBUTION OF<br />
INSTRUCTIONAL SUPPORT PROGRAM REVENUES<br />
1991-1992 TO 2003-2004<br />
100<br />
90<br />
80<br />
Revenue Source<br />
Property Tax<br />
Income Surtax<br />
<strong>State</strong> Aid<br />
70<br />
60<br />
Percent<br />
50<br />
40<br />
30<br />
20<br />
10<br />
0<br />
1991-<br />
92<br />
1992-<br />
93<br />
1993-<br />
94<br />
1994-<br />
95<br />
1995-<br />
96<br />
1996-<br />
97<br />
1997-<br />
98<br />
1998-<br />
99<br />
1999-<br />
00<br />
2000-<br />
01<br />
2001-<br />
02<br />
2002-<br />
03<br />
2003-<br />
04<br />
School Year<br />
Source:<br />
Finance<br />
<strong>Iowa</strong> Department <strong>of</strong> Management, Annual Aid and Levy Worksheets.<br />
The number <strong>of</strong> school districts that enacted the instructional support program has increased<br />
more than tw<strong>of</strong>old, from 156 in 1991-1992 to 318 in 2003-2004. Table 174 displays<br />
instructional support program by enrollment category and the state for 1991-1992, 1995-<br />
1996, and 2001-2002 through 2003-2004. Districts within the smallest and largest enrollment<br />
categories had 100 percent participation in the instructional support program for the last two<br />
school years. All enrollment categories had over 76 percent participation for the last two<br />
school years. In 1991-1992, no enrollment category had over 50 percent participation in the<br />
instructional support program. The percentage <strong>of</strong> districts that enacted the program has<br />
increased from 36.7 percent in 1991-1992 to 86.0 percent in 2003-2004.<br />
285
Table 174<br />
INSTRUCTIONAL SUPPORT PROGRAM BY<br />
ENROLLMENT CATEGORY<br />
1991-1992, 1995-1996 AND 2001-2002 TO 2003-2004<br />
Enrollment Category<br />
250 400 600 1,000 2,500<br />
Budget Guarantee<br />
The number <strong>of</strong> school districts that received the budget guarantee in 2003-2004 decreased for the<br />
first time since 1996-1997. Although the number <strong>of</strong> districts that received the budget guarantee<br />
declined by 14 from 2002-2003 to 231, the total was still twice as many as the 2001-2002 amount<br />
<strong>of</strong> 115 districts (see Figure 148 and Table 175). The total budget guarantee amount decreased<br />
slightly from $27.8 million in 2002-2003 to $27.4 million in 2003-2004. Although the total<br />
budget guarantee amount decreased slightly, the average per pupil amount for districts that<br />
received the budget guarantee increased from $106 in 2002-2003 to $157 in 2003-2004. A reason<br />
for the large increase in the average per pupil between 2002-2003 and 2003-2004 could be that<br />
there were four districts in the 7,500+ enrollment category that received the budget guarantee in<br />
2002-2003 and none in 2003-2004.<br />
Table 175<br />
NUMBER AND PERCENT OF DISTRICTS RECEIVING A BUDGET GUARANTEE AND<br />
PER PUPIL AMOUNT OF THE GUARANTEE BY ENROLLMENT CATEGORY<br />
1992-1993, AND 2001-2002 TO 2003-2004<br />
250<br />
Enrollment Category<br />
400 600 1,000 2,500<br />
Figure 148<br />
NUMBER AND PERCENT OF IOWA PUBLIC SCHOOL DISTRICTS<br />
WITH BUDGET GUARANTEE<br />
1992-1993 TO 2003-2004<br />
300<br />
66.0%<br />
62.4%<br />
70.0%<br />
250<br />
60.0%<br />
50.0%<br />
200<br />
Number <strong>of</strong> Districts<br />
150<br />
100<br />
37.6%<br />
28.7%<br />
23.3%<br />
17.2%<br />
14.2%<br />
15.1%<br />
16.8%<br />
28.3%<br />
28.3%<br />
31.0%<br />
40.0%<br />
30.0%<br />
20.0%<br />
Percent <strong>of</strong> Districts<br />
50<br />
10.0%<br />
0<br />
1992-93 1993-94 1994-95 1995-96 1996-97 1997-98 1998-99 1999-00 2000-01 2001-02 2002-03 2003-04<br />
Year<br />
0.0%<br />
Source:<br />
<strong>Iowa</strong> Department <strong>of</strong> Management, Master Budget Files.<br />
288
Figure 149 displays the trend by enrollment category <strong>of</strong> the percentage <strong>of</strong> districts that received<br />
the budget guarantee for the years 1992-1993 and 2001-2002 through 2003-2004. Most <strong>of</strong> the<br />
enrollment categories and the state have had substantial increases in the percentage <strong>of</strong> districts<br />
receiving the budget guarantee since 1992-1993. The less than 250 enrollment category has<br />
increased 9.5 percentage points and the 7,500+ enrollment category has decreased 11.1 percentage<br />
points since 1992-1993. All other enrollment categories have increased at least 23.0 percentage<br />
points since 1992-1993 and overall, the state has increased 24.8 percentage points in that period.<br />
Figure 149<br />
PERCENT OF DISTRICTS RECEIVING A BUDGET GUARANTEE<br />
BY ENROLLMENT CATEGORY<br />
1992-1993 AND 2001-2002 TO 2003-2004<br />
100<br />
90<br />
80<br />
73.8<br />
80.0<br />
86.2<br />
83.3<br />
74.0<br />
92.7<br />
75.3<br />
72.2<br />
Year<br />
1992-1993<br />
2001-2002<br />
2002-2003<br />
2003-2004<br />
70<br />
66.0<br />
60<br />
60.8<br />
58.5<br />
61.0<br />
58.2<br />
60.5<br />
49.0<br />
22.1<br />
22.9<br />
62.4<br />
40.9<br />
Percent<br />
50<br />
48.1<br />
44.0<br />
44.4<br />
40<br />
37.6<br />
30<br />
29.2<br />
31.0<br />
20<br />
10<br />
0<br />
13.0<br />
11.9<br />
4.4<br />
0.0<br />
11.1<br />
11.1<br />
0.0<br />
Bond Elections<br />
The number <strong>of</strong> districts attempting bond referendums by the percent <strong>of</strong> yes votes by enrollment<br />
category is displayed in Table 176. Bond referendums require a “super-majority” <strong>of</strong> at least<br />
60.0 percent to be approved. In 2001-2002, 35 attempts were made by districts to receive voter<br />
approval to issue long-term bonded indebtedness. Seventeen (48.6 percent) <strong>of</strong> those attempts were<br />
approved by the voters, nine (25.7 percent) attempts received over 50.0 percent but less than the<br />
super majority, and the other nine attempts received less than 50.0 percent. No bond referendums<br />
were attempted by districts in the less than 250 enrollment category and the 7,500+ enrollment<br />
category. In 1985-1986, ten bond elections were attempted with four elections being successful.<br />
Table 176<br />
NUMBER OF DISTRICTS ATTEMPTING BOND REFERENDUMS BY<br />
PERCENT OF YES VOTES BY ENROLLMENT CATEGORY<br />
1985-1986, 1999-2000 AND 2001-2002<br />
Enrollment Categories<br />
250 400 600 1,000 2,500<br />
1985-1986<br />
The number <strong>of</strong> districts attempting voter-approved physical plant and equipment referendums<br />
is shown in Table 177. This is the first year this data has been collected and displayed in this<br />
report. The voter-approved physical plant and equipment referendum requires 50 percent<br />
approval to be approved. In 2001-2002, 37 voter-approved physical plant and equipment<br />
referendums were attempted and 29 (78.4 percent) were approved. Districts within less than<br />
250 and 7,500+ enrollment categories did not attempt any voter-approved physical plant and<br />
equipment referendums.<br />
Table 177<br />
NUMBER OF DISTRICTS ATTEMPTING VOTER-APPROVED<br />
PHYSICAL PLANT AND EQUIPMENT REFERENDUMS BY<br />
PERCENT OF YES VOTES BY ENROLLMENT CATEGORY<br />
2001-2002<br />
Enrollment Categories<br />
250 400 600 1,000 2,500<br />
1999-2000<br />
Table 178<br />
LOCAL OPTION SALES AND SERVICES TAX FOR<br />
SCHOOL INFRASTRUCTURE<br />
1998-1999 TO 2003-2004<br />
1998- 1999- 2000- 2001- 2002- 2003-<br />
1999 2000 2001 2002 2003 2004<br />
Number <strong>of</strong> Counties<br />
with the Tax 3 9 15 17 24 42*<br />
Number <strong>of</strong> Districts<br />
Partly, or Wholly<br />
Located in those Counties 28 70 110 127 161 240<br />
Resident Budget Enrollment<br />
in those Counties 28,858.0 91,889.1 171,150.6 182,218.9 214,969.4 294,931.3<br />
Estimated Revenues $9,764,643 $50,545,552 $122,683,313 $131,695,789 $148,882,834 $192,148,478<br />
Percent <strong>of</strong> Counties<br />
Participating 3.0% 9.1% 15.2% 17.2% 24.2% 42.4%<br />
Percent <strong>of</strong> Districts Located<br />
Partly or Wholly in<br />
Participating Counties 7.5% 18.7% 29.4% 34.3% 43.4% 64.9%<br />
Percent <strong>of</strong> Budget Enrollment<br />
Residing in Participating<br />
Counties 5.7% 18.3% 34.3% 36.9% 43.9% 60.6%<br />
Source: <strong>Iowa</strong> Department <strong>of</strong> Education, Certified Enrollment Files and Department <strong>of</strong> Revenue and<br />
Finance Records.<br />
Note: Estimated revenues were used for Fiscal Year 2002, Fiscal Year 2003, and Fiscal Year 2004.<br />
*As <strong>of</strong> June 30, 2003.<br />
Total Elementary and Secondary<br />
Education Budgets<br />
Table 179 displays the total <strong>Iowa</strong> public school district elementary and secondary budget<br />
detail by source <strong>of</strong> funds for 1985-1986, 2002-2003 and 2003-2004. The total estimated<br />
budget for 2003-2004 was $3.5 billion. Regular program funds accounted for 64.2 percent<br />
<strong>of</strong> the total budget. <strong>State</strong> categorical funding decreased from 4.4 percent <strong>of</strong> the budget in<br />
2002-2003 to 4.1 percent in 2003-2004. Total funding for AEA programs decreased from 4.2<br />
percent in 2002-2003 to 3.9 percent in 2003-2004. The AEA prorated budget reduction<br />
increased by $10.0 million from 2002-2003 to 2003-2004. The management levy increased<br />
from $61.9 million in 2002-2003 to $75.5 million in 2003-2004, an increase <strong>of</strong> 0.3<br />
percentage points for the elementary and secondary budget.<br />
<strong>State</strong> categorical funding includes Educational Excellence, Class Size Reduction/School<br />
Improvement, Technology/School Improvement (program discontinued starting with 2002-<br />
2003), and Student Achievement/Teacher Quality. Federal funding was estimated based<br />
upon the most current year for which information was available. The miscellaneous category<br />
includes the federal funding estimate and the state categorical funding.<br />
292
Table 179<br />
1985-1986 2002-2003 2003-2004<br />
Source <strong>of</strong> Funds Amount Percent Amount Percent Amount Percent<br />
Regular Program $1,263,768,116 78.4% $2,243,096,876 64.6% $2,275,852,128 64.2%<br />
Guarantee Amount 3,161,077 0.2 27,827,224 0.8 27,418,665 0.8<br />
Supplementary Weights 426,616 0.0 24,544,841 0.7 27,165,851 0.8<br />
Special Education 90,438,951 5.6 307,915,068 8.9 320,454,727 9.0<br />
AEA Media 10,865,134 0.7 19,728,417 0.6 20,026,912 0.6<br />
AEA Ed Services 11,986,320 0.7 21,767,366 0.6 22,137,697 0.6<br />
AEA Special Education 60,292,283 3.7 112,334,118 3.2 114,515,005 3.2<br />
AEA Prorated Budget<br />
Reduction (7,499,974) -0.2 (17,499,974) -0.5<br />
TAG SBRC 5,008,416 0.3 0 0.0 0 0.0<br />
Dropout SBRC 1,702,264 0.1 51,842,285 1.5 57,024,842 1.6<br />
Other SBRC 14,203,445 0.9 0 0.0 0 0.0<br />
Instructional Support<br />
& Enrichment 4,092,470 0.3 129,792,379 3.7 134,876,408 3.8<br />
Educational Improvement 0 0.0 802,982