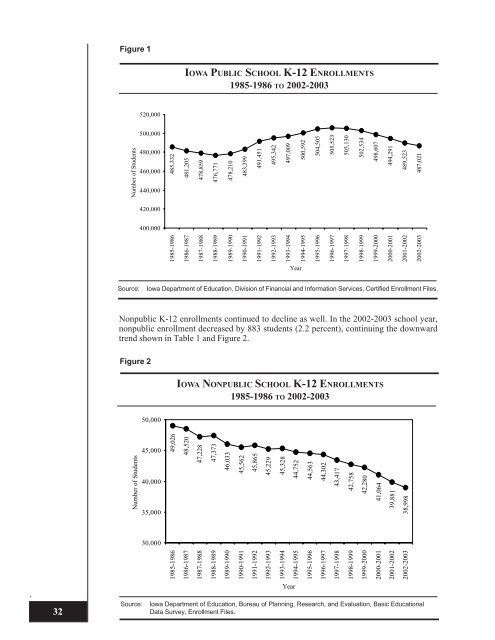
ENROLLMENT Enrollment information presented in this section is collected from the Basic Educational Data Survey (BEDS), certified enrollment, the National Center for Educational Statistics (NCES), and Special Education counts. Information pertaining to state enrollment totals as well as by district enrollment categories is summarized in this section. Data included in this section are enrollment trends, enrollment changes for the nation, distribution <strong>of</strong> public school students and districts, enrollment distribution by Area Education Agency and counties, racial/ethnic distribution <strong>of</strong> students, information pertaining to English Language Learners (ELL), open enrollment, and special education enrollment. Enrollment Trends Public school K-12 enrollments continued to decrease in 2002-2003. The decrease represents the sixth consecutive year <strong>of</strong> declining public school K-12 enrollments from the 1996-1997 school year. During that period, public school K-12 enrollments have declined 18,502 students (3.7 percent). The total public K-12 school enrollment in 2002-2003 was 2,502 students below (-0.5 percent) public school K-12 enrollments in 2001-2002. The 1972-1973 school year had the historical high in public school K-12 enrollment <strong>of</strong> 645,000 (Table 1 and Figure 1). udents Table 1 Elementary/Secondary Enrollment IOWA PUBLIC AND NONPUBLIC SCHOOL K-12 ENROLLMENTS 1972-1973 AND 1985-1986 TO 2002-2003 Combined Total Combined Change From Year Public Nonpublic Total Previous Year 1972-1973 645,000 66,000 711,000 1985-1986 485,332 49,026 534,358 -24.8%* 1986-1987 481,205 48,520 529,725 -0.9 1987-1988 478,859 47,228 526,087 -0.7 1988-1989 476,771 47,373 524,144 -0.4 1989-1990 478,210 46,033 524,243 0.0 1990-1991 483,399 45,562 528,961 0.9 1991-1992 491,451 45,865 537,316 1.6 1992-1993 495,342 45,229 540,571 0.6 1993-1994 497,009 45,328 542,337 0.3 1994-1995 500,592 44,752 545,344 0.6 1995-1996 504,505 44,563 549,068 0.7 1996-1997 505,523 44,302 549,825 0.1 1997-1998 505,130 43,417 548,547 -0.2 1998-1999 502,534 42,758 545,292 -0.6 1999-2000 498,607 42,280 540,887 -0.8 2000-2001 494,291 41,064 535,355 -1.0 2001-2002 489,523 39,881 529,404 -1.1 2002-2003 487,021 38,998 526,019 -0.6 Source: <strong>Iowa</strong> Department <strong>of</strong> Education, Division <strong>of</strong> Financial and Information Services, Certified Enrollment Files, and Bureau <strong>of</strong> Planning, Research, and Evaluation, Basic Educational Data Survey, Enrollment Files. Note: *Base year for comparison. Change from 1972-1973 to 1985-1986. 31
Figure 1 IOWA PUBLIC SCHOOL K-12 ENROLLMENTS 1985-1986 TO 2002-2003 520,000 500,000 480,000 460,000 440,000 485,332 481,205 478,859 476,771 478,210 483,399 491,451 495,342 497,009 500,592 504,505 505,523 505,130 502,534 498,607 494,291 489,523 487,021 420,000 400,000 1985-1986 1986-1987 1987-1988 1988-1989 1989-1990 1990-1991 1991-1992 1992-1993 1993-1994 1994-1995 1995-1996 1996-1997 Number <strong>of</strong> Students 1997-1998 1998-1999 1999-2000 2000-2001 2001-2002 2002-2003 Year Source: <strong>Iowa</strong> Department <strong>of</strong> Education, Division <strong>of</strong> Financial and Information Services, Certified Enrollment Files. Nonpublic K-12 enrollments continued to decline as well. In the 2002-2003 school year, nonpublic enrollment decreased by 883 students (2.2 percent), continuing the downward trend shown in Table 1 and Figure 2. Figure 2 IOWA NONPUBLIC SCHOOL K-12 ENROLLMENTS 1985-1986 TO 2002-2003 50,000 Number <strong>of</strong> Students 45,000 40,000 35,000 49,026 48,520 47,228 47,373 46,033 45,562 45,865 45,229 45,328 44,752 44,563 44,302 43,417 42,758 42,280 41,064 39,881 38,998 30,000 1985-1986 1986-1987 1987-1988 1988-1989 1989-1990 1990-1991 1991-1992 1992-1993 1993-1994 1994-1995 1995-1996 1996-1997 1997-1998 1998-1999 1999-2000 2000-2001 2001-2002 2002-2003 . 32 Source: Year <strong>Iowa</strong> Department <strong>of</strong> Education, Bureau <strong>of</strong> Planning, Research, and Evaluation, Basic Educational Data Survey, Enrollment Files.
- Page 1 and 2: The Annual CONDITION OF EDUCATION R
- Page 3 and 4: State Board of Education State of I
- Page 5 and 6: To the Citizens of Iowa Our 14 th A
- Page 7 and 8: Contents BACKGROUND DEMOGRAPHICS ..
- Page 9 and 10: Contents STUDENT PERFORMANCE2......
- Page 12 and 13: BACKGROUND DEMOGRAPHICS Introductio
- Page 14 and 15: Population and Demographics Populat
- Page 16 and 17: Population and Demographics Iowa Po
- Page 18 and 19: Population and Demographics Birth R
- Page 20 and 21: Population and Demographics Househo
- Page 22 and 23: Population and Demographics Migrati
- Page 24 and 25: Economics Average Weekly Wage FIGUR
- Page 26 and 27: Social Children Poverty - States FI
- Page 28 and 29: Social Educational Attainment TABLE
- Page 30 and 31: Social Educational Attainment FIGUR
- Page 32 and 33: Social Educational Attainment TABLE
- Page 34 and 35: Social Eligible for Free or Reduced
- Page 36 and 37: Social Most Livable States TABLE 5B
- Page 38 and 39: Social Working Parents FIGURE 20B
- Page 40 and 41: INTRODUCTION TO GRADES PK-12 Inform
- Page 44 and 45: Table 2 presents information pertai
- Page 46 and 47: Among states in the region, Illinoi
- Page 48 and 49: Historical and projected Iowa publi
- Page 50 and 51: Enrollment Changes for the Nation I
- Page 52 and 53: Figure 6 Number of School Districts
- Page 54 and 55: Table 11 Source: IOWA NONPUBLIC SCH
- Page 56 and 57: Enrollment Distribution by Area Edu
- Page 58 and 59: Table 15 IOWA PUBLIC SCHOOL CERTIFI
- Page 60 and 61: Table 16 IOWA PUBLIC SCHOOL PK-12 E
- Page 62 and 63: Weighted English Language Learners
- Page 64 and 65: Table 20 % of Total ELL Language 19
- Page 66 and 67: Figure 11 Number of Students 30,000
- Page 68: Figure 12 SPECIAL EDUCATION ENROLLM
- Page 71 and 72: Table 24 CHARACTERISTICS OF IOWA FU
- Page 73 and 74: Figure 13 IOWA FULL-TIME PUBLIC SCH
- Page 76 and 77: Beginning Full-time Public School T
- Page 78 and 79: Minority Teacher Characteristics Mi
- Page 80 and 81: Tables 35 through 37 present public
- Page 82 and 83: Average Regular Salary vs. Average
- Page 84 and 85: Teacher Salaries by Area Education
- Page 86 and 87: Teacher Salary Comparisons with Oth
- Page 88 and 89: Beginning Teacher Salary Comparison
- Page 90 and 91: Characteristics of Principals Chara
- Page 92 and 93:
Table 47 COMBINED AGE AND EXPERIENC
- Page 94 and 95:
Characteristics of Superintendents
- Page 96 and 97:
Figure 20 COMBINED AGE AND EXPERIEN
- Page 98 and 99:
Average salaries by enrollment cate
- Page 100 and 101:
Table 55 Source: Note: GENDER COMPA
- Page 102 and 103:
The distribution of Iowa public sch
- Page 104 and 105:
Pupil-Teacher Ratios Figures 23 and
- Page 106:
Table 60 K-12 PUPIL-TEACHER RATIOS
- Page 109 and 110:
Table 62 ORGANIZATIONAL STRUCTURES
- Page 111 and 112:
Table 64 presents average curriculu
- Page 113 and 114:
Foreign Language Enrollments Total
- Page 115 and 116:
Higher Level Science Enrollments Ta
- Page 117 and 118:
Computer-Related Course Enrollments
- Page 119 and 120:
The frequency distribution of mathe
- Page 121 and 122:
Findings A comparison of average cl
- Page 123 and 124:
The variation in change to average
- Page 125 and 126:
Although the percentage of classroo
- Page 127 and 128:
Figure 26 DISTRIBUTIONS OF IOWA PUB
- Page 129 and 130:
Figure 27 DISTRIBUTIONS OF IOWA PUB
- Page 131 and 132:
Figure 28 DISTRIBUTIONS OF IOWA PUB
- Page 133 and 134:
Figure 29 DISTRIBUTIONS OF IOWA PUB
- Page 135 and 136:
Class Size Expenditures Over 97 per
- Page 137 and 138:
Public school expenditures for comp
- Page 139 and 140:
Table 92 NUMBER OF COMPUTERS IN IOW
- Page 141 and 142:
Table 93 2000-2001 NUMBER OF COMPUT
- Page 143 and 144:
Project EASIER (Electronic Access S
- Page 145 and 146:
Table 97 shows the number of public
- Page 147 and 148:
In 2002-2003, all-day, everyday two
- Page 149 and 150:
138
- Page 151 and 152:
For many years, statewide achieveme
- Page 153 and 154:
Subgroup Iowa Student Counts for IT
- Page 155 and 156:
Table 104 APPROXIMATE AVERAGE NUMBE
- Page 157 and 158:
Figure 38A PERCENT OF IOWA FOURTH G
- Page 159 and 160:
Figure 40A PERCENT OF IOWA FOURTH G
- Page 161 and 162:
Figure 42A PERCENT OF IOWA FOURTH G
- Page 163 and 164:
Figure 44A PERCENT OF IOWA EIGHTH G
- Page 165 and 166:
Figure 46A PERCENT OF IOWA EIGHTH G
- Page 167 and 168:
Figure 48A PERCENT OF IOWA EIGHTH G
- Page 169 and 170:
Figure 50 PERCENT OF IOWA ELEVENTH
- Page 171 and 172:
Figure 52A PERCENT OF IOWA ELEVENTH
- Page 173 and 174:
Figure 54A PERCENT OF IOWA ELEVENTH
- Page 175 and 176:
Figure 56A PERCENT OF IOWA ELEVENTH
- Page 177 and 178:
Figure 58A PERCENT OF IOWA FOURTH G
- Page 179 and 180:
Figure 60A PERCENT OF IOWA FOURTH G
- Page 181 and 182:
Figure 62A PERCENT OF IOWA FOURTH G
- Page 183 and 184:
Figure 64 PERCENT OF IOWA EIGHTH GR
- Page 185 and 186:
Figure 66A PERCENT OF IOWA EIGHTH G
- Page 187 and 188:
Figure 68A PERCENT OF IOWA EIGHTH G
- Page 189 and 190:
Figure 70A PERCENT OF IOWA EIGHTH G
- Page 191 and 192:
Figure 72A PERCENT OF IOWA ELEVENTH
- Page 193 and 194:
Figure 74A PERCENT OF IOWA ELEVENTH
- Page 195 and 196:
Figure 76A PERCENT OF IOWA ELEVENTH
- Page 197 and 198:
Science Indicator: Percentage of al
- Page 199 and 200:
Figure 82 PERCENT OF IOWA EIGHTH GR
- Page 201 and 202:
Figure 86 PERCENT OF IOWA ELEVENTH
- Page 203 and 204:
Dropouts Indicator: Percentage of s
- Page 205 and 206:
High School Graduation Rates Indica
- Page 207 and 208:
Postsecondary Education/Training In
- Page 209 and 210:
Iowa Testing Programs Iowa Testing
- Page 211 and 212:
Average ITBS Reading Comprehension
- Page 213 and 214:
Iowa Tests of Educational Developme
- Page 215 and 216:
Average ITED Mathematics scores for
- Page 217 and 218:
Table 105 shows how 2001-2002 Iowa
- Page 219 and 220:
Figure 108 COMPARISON OF THE PERCEN
- Page 221 and 222:
There was about a four percentage p
- Page 223 and 224:
Achievement Levels for Mathematics
- Page 225 and 226:
Figure 115 ITED MATHEMATICS - GRADE
- Page 227 and 228:
Figure 117 ITED SCIENCE - GRADE 11
- Page 229 and 230:
The percentage of Iowa graduates th
- Page 231 and 232:
Figure 119 ores 36 31 IOWA AND NATI
- Page 233 and 234:
Figure 122 AVERAGE ACT READING SCOR
- Page 235 and 236:
Figure 124 PERCENT OF ACT PARTICIPA
- Page 237 and 238:
Figure 126 DISTRIBUTION OF IOWA ACT
- Page 239 and 240:
ACT Scores by Gender Figure 128 com
- Page 241 and 242:
The average ACT composite scores by
- Page 243 and 244:
Iowa Student Satisfaction with Sele
- Page 245 and 246:
Figure 130 TRENDS OF AVERAGE SAT SC
- Page 247 and 248:
Advanced Placement (AP) The Advance
- Page 249 and 250:
Table 128 ADVANCED PLACEMENT EXAM S
- Page 251 and 252:
Table 131 shows the AP school parti
- Page 253 and 254:
National Assessment of Educational
- Page 255 and 256:
Pursuit of Postsecondary Education/
- Page 257 and 258:
The percent of high school graduate
- Page 259 and 260:
Table 138 IOWA POSTSECONDARY ENROLL
- Page 261 and 262:
Although the total number of course
- Page 263 and 264:
Table 141 TOTAL IOWA PUBLIC SCHOOL
- Page 265 and 266:
Figure 140 COMPARISON OF THE PERCEN
- Page 267 and 268:
High School Graduation Rates The De
- Page 269 and 270:
Graduation data by race/ethnicity a
- Page 271 and 272:
Table 150 displays data from the Na
- Page 273 and 274:
Highly Qualified Teacher Comparison
- Page 275 and 276:
264
- Page 277 and 278:
Table 155 provides function categor
- Page 279 and 280:
Table 158 REVENUES BY SOURCE AS A P
- Page 281 and 282:
Figure 143 PERCENT OF TOTAL GENERAL
- Page 283 and 284:
Taxable valuations per pupil vary w
- Page 285 and 286:
Figure 145 IOWA AND MIDWEST STATES
- Page 287 and 288:
Property Taxes Table 165 displays t
- Page 289 and 290:
Table 167 provides total property t
- Page 291 and 292:
Total taxes for the regular and vot
- Page 293 and 294:
through 2003-2004, two enrollment c
- Page 295 and 296:
Figure 146 INSTRUCTIONAL SUPPORT PR
- Page 297 and 298:
Table 174 INSTRUCTIONAL SUPPORT PRO
- Page 299 and 300:
Figure 148 NUMBER AND PERCENT OF IO
- Page 301 and 302:
Bond Elections The number of distri
- Page 303 and 304:
Table 178 LOCAL OPTION SALES AND SE