- Page 1 and 2:
The Annual CONDITION OF EDUCATION R
- Page 3 and 4:
State Board of Education State of I
- Page 5 and 6:
To the Citizens of Iowa Our 14 th A
- Page 7 and 8:
Contents BACKGROUND DEMOGRAPHICS ..
- Page 9 and 10:
Contents STUDENT PERFORMANCE2......
- Page 12 and 13:
BACKGROUND DEMOGRAPHICS Introductio
- Page 14 and 15:
Population and Demographics Populat
- Page 16 and 17:
Population and Demographics Iowa Po
- Page 18 and 19:
Population and Demographics Birth R
- Page 20 and 21:
Population and Demographics Househo
- Page 22 and 23:
Population and Demographics Migrati
- Page 24 and 25:
Economics Average Weekly Wage FIGUR
- Page 26 and 27:
Social Children Poverty - States FI
- Page 28 and 29:
Social Educational Attainment TABLE
- Page 30 and 31:
Social Educational Attainment FIGUR
- Page 32 and 33:
Social Educational Attainment TABLE
- Page 34 and 35:
Social Eligible for Free or Reduced
- Page 36 and 37:
Social Most Livable States TABLE 5B
- Page 38 and 39:
Social Working Parents FIGURE 20B
- Page 40 and 41:
INTRODUCTION TO GRADES PK-12 Inform
- Page 42 and 43:
ENROLLMENT Enrollment information p
- Page 44 and 45:
Table 2 presents information pertai
- Page 46 and 47:
Among states in the region, Illinoi
- Page 48 and 49:
Historical and projected Iowa publi
- Page 50 and 51:
Enrollment Changes for the Nation I
- Page 52 and 53:
Figure 6 Number of School Districts
- Page 54 and 55:
Table 11 Source: IOWA NONPUBLIC SCH
- Page 56 and 57:
Enrollment Distribution by Area Edu
- Page 58 and 59:
Table 15 IOWA PUBLIC SCHOOL CERTIFI
- Page 60 and 61:
Table 16 IOWA PUBLIC SCHOOL PK-12 E
- Page 62 and 63:
Weighted English Language Learners
- Page 64 and 65:
Table 20 % of Total ELL Language 19
- Page 66 and 67:
Figure 11 Number of Students 30,000
- Page 68:
Figure 12 SPECIAL EDUCATION ENROLLM
- Page 71 and 72:
Table 24 CHARACTERISTICS OF IOWA FU
- Page 73 and 74:
Figure 13 IOWA FULL-TIME PUBLIC SCH
- Page 76 and 77:
Beginning Full-time Public School T
- Page 78 and 79:
Minority Teacher Characteristics Mi
- Page 80 and 81:
Tables 35 through 37 present public
- Page 82 and 83:
Average Regular Salary vs. Average
- Page 84 and 85:
Teacher Salaries by Area Education
- Page 86 and 87:
Teacher Salary Comparisons with Oth
- Page 88 and 89:
Beginning Teacher Salary Comparison
- Page 90 and 91:
Characteristics of Principals Chara
- Page 92 and 93:
Table 47 COMBINED AGE AND EXPERIENC
- Page 94 and 95:
Characteristics of Superintendents
- Page 96 and 97:
Figure 20 COMBINED AGE AND EXPERIEN
- Page 98 and 99:
Average salaries by enrollment cate
- Page 100 and 101:
Table 55 Source: Note: GENDER COMPA
- Page 102 and 103:
The distribution of Iowa public sch
- Page 104 and 105:
Pupil-Teacher Ratios Figures 23 and
- Page 106:
Table 60 K-12 PUPIL-TEACHER RATIOS
- Page 109 and 110:
Table 62 ORGANIZATIONAL STRUCTURES
- Page 111 and 112:
Table 64 presents average curriculu
- Page 113 and 114:
Foreign Language Enrollments Total
- Page 115 and 116:
Higher Level Science Enrollments Ta
- Page 117 and 118:
Computer-Related Course Enrollments
- Page 119 and 120:
The frequency distribution of mathe
- Page 121 and 122:
Findings A comparison of average cl
- Page 123 and 124:
The variation in change to average
- Page 125 and 126:
Although the percentage of classroo
- Page 127 and 128:
Figure 26 DISTRIBUTIONS OF IOWA PUB
- Page 129 and 130:
Figure 27 DISTRIBUTIONS OF IOWA PUB
- Page 131 and 132:
Figure 28 DISTRIBUTIONS OF IOWA PUB
- Page 133 and 134:
Figure 29 DISTRIBUTIONS OF IOWA PUB
- Page 135 and 136:
Class Size Expenditures Over 97 per
- Page 137 and 138:
Public school expenditures for comp
- Page 139 and 140:
Table 92 NUMBER OF COMPUTERS IN IOW
- Page 141 and 142:
Table 93 2000-2001 NUMBER OF COMPUT
- Page 143 and 144:
Project EASIER (Electronic Access S
- Page 145 and 146:
Table 97 shows the number of public
- Page 147 and 148:
In 2002-2003, all-day, everyday two
- Page 149 and 150:
138
- Page 151 and 152:
For many years, statewide achieveme
- Page 153 and 154:
Subgroup Iowa Student Counts for IT
- Page 155 and 156:
Table 104 APPROXIMATE AVERAGE NUMBE
- Page 157 and 158:
Figure 38A PERCENT OF IOWA FOURTH G
- Page 159 and 160:
Figure 40A PERCENT OF IOWA FOURTH G
- Page 161 and 162:
Figure 42A PERCENT OF IOWA FOURTH G
- Page 163 and 164:
Figure 44A PERCENT OF IOWA EIGHTH G
- Page 165 and 166:
Figure 46A PERCENT OF IOWA EIGHTH G
- Page 167 and 168:
Figure 48A PERCENT OF IOWA EIGHTH G
- Page 169 and 170:
Figure 50 PERCENT OF IOWA ELEVENTH
- Page 171 and 172:
Figure 52A PERCENT OF IOWA ELEVENTH
- Page 173 and 174:
Figure 54A PERCENT OF IOWA ELEVENTH
- Page 175 and 176:
Figure 56A PERCENT OF IOWA ELEVENTH
- Page 177 and 178:
Figure 58A PERCENT OF IOWA FOURTH G
- Page 179 and 180:
Figure 60A PERCENT OF IOWA FOURTH G
- Page 181 and 182:
Figure 62A PERCENT OF IOWA FOURTH G
- Page 183 and 184:
Figure 64 PERCENT OF IOWA EIGHTH GR
- Page 185 and 186:
Figure 66A PERCENT OF IOWA EIGHTH G
- Page 187 and 188:
Figure 68A PERCENT OF IOWA EIGHTH G
- Page 189 and 190:
Figure 70A PERCENT OF IOWA EIGHTH G
- Page 191 and 192:
Figure 72A PERCENT OF IOWA ELEVENTH
- Page 193 and 194:
Figure 74A PERCENT OF IOWA ELEVENTH
- Page 195 and 196:
Figure 76A PERCENT OF IOWA ELEVENTH
- Page 197 and 198:
Science Indicator: Percentage of al
- Page 199 and 200:
Figure 82 PERCENT OF IOWA EIGHTH GR
- Page 201 and 202:
Figure 86 PERCENT OF IOWA ELEVENTH
- Page 203 and 204:
Dropouts Indicator: Percentage of s
- Page 205 and 206:
High School Graduation Rates Indica
- Page 207 and 208:
Postsecondary Education/Training In
- Page 209 and 210:
Iowa Testing Programs Iowa Testing
- Page 211 and 212:
Average ITBS Reading Comprehension
- Page 213 and 214:
Iowa Tests of Educational Developme
- Page 215 and 216:
Average ITED Mathematics scores for
- Page 217 and 218:
Table 105 shows how 2001-2002 Iowa
- Page 219 and 220:
Figure 108 COMPARISON OF THE PERCEN
- Page 221 and 222:
There was about a four percentage p
- Page 223 and 224:
Achievement Levels for Mathematics
- Page 225 and 226:
Figure 115 ITED MATHEMATICS - GRADE
- Page 227 and 228:
Figure 117 ITED SCIENCE - GRADE 11
- Page 229 and 230:
The percentage of Iowa graduates th
- Page 231 and 232: Figure 119 ores 36 31 IOWA AND NATI
- Page 233 and 234: Figure 122 AVERAGE ACT READING SCOR
- Page 235 and 236: Figure 124 PERCENT OF ACT PARTICIPA
- Page 237 and 238: Figure 126 DISTRIBUTION OF IOWA ACT
- Page 239 and 240: ACT Scores by Gender Figure 128 com
- Page 241 and 242: The average ACT composite scores by
- Page 243 and 244: Iowa Student Satisfaction with Sele
- Page 245 and 246: Figure 130 TRENDS OF AVERAGE SAT SC
- Page 247 and 248: Advanced Placement (AP) The Advance
- Page 249 and 250: Table 128 ADVANCED PLACEMENT EXAM S
- Page 251 and 252: Table 131 shows the AP school parti
- Page 253 and 254: National Assessment of Educational
- Page 255 and 256: Pursuit of Postsecondary Education/
- Page 257 and 258: The percent of high school graduate
- Page 259 and 260: Table 138 IOWA POSTSECONDARY ENROLL
- Page 261 and 262: Although the total number of course
- Page 263 and 264: Table 141 TOTAL IOWA PUBLIC SCHOOL
- Page 265 and 266: Figure 140 COMPARISON OF THE PERCEN
- Page 267 and 268: High School Graduation Rates The De
- Page 269 and 270: Graduation data by race/ethnicity a
- Page 271 and 272: Table 150 displays data from the Na
- Page 273 and 274: Highly Qualified Teacher Comparison
- Page 275 and 276: 264
- Page 277 and 278: Table 155 provides function categor
- Page 279 and 280: Table 158 REVENUES BY SOURCE AS A P
- Page 281: Figure 143 PERCENT OF TOTAL GENERAL
- Page 285 and 286: Figure 145 IOWA AND MIDWEST STATES
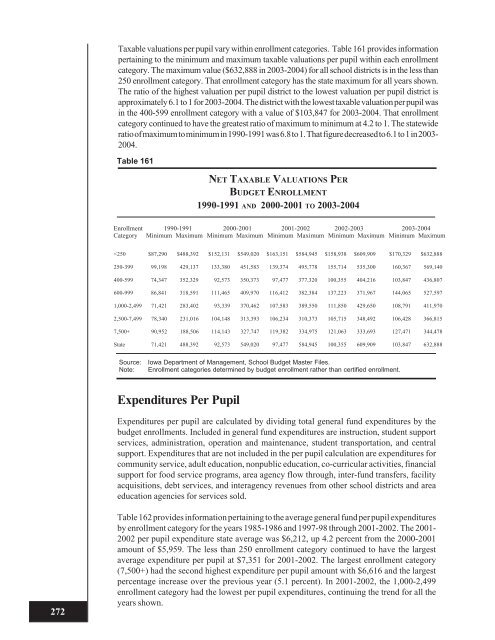
- Page 287 and 288: Property Taxes Table 165 displays t
- Page 289 and 290: Table 167 provides total property t
- Page 291 and 292: Total taxes for the regular and vot
- Page 293 and 294: through 2003-2004, two enrollment c
- Page 295 and 296: Figure 146 INSTRUCTIONAL SUPPORT PR
- Page 297 and 298: Table 174 INSTRUCTIONAL SUPPORT PRO
- Page 299 and 300: Figure 148 NUMBER AND PERCENT OF IO
- Page 301 and 302: Bond Elections The number of distri
- Page 303 and 304: Table 178 LOCAL OPTION SALES AND SE


