A bubble curtain model applied in chlorate electrolysis
A bubble curtain model applied in chlorate electrolysis
A bubble curtain model applied in chlorate electrolysis

Create successful ePaper yourself
Turn your PDF publications into a flip-book with our unique Google optimized e-Paper software.
transformation <strong>in</strong>to the gaseous phase and <strong>bubble</strong> departure from the electrode. If the current density is<br />
very low, there will only be convective mass transfer and no <strong>bubble</strong> formation because the saturation<br />
po<strong>in</strong>t of hydrogen will not be reached.<br />
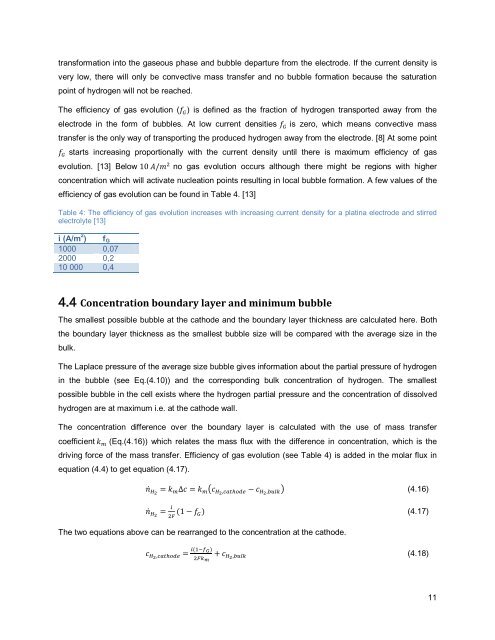
The efficiency of gas evolution (f G ) is def<strong>in</strong>ed as the fraction of hydrogen transported away from the<br />
electrode <strong>in</strong> the form of <strong>bubble</strong>s. At low current densities f G is zero, which means convective mass<br />
transfer is the only way of transport<strong>in</strong>g the produced hydrogen away from the electrode. [8] At some po<strong>in</strong>t<br />
f G starts <strong>in</strong>creas<strong>in</strong>g proportionally with the current density until there is maximum efficiency of gas<br />
evolution. [13] Below 10 A/m 2 no gas evolution occurs although there might be regions with higher<br />
concentration which will activate nucleation po<strong>in</strong>ts result<strong>in</strong>g <strong>in</strong> local <strong>bubble</strong> formation. A few values of the<br />
efficiency of gas evolution can be found <strong>in</strong> Table 4. [13]<br />
Table 4: The efficiency of gas evolution <strong>in</strong>creases with <strong>in</strong>creas<strong>in</strong>g current density for a plat<strong>in</strong>a electrode and stirred<br />
electrolyte [13]<br />
i (A/m 2 ) f G<br />
1000 0,07<br />
2000 0,2<br />
10 000 0,4<br />
4.4 Concentration boundary layer and m<strong>in</strong>imum <strong>bubble</strong><br />
The smallest possible <strong>bubble</strong> at the cathode and the boundary layer thickness are calculated here. Both<br />
the boundary layer thickness as the smallest <strong>bubble</strong> size will be compared with the average size <strong>in</strong> the<br />
bulk.<br />
The Laplace pressure of the average size <strong>bubble</strong> gives <strong>in</strong>formation about the partial pressure of hydrogen<br />
<strong>in</strong> the <strong>bubble</strong> (see Eq.(4.10)) and the correspond<strong>in</strong>g bulk concentration of hydrogen. The smallest<br />
possible <strong>bubble</strong> <strong>in</strong> the cell exists where the hydrogen partial pressure and the concentration of dissolved<br />
hydrogen are at maximum i.e. at the cathode wall.<br />
The concentration difference over the boundary layer is calculated with the use of mass transfer<br />
coefficient k m (Eq.(4.16)) which relates the mass flux with the difference <strong>in</strong> concentration, which is the<br />
driv<strong>in</strong>g force of the mass transfer. Efficiency of gas evolution (see Table 4) is added <strong>in</strong> the molar flux <strong>in</strong><br />
equation (4.4) to get equation (4.17).<br />
ṅ H 2<br />
= k m ∆c = k m c H2 ,cathode − c H2 ,bulk (4.16)<br />
ṅ H 2<br />
= i<br />
2F (1 − f G) (4.17)<br />
The two equations above can be rearranged to the concentration at the cathode.<br />
c H2 ,cathode = i(1−f G)<br />
2Fk m<br />
+ c H2 ,bulk (4.18)<br />
11