Rainfall data for the design of sewer detention basins
Rainfall data for the design of sewer detention basins
Rainfall data for the design of sewer detention basins

Create successful ePaper yourself
Turn your PDF publications into a flip-book with our unique Google optimized e-Paper software.
where<br />
t = time<br />
T = total duration chosen equal to 720 minutes<br />
r relationship between <strong>the</strong> time prior to peak intensity<br />
and <strong>the</strong> total duration T.<br />
11<br />
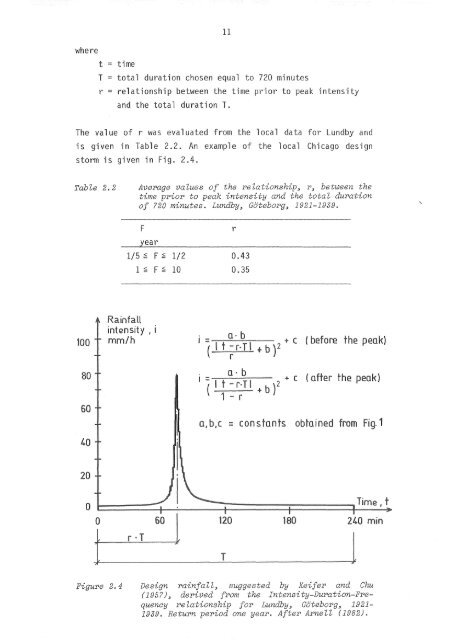
The value <strong>of</strong> r was evaluated from <strong>the</strong> local <strong>data</strong> <strong>for</strong> Lundby and<br />
is given in Table 2.2. An example <strong>of</strong> <strong>the</strong> local Chicago <strong>design</strong><br />
storm is given in Fig. 2.4.<br />
Table 2.2 Average values <strong>of</strong> <strong>the</strong> relationship_, r_, between <strong>the</strong><br />
time prior to peak intensity and <strong>the</strong> total duration<br />
<strong>of</strong> 720 minutes. Lundby_, Goteborg_, 1921-1939.<br />
F<br />
r<br />
1/5 ~ F ~ l/2<br />
1 ~ F ~ 10<br />
0.43<br />
0.35<br />
<strong>Rainfall</strong><br />
inte2nsity , i<br />
mm/h<br />
b )2<br />
+ c (be<strong>for</strong>e <strong>the</strong> peak)<br />
= __ _:;,__ __<br />
2<br />
+ c ( after <strong>the</strong><br />
(-......__+b)<br />
a, b, c = c on stan obtai ned from Fig. 1<br />
0<br />
0<br />
r · T<br />
T<br />
Time, t<br />
Figure 2.4 Design rainfall_, suggested by Keifer and Chu<br />
(1957)_, derived from <strong>the</strong> Intensity-Duration-Frequency<br />
relationship <strong>for</strong> Lundby_, Goteborg_, 1921-<br />
1939. Return period one year. After Arnell (1982).