Rainfall data for the design of sewer detention basins
Rainfall data for the design of sewer detention basins
Rainfall data for the design of sewer detention basins
You also want an ePaper? Increase the reach of your titles
YUMPU automatically turns print PDFs into web optimized ePapers that Google loves.
i i i<br />
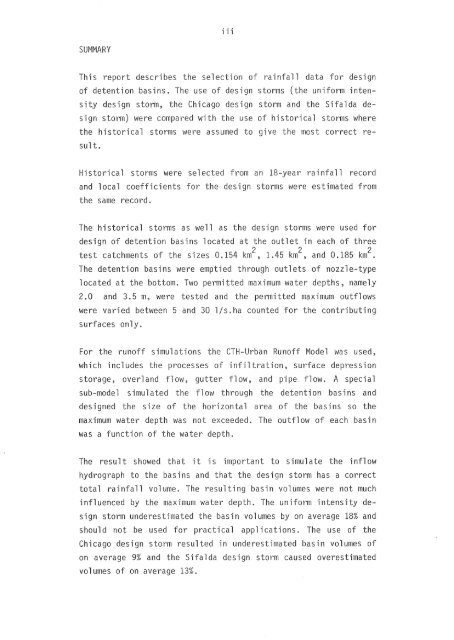
SUMMARY<br />
This report describes <strong>the</strong> on <strong>of</strong> rainfall <strong>data</strong> <strong>for</strong> <strong>design</strong><br />
<strong>of</strong> <strong>detention</strong> <strong>basins</strong> The use <strong>of</strong> ign storms (<strong>the</strong> uni<strong>for</strong>m intensity<br />
<strong>design</strong> storm, <strong>the</strong> Chicago <strong>design</strong> storm and <strong>the</strong> Sifalda <strong>design</strong><br />
storm) were compared with <strong>the</strong> use <strong>of</strong> historical storms where<br />
<strong>the</strong> historical storms were assumed to give <strong>the</strong> most correct result.<br />
Historical storms were selected from an 18-year rainfall record<br />
and local coefficients <strong>for</strong> <strong>the</strong> <strong>design</strong> storms were estimated from<br />
<strong>the</strong> same record.<br />
The historical storms as well as <strong>the</strong> <strong>design</strong> storms were used <strong>for</strong><br />
<strong>design</strong> <strong>of</strong> <strong>detention</strong> <strong>basins</strong> located at <strong>the</strong> outlet in each <strong>of</strong> three<br />
test catchments <strong>of</strong> <strong>the</strong> sizes 0 154 km 2 , 1.45 km 2 , and 0.185 km 2 .<br />
The <strong>detention</strong> <strong>basins</strong> were emptied through outlets <strong>of</strong> nozzle-type<br />
located at <strong>the</strong> bottom. Two permitted maximum water depths, namely<br />
2.0 and 3.5 m, were tested and <strong>the</strong> permitted maximum outflows<br />
were varied between 5 and 30 1/s ha counted <strong>for</strong> <strong>the</strong> contributing<br />
surfaces only.<br />
For <strong>the</strong> run<strong>of</strong>f simulations <strong>the</strong> CTH-Urban Run<strong>of</strong>f Model was used,<br />
which includes <strong>the</strong> processes <strong>of</strong> infiltration, surface depression<br />
storage, overland flow, gutter flow, and pipe flow. A special<br />
sub-model simulated <strong>the</strong> flow through <strong>the</strong> <strong>detention</strong> <strong>basins</strong> and<br />
<strong>design</strong>ed <strong>the</strong> size <strong>of</strong> <strong>the</strong> horizon ta 1 a rea <strong>of</strong> <strong>the</strong> <strong>basins</strong> so <strong>the</strong><br />
maximum water depth was not exceeded. The outflow <strong>of</strong> each basin<br />
was a function <strong>of</strong> <strong>the</strong> water depth<br />
The result showed that it is important to simulate <strong>the</strong> inflow<br />
hydrograph to <strong>the</strong> <strong>basins</strong> and that <strong>the</strong> <strong>design</strong> storm has a correct<br />
total rainfall volume. The resulting basin volumes were not much<br />
influenced by <strong>the</strong> maximum water depth. The uni<strong>for</strong>m intensity <strong>design</strong><br />
storm underestimated <strong>the</strong> basin volumes by on average 18% and<br />
should not be used <strong>for</strong> practical applications. The use <strong>of</strong> <strong>the</strong><br />
Chicago <strong>design</strong> storm resulted in underestimated basin volumes <strong>of</strong><br />
on average 9% and <strong>the</strong> Si lda <strong>design</strong> storm caused overestimated<br />
volumes <strong>of</strong> on average 13%.


