Rainfall data for the design of sewer detention basins
Rainfall data for the design of sewer detention basins
Rainfall data for the design of sewer detention basins

Create successful ePaper yourself
Turn your PDF publications into a flip-book with our unique Google optimized e-Paper software.
2<br />
i Hi cal<br />
In t catchment <strong>the</strong> ins were igned <strong>for</strong> <strong>the</strong> 100 la<br />
est his ca 1 storms <strong>for</strong> each outflow 1 eve 1 found through<br />
screeni<br />
1 rainfall es described in ion 2.2<br />
Since many storms were <strong>the</strong> same <strong>for</strong> <strong>the</strong> different outflow<br />
s total number <strong>of</strong> storms were reduced to 176 These 176<br />
were rst run through <strong>the</strong> CTH-Model and <strong>the</strong> inflows to<br />
sins <strong>for</strong> all storms were stored on a computer le That<br />
fi 1 e was u <strong>for</strong> <strong>the</strong> <strong>design</strong> <strong>of</strong> <strong>the</strong> <strong>basins</strong> <strong>for</strong> different<br />
outflow s Thus, <strong>the</strong> run<strong>of</strong>f <strong>for</strong> <strong>the</strong> different storms <strong>for</strong><br />
ba in needed to be calculated only once.<br />
When doing <strong>the</strong><br />
ign it was controled that <strong>the</strong> basin was empti<br />
ing rainfall.<br />
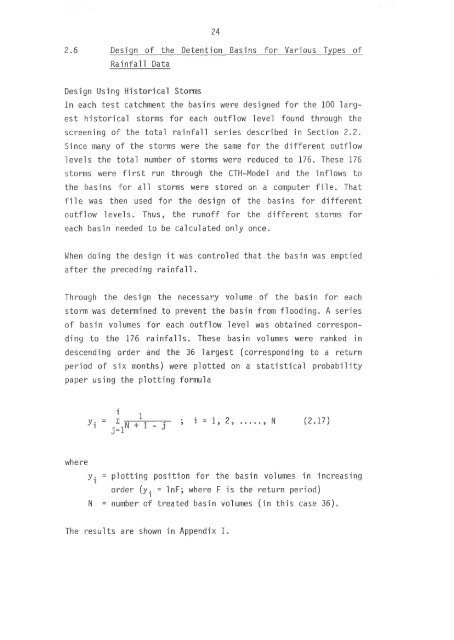
rough i gn <strong>the</strong> necessary vo 1 ume <strong>of</strong> <strong>the</strong> basin <strong>for</strong> each<br />
storm was determined to prevent <strong>the</strong> basin from flooding. A series<br />
<strong>of</strong> basin volumes <strong>for</strong> each outflow level was obtained corresponding<br />
to <strong>the</strong> 176 ra i nfa 11 s. These basin vo 1 umes were ranked in<br />
cending order and <strong>the</strong> largest (corresponding to a return<br />
period <strong>of</strong> six months) were plotted on a statistical probability<br />
paper using <strong>the</strong> plotting <strong>for</strong>mula<br />
y.<br />
1<br />
=1,2 ... ,N (2.17)<br />
yi plotting position <strong>for</strong> <strong>the</strong> basin volumes in increasing<br />
(yi = lnF; where F is return period)<br />
N = number <strong>of</strong> ted basin volumes (in this case 36)<br />
The resul are shown in Appendix I.