Rainfall data for the design of sewer detention basins
Rainfall data for the design of sewer detention basins
Rainfall data for the design of sewer detention basins

You also want an ePaper? Increase the reach of your titles
YUMPU automatically turns print PDFs into web optimized ePapers that Google loves.
13<br />
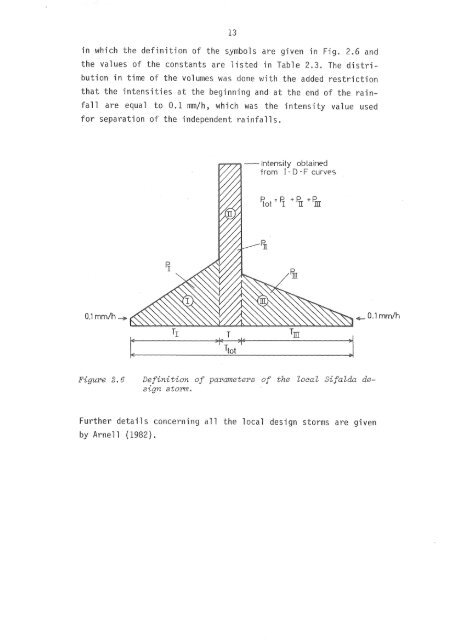
in which <strong>the</strong> definition <strong>of</strong> <strong>the</strong> symbols are given in Fig. 2.6 and<br />
<strong>the</strong> values <strong>of</strong> <strong>the</strong> constants are listed in Table 2.3. The distribution<br />
in time <strong>of</strong> <strong>the</strong> volumes was done with <strong>the</strong> added restriction<br />
that <strong>the</strong> intensities at <strong>the</strong> beginning and at <strong>the</strong> end <strong>of</strong> <strong>the</strong> rainfall<br />
are equal to 0.1 mm/h, which was <strong>the</strong> intensity value used<br />
<strong>for</strong> separation <strong>of</strong> <strong>the</strong> independent rainfalls.<br />
----Intensity obtained<br />
from I- D F curves<br />
0.1 mm/h~<br />
0.1 mm/h<br />
Figure 2.6<br />
Definition <strong>of</strong> parameters <strong>of</strong> <strong>the</strong> local Sifalda <strong>design</strong><br />
storm.<br />
Fur<strong>the</strong>r details concerning all <strong>the</strong> local <strong>design</strong> storms are given<br />
by Arnell (1982).