

089-2013: Using Classification and Regression Trees (CART ... - SAS
089-2013: Using Classification and Regression Trees (CART ... - SAS
089-2013: Using Classification and Regression Trees (CART ... - SAS

Create successful ePaper yourself
Turn your PDF publications into a flip-book with our unique Google optimized e-Paper software.
<strong>SAS</strong> Global Forum <strong>2013</strong><br />
Data Mining <strong>and</strong> Text Analytics<br />
<strong>Using</strong> <strong>Classification</strong> <strong>and</strong> <strong>Regression</strong> <strong>Trees</strong> (<strong>CART</strong>) in <strong>SAS</strong>® Enterprise Miner TM , continued<br />
defined. The analyst can choose the splitting <strong>and</strong> stopping rules, the maximum number of branches from a node, the<br />
maximum depth, the minimum strata size, number of surrogate rules <strong>and</strong> several other rules that are allowed.<br />
In <strong>SAS</strong> ® Enterprise Miner TM , the whole <strong>CART</strong> process is driven by a process flow diagram that is created by dragging<br />
nodes from the toolbar into the diagram workspace. Once created the process flow diagram can be easily updated or<br />
modified. The first node of the process flow is the input data node. This is usually the data source that was created<br />
along with the project <strong>and</strong> library. The StatExplore node follows the data input node. This node allows for exploratory<br />
analysis of the data. . The next node is the data partition node. This allows the analyst to divide the dataset into<br />
training, validation <strong>and</strong> test sub datasets. The three datasets <strong>and</strong> how they are used have been described above.<br />
Then follows the replacement node which allows the analyst to replace or recode certain values in the datasets. The<br />
next node is the control point node which is used to simplify the process flow diagram by reducing the number of<br />
connections between multiple interconnected nodes. This node is followed by the decision tree node. In this node the<br />
splitting criterion can be set so that Enterprise Miner is aware that we want to construct a <strong>CART</strong> diagram which is one<br />
of several decision tree methods available in the software. For categorical variables the splitting criterion is set to Gini<br />
reduction <strong>and</strong> for interval or continuous variables the splitting criterion is set to variance reduction. Nodes are<br />
connected by an arrow which is created by dragging a pencil from the right edge of the preceding node to the left<br />
edge of the succeeding node. For this process flow diagram the input data node is connected to the StatExplore node<br />
which is connected the data partition node etc. When a node is run all the other nodes preceding it in the process<br />
flow will run in the order that they were presented. See the results section below for a figure of the process flow<br />
diagram that was created for one of these projects.<br />
The <strong>CART</strong> algorithm fits the data by constructing a full grown tree. From the original tree a sequence of subtrees are<br />
found. The final subtree is chosen based on a complexity tuning parameter with values greater than or equal to zero.<br />
When the parameter is zero the fully grown tree is used. For small values of this parameter large trees will be<br />
produced <strong>and</strong> vice versa. The best tree is chosen by selecting the optimal number of leaves for minimizing the<br />
impurity function as chosen by the splitting criterion.<br />
RESULTS<br />
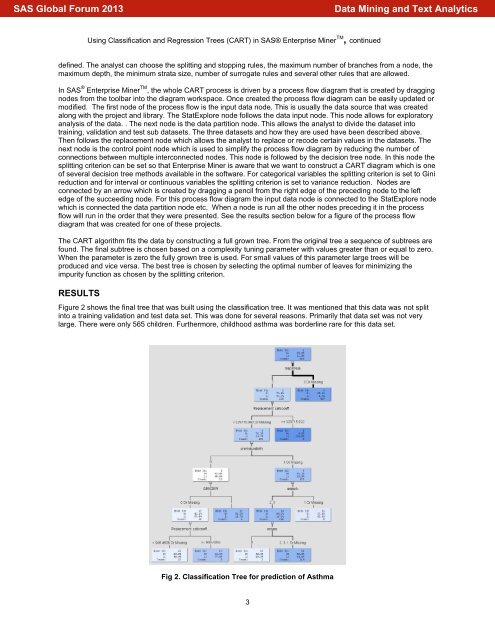
Figure 2 shows the final tree that was built using the classification tree. It was mentioned that this data was not split<br />
into a training validation <strong>and</strong> test data set. This was done for several reasons. Primarily that data set was not very<br />
large. There were only 565 children. Furthermore, childhood asthma was borderline rare for this data set.<br />
Fig 2. <strong>Classification</strong> Tree for prediction of Asthma<br />
3


