

089-2013: Using Classification and Regression Trees (CART ... - SAS
089-2013: Using Classification and Regression Trees (CART ... - SAS
089-2013: Using Classification and Regression Trees (CART ... - SAS

You also want an ePaper? Increase the reach of your titles
YUMPU automatically turns print PDFs into web optimized ePapers that Google loves.
<strong>SAS</strong> Global Forum <strong>2013</strong><br />
Data Mining <strong>and</strong> Text Analytics<br />
<strong>Using</strong> <strong>Classification</strong> <strong>and</strong> <strong>Regression</strong> <strong>Trees</strong> (<strong>CART</strong>) in <strong>SAS</strong>® Enterprise Miner TM , continued<br />
the tree with all the observations. The internal nodes are the non-terminal nodes with the splitting rules. And the leaf<br />
nodes are the terminal nodes with final classification for a set of observations. An example of English rules for a tree<br />
model is shown in the appendix.<br />
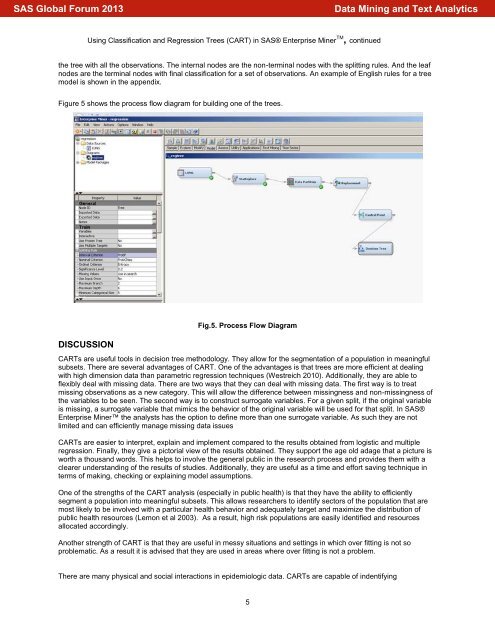
Figure 5 shows the process flow diagram for building one of the trees.<br />
DISCUSSION<br />
Fig.5. Process Flow Diagram<br />
<strong>CART</strong>s are useful tools in decision tree methodology. They allow for the segmentation of a population in meaningful<br />
subsets. There are several advantages of <strong>CART</strong>. One of the advantages is that trees are more efficient at dealing<br />
with high dimension data than parametric regression techniques (Westreich 2010). Additionally, they are able to<br />
flexibly deal with missing data. There are two ways that they can deal with missing data. The first way is to treat<br />
missing observations as a new category. This will allow the difference between missingness <strong>and</strong> non-missingness of<br />
the variables to be seen. The second way is to construct surrogate variables. For a given split, if the original variable<br />
is missing, a surrogate variable that mimics the behavior of the original variable will be used for that split. In <strong>SAS</strong>®<br />
Enterprise Miner the analysts has the option to define more than one surrogate variable. As such they are not<br />
limited <strong>and</strong> can efficiently manage missing data issues<br />
<strong>CART</strong>s are easier to interpret, explain <strong>and</strong> implement compared to the results obtained from logistic <strong>and</strong> multiple<br />
regression. Finally, they give a pictorial view of the results obtained. They support the age old adage that a picture is<br />
worth a thous<strong>and</strong> words. This helps to involve the general public in the research process <strong>and</strong> provides them with a<br />
clearer underst<strong>and</strong>ing of the results of studies. Additionally, they are useful as a time <strong>and</strong> effort saving technique in<br />
terms of making, checking or explaining model assumptions.<br />
One of the strengths of the <strong>CART</strong> analysis (especially in public health) is that they have the ability to efficiently<br />
segment a population into meaningful subsets. This allows researchers to identify sectors of the population that are<br />
most likely to be involved with a particular health behavior <strong>and</strong> adequately target <strong>and</strong> maximize the distribution of<br />
public health resources (Lemon et al 2003). As a result, high risk populations are easily identified <strong>and</strong> resources<br />
allocated accordingly.<br />
Another strength of <strong>CART</strong> is that they are useful in messy situations <strong>and</strong> settings in which over fitting is not so<br />
problematic. As a result it is advised that they are used in areas where over fitting is not a problem.<br />
There are many physical <strong>and</strong> social interactions in epidemiologic data. <strong>CART</strong>s are capable of indentifying<br />
5


