Pipeline Failure Investigation Report - PHMSA - U.S. Department of ...
Pipeline Failure Investigation Report - PHMSA - U.S. Department of ...
Pipeline Failure Investigation Report - PHMSA - U.S. Department of ...

You also want an ePaper? Increase the reach of your titles
YUMPU automatically turns print PDFs into web optimized ePapers that Google loves.
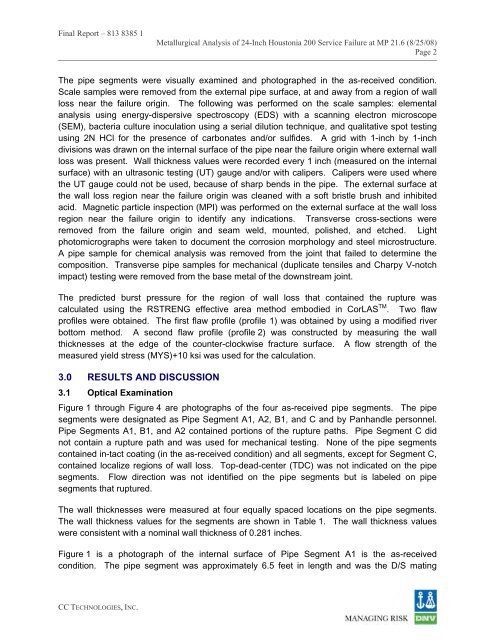
Final <strong>Report</strong> – 813 8385 1<br />
Metallurgical Analysis <strong>of</strong> 24-Inch Houstonia 200 Service <strong>Failure</strong> at MP 21.6 (8/25/08)<br />
Page 2<br />
The pipe segments were visually examined and photographed in the as-received condition.<br />
Scale samples were removed from the external pipe surface, at and away from a region <strong>of</strong> wall<br />
loss near the failure origin. The following was performed on the scale samples: elemental<br />
analysis using energy-dispersive spectroscopy (EDS) with a scanning electron microscope<br />
(SEM), bacteria culture inoculation using a serial dilution technique, and qualitative spot testing<br />
using 2N HCl for the presence <strong>of</strong> carbonates and/or sulfides. A grid with 1-inch by 1-inch<br />
divisions was drawn on the internal surface <strong>of</strong> the pipe near the failure origin where external wall<br />
loss was present. Wall thickness values were recorded every 1 inch (measured on the internal<br />
surface) with an ultrasonic testing (UT) gauge and/or with calipers. Calipers were used where<br />
the UT gauge could not be used, because <strong>of</strong> sharp bends in the pipe. The external surface at<br />
the wall loss region near the failure origin was cleaned with a s<strong>of</strong>t bristle brush and inhibited<br />
acid. Magnetic particle inspection (MPI) was performed on the external surface at the wall loss<br />
region near the failure origin to identify any indications. Transverse cross-sections were<br />
removed from the failure origin and seam weld, mounted, polished, and etched. Light<br />
photomicrographs were taken to document the corrosion morphology and steel microstructure.<br />
A pipe sample for chemical analysis was removed from the joint that failed to determine the<br />
composition. Transverse pipe samples for mechanical (duplicate tensiles and Charpy V-notch<br />
impact) testing were removed from the base metal <strong>of</strong> the downstream joint.<br />
The predicted burst pressure for the region <strong>of</strong> wall loss that contained the rupture was<br />
calculated using the RSTRENG effective area method embodied in CorLAS TM . Two flaw<br />
pr<strong>of</strong>iles were obtained. The first flaw pr<strong>of</strong>ile (pr<strong>of</strong>ile 1) was obtained by using a modified river<br />
bottom method. A second flaw pr<strong>of</strong>ile (pr<strong>of</strong>ile 2) was constructed by measuring the wall<br />
thicknesses at the edge <strong>of</strong> the counter-clockwise fracture surface. A flow strength <strong>of</strong> the<br />
measured yield stress (MYS)+10 ksi was used for the calculation.<br />
3.0 RESULTS AND DISCUSSION<br />
3.1 Optical Examination<br />
Figure 1 through Figure 4 are photographs <strong>of</strong> the four as-received pipe segments. The pipe<br />
segments were designated as Pipe Segment A1, A2, B1, and C and by Panhandle personnel.<br />
Pipe Segments A1, B1, and A2 contained portions <strong>of</strong> the rupture paths. Pipe Segment C did<br />
not contain a rupture path and was used for mechanical testing. None <strong>of</strong> the pipe segments<br />
contained in-tact coating (in the as-received condition) and all segments, except for Segment C,<br />
contained localize regions <strong>of</strong> wall loss. Top-dead-center (TDC) was not indicated on the pipe<br />
segments. Flow direction was not identified on the pipe segments but is labeled on pipe<br />
segments that ruptured.<br />
The wall thicknesses were measured at four equally spaced locations on the pipe segments.<br />
The wall thickness values for the segments are shown in Table 1. The wall thickness values<br />
were consistent with a nominal wall thickness <strong>of</strong> 0.281 inches.<br />
Figure 1 is a photograph <strong>of</strong> the internal surface <strong>of</strong> Pipe Segment A1 is the as-received<br />
condition. The pipe segment was approximately 6.5 feet in length and was the D/S mating<br />
CC TECHNOLOGIES, INC.