Chapter 7 Guide
Chapter 7 Guide
Chapter 7 Guide

You also want an ePaper? Increase the reach of your titles
YUMPU automatically turns print PDFs into web optimized ePapers that Google loves.
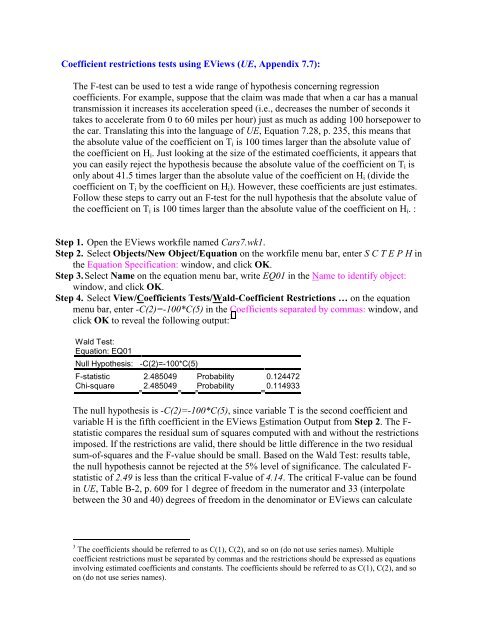
Coefficient restrictions tests using EViews (UE, Appendix 7.7):<br />
The F-test can be used to test a wide range of hypothesis concerning regression<br />
coefficients. For example, suppose that the claim was made that when a car has a manual<br />
transmission it increases its acceleration speed (i.e., decreases the number of seconds it<br />
takes to accelerate from 0 to 60 miles per hour) just as much as adding 100 horsepower to<br />
the car. Translating this into the language of UE, Equation 7.28, p. 235, this means that<br />
the absolute value of the coefficient on T i is 100 times larger than the absolute value of<br />
the coefficient on H i . Just looking at the size of the estimated coefficients, it appears that<br />
you can easily reject the hypothesis because the absolute value of the coefficient on T i is<br />
only about 41.5 times larger than the absolute value of the coefficient on H i (divide the<br />
coefficient on T i by the coefficient on H i ). However, these coefficients are just estimates.<br />
Follow these steps to carry out an F-test for the null hypothesis that the absolute value of<br />
the coefficient on T i is 100 times larger than the absolute value of the coefficient on H i . :<br />
Step 1. Open the EViews workfile named Cars7.wk1.<br />
Step 2. Select Objects/New Object/Equation on the workfile menu bar, enter S C T E P H in<br />
the Equation Specification: window, and click OK.<br />
Step 3. Select Name on the equation menu bar, write EQ01 in the Name to identify object:<br />
window, and click OK.<br />
Step 4. Select View/Coefficients Tests/Wald-Coefficient Restrictions … on the equation<br />
menu bar, enter -C(2)=-100*C(5) in the Coefficients separated by commas: window, and<br />
click OK to reveal the following output: 3<br />
Wald Test:<br />
Equation: EQ01<br />
Null Hypothesis: -C(2)=-100*C(5)<br />
F-statistic 2.485049 Probability 0.124472<br />
Chi-square 2.485049 Probability 0.114933<br />
The null hypothesis is -C(2)=-100*C(5), since variable T is the second coefficient and<br />
variable H is the fifth coefficient in the EViews Estimation Output from Step 2. The F-<br />
statistic compares the residual sum of squares computed with and without the restrictions<br />
imposed. If the restrictions are valid, there should be little difference in the two residual<br />
sum-of-squares and the F-value should be small. Based on the Wald Test: results table,<br />
the null hypothesis cannot be rejected at the 5% level of significance. The calculated F-<br />
statistic of 2.49 is less than the critical F-value of 4.14. The critical F-value can be found<br />
in UE, Table B-2, p. 609 for 1 degree of freedom in the numerator and 33 (interpolate<br />
between the 30 and 40) degrees of freedom in the denominator or EViews can calculate<br />
3 The coefficients should be referred to as C(1), C(2), and so on (do not use series names). Multiple<br />
coefficient restrictions must be separated by commas and the restrictions should be expressed as equations<br />
involving estimated coefficients and constants. The coefficients should be referred to as C(1), C(2), and so<br />
on (do not use series names).