Economy Profile: Burundi - Doing Business
Economy Profile: Burundi - Doing Business
Economy Profile: Burundi - Doing Business

You also want an ePaper? Increase the reach of your titles
YUMPU automatically turns print PDFs into web optimized ePapers that Google loves.
<strong>Doing</strong> <strong>Business</strong> 2013<br />
<strong>Burundi</strong><br />
10<br />
THE BUSINESS ENVIRONMENT<br />
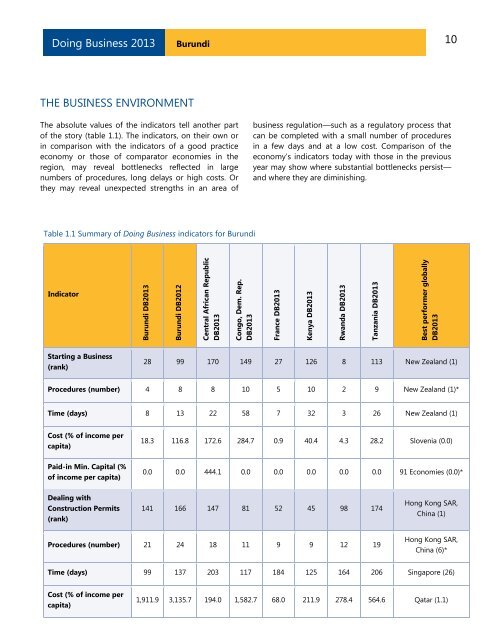
The absolute values of the indicators tell another part<br />
of the story (table 1.1). The indicators, on their own or<br />
in comparison with the indicators of a good practice<br />
economy or those of comparator economies in the<br />
region, may reveal bottlenecks reflected in large<br />
numbers of procedures, long delays or high costs. Or<br />
they may reveal unexpected strengths in an area of<br />
business regulation—such as a regulatory process that<br />
can be completed with a small number of procedures<br />
in a few days and at a low cost. Comparison of the<br />
economy’s indicators today with those in the previous<br />
year may show where substantial bottlenecks persist—<br />
and where they are diminishing.<br />
Table 1.1 Summary of <strong>Doing</strong> <strong>Business</strong> indicators for <strong>Burundi</strong><br />
Indicator<br />
<strong>Burundi</strong> DB2013<br />
<strong>Burundi</strong> DB2012<br />
Central African Republic<br />
DB2013<br />
Congo, Dem. Rep.<br />
DB2013<br />
France DB2013<br />
Kenya DB2013<br />
Rwanda DB2013<br />
Tanzania DB2013<br />
Best performer globally<br />
DB2013<br />
Starting a <strong>Business</strong><br />
(rank)<br />
28 99 170 149 27 126 8 113 New Zealand (1)<br />
Procedures (number) 4 8 8 10 5 10 2 9 New Zealand (1)*<br />
Time (days) 8 13 22 58 7 32 3 26 New Zealand (1)<br />
Cost (% of income per<br />
capita)<br />
18.3 116.8 172.6 284.7 0.9 40.4 4.3 28.2 Slovenia (0.0)<br />
Paid-in Min. Capital (%<br />
of income per capita)<br />
0.0 0.0 444.1 0.0 0.0 0.0 0.0 0.0 91 Economies (0.0)*<br />
Dealing with<br />
Construction Permits<br />
(rank)<br />
141 166 147 81 52 45 98 174<br />
Hong Kong SAR,<br />
China (1)<br />
Procedures (number) 21 24 18 11 9 9 12 19<br />
Hong Kong SAR,<br />
China (6)*<br />
Time (days) 99 137 203 117 184 125 164 206 Singapore (26)<br />
Cost (% of income per<br />
capita)<br />
1,911.9 3,135.7 194.0 1,582.7 68.0 211.9 278.4 564.6 Qatar (1.1)