Chapter 10: Education - Equality and Human Rights Commission
Chapter 10: Education - Equality and Human Rights Commission
Chapter 10: Education - Equality and Human Rights Commission
Create successful ePaper yourself
Turn your PDF publications into a flip-book with our unique Google optimized e-Paper software.
332<br />
<strong>Chapter</strong> <strong>10</strong>: <strong>Education</strong><br />
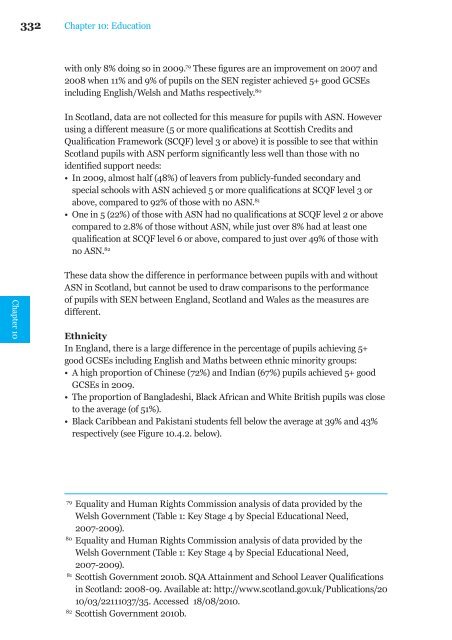
with only 8% doing so in 2009. 79 These figures are an improvement on 2007 <strong>and</strong><br />
2008 when 11% <strong>and</strong> 9% of pupils on the SEN register achieved 5+ good GCSEs<br />
including English/Welsh <strong>and</strong> Maths respectively. 80<br />
In Scotl<strong>and</strong>, data are not collected for this measure for pupils with ASN. However<br />
using a different measure (5 or more qualifications at Scottish Credits <strong>and</strong><br />
Qualification Framework (SCQF) level 3 or above) it is possible to see that within<br />
Scotl<strong>and</strong> pupils with ASN perform significantly less well than those with no<br />
identified support needs:<br />
• In 2009, almost half (48%) of leavers from publicly-funded secondary <strong>and</strong><br />
special schools with ASN achieved 5 or more qualifications at SCQF level 3 or<br />
above, compared to 92% of those with no ASN. 81<br />
• One in 5 (22%) of those with ASN had no qualifications at SCQF level 2 or above<br />
compared to 2.8% of those without ASN, while just over 8% had at least one<br />
qualification at SCQF level 6 or above, compared to just over 49% of those with<br />
no ASN. 82<br />
<strong>Chapter</strong> <strong>10</strong><br />
These data show the difference in performance between pupils with <strong>and</strong> without<br />
ASN in Scotl<strong>and</strong>, but cannot be used to draw comparisons to the performance<br />
of pupils with SEN between Engl<strong>and</strong>, Scotl<strong>and</strong> <strong>and</strong> Wales as the measures are<br />
different.<br />
Ethnicity<br />
In Engl<strong>and</strong>, there is a large difference in the percentage of pupils achieving 5+<br />
good GCSEs including English <strong>and</strong> Maths between ethnic minority groups:<br />
• A high proportion of Chinese (72%) <strong>and</strong> Indian (67%) pupils achieved 5+ good<br />
GCSEs in 2009.<br />
• The proportion of Bangladeshi, Black African <strong>and</strong> White British pupils was close<br />
to the average (of 51%).<br />
• Black Caribbean <strong>and</strong> Pakistani students fell below the average at 39% <strong>and</strong> 43%<br />
respectively (see Figure <strong>10</strong>.4.2. below).<br />
79<br />
<strong>Equality</strong> <strong>and</strong> <strong>Human</strong> <strong>Rights</strong> <strong>Commission</strong> analysis of data provided by the<br />
Welsh Government (Table 1: Key Stage 4 by Special <strong>Education</strong>al Need,<br />
2007-2009).<br />
80<br />
<strong>Equality</strong> <strong>and</strong> <strong>Human</strong> <strong>Rights</strong> <strong>Commission</strong> analysis of data provided by the<br />
Welsh Government (Table 1: Key Stage 4 by Special <strong>Education</strong>al Need,<br />
2007-2009).<br />
81<br />
Scottish Government 20<strong>10</strong>b. SQA Attainment <strong>and</strong> School Leaver Qualifications<br />
in Scotl<strong>and</strong>: 2008-09. Available at: http://www.scotl<strong>and</strong>.gov.uk/Publications/20<br />
<strong>10</strong>/03/2211<strong>10</strong>37/35. Accessed 18/08/20<strong>10</strong>.<br />
82<br />
Scottish Government 20<strong>10</strong>b.


