Chapter 10: Education - Equality and Human Rights Commission
Chapter 10: Education - Equality and Human Rights Commission
Chapter 10: Education - Equality and Human Rights Commission

Create successful ePaper yourself
Turn your PDF publications into a flip-book with our unique Google optimized e-Paper software.
<strong>Chapter</strong> <strong>10</strong>: <strong>Education</strong> 355<br />
When education levels <strong>and</strong> English as a first language are controlled for, some<br />
differences remain by ethnicity. Being in a Black or Asian ethnic group is strongly<br />
correlated with poorer literacy skills, in particular for women. Black men are more<br />
likely to lack basic numeracy skills than any other ethnic groups, or those with a<br />
learning disability. 148<br />
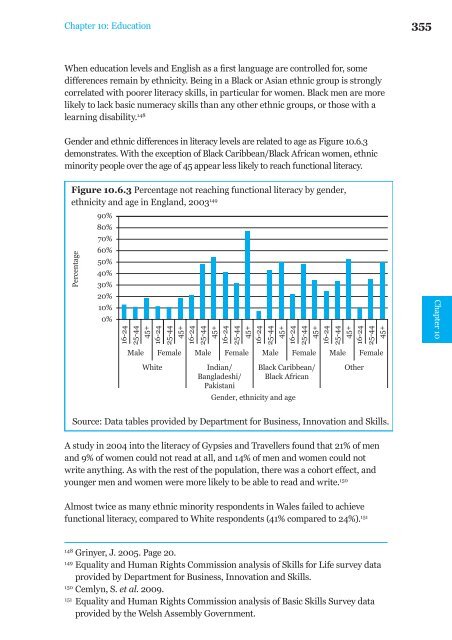
Gender <strong>and</strong> ethnic differences in literacy levels are related to age as Figure <strong>10</strong>.6.3<br />
demonstrates. With the exception of Black Caribbean/Black African women, ethnic<br />
minority people over the age of 45 appear less likely to reach functional literacy.<br />
Figure <strong>10</strong>.6.3 Percentage not reaching functional literacy by gender,<br />
ethnicity <strong>and</strong> age in Engl<strong>and</strong>, 2003 149<br />
Percentage<br />
90%<br />
80%<br />
70%<br />
60%<br />
50%<br />
40%<br />
30%<br />
20%<br />
<strong>10</strong>%<br />
0%<br />
16-24<br />
25-44<br />
45+<br />
16-24<br />
25-44<br />
45+<br />
16-24<br />
25-44<br />
45+<br />
16-24<br />
25-44<br />
45+<br />
16-24<br />
Male Female Male Female Male Female Male Female<br />
White<br />
Indian/<br />
Bangladeshi/<br />
Pakistani<br />
25-44<br />
45+<br />
16-24<br />
Gender, ethnicity <strong>and</strong> age<br />
25-44<br />
45+<br />
Black Caribbean/<br />
Black African<br />
16-24<br />
25-44<br />
45+<br />
16-24<br />
Other<br />
25-44<br />
45+<br />
<strong>Chapter</strong> <strong>10</strong><br />
Source: Data tables provided by Department for Business, Innovation <strong>and</strong> Skills.<br />
A study in 2004 into the literacy of Gypsies <strong>and</strong> Travellers found that 21% of men<br />
<strong>and</strong> 9% of women could not read at all, <strong>and</strong> 14% of men <strong>and</strong> women could not<br />
write anything. As with the rest of the population, there was a cohort effect, <strong>and</strong><br />
younger men <strong>and</strong> women were more likely to be able to read <strong>and</strong> write. 150<br />
Almost twice as many ethnic minority respondents in Wales failed to achieve<br />
functional literacy, compared to White respondents (41% compared to 24%). 151<br />
148<br />
Grinyer, J. 2005. Page 20.<br />
149<br />
<strong>Equality</strong> <strong>and</strong> <strong>Human</strong> <strong>Rights</strong> <strong>Commission</strong> analysis of Skills for Life survey data<br />
provided by Department for Business, Innovation <strong>and</strong> Skills.<br />
150<br />
Cemlyn, S. et al. 2009.<br />
151<br />
<strong>Equality</strong> <strong>and</strong> <strong>Human</strong> <strong>Rights</strong> <strong>Commission</strong> analysis of Basic Skills Survey data<br />
provided by the Welsh Assembly Government.