Appendix (PDF, 60 pages, 394KB) - Forfás
Appendix (PDF, 60 pages, 394KB) - Forfás
Appendix (PDF, 60 pages, 394KB) - Forfás

You also want an ePaper? Increase the reach of your titles
YUMPU automatically turns print PDFs into web optimized ePapers that Google loves.
FORFÁS ABSEI 2010<br />
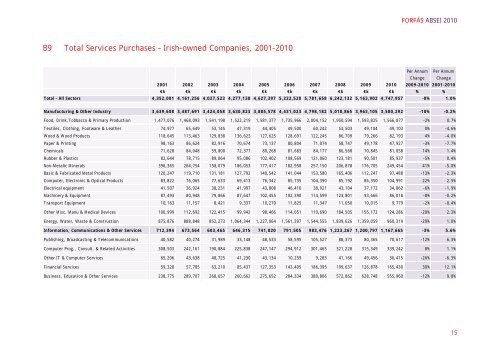
B9 Total Services Purchases – Irish-owned Companies, 2001-2010<br />
Per Annum<br />
Change<br />
2001 2002 2003 2004 2005 2006 2007 2008 2009 2010 2009-2010<br />
Per Annum<br />
Change<br />
2001-2010<br />
€k €k €k €k €k €k €k €k €k €k % %<br />
Total - All Sectors 4,352,001 4,161,256 4,027,523 4,277,138 4,627,397 5,222,528 5,781,658 6,242,132 5,163,902 4,747,957 -8% 1.0%<br />
Manufacturing & Other Industry 3,639,<strong>60</strong>8 3,487,691 3,424,058 3,630,823 3,885,578 4,431,023 4,798,182 5,018,865 3,963,105 3,580,292 -10% -0.2%<br />
Food, Drink,Tobbacco & Primary Production 1,477,076 1,468,093 1,541,198 1,522,219 1,581,377 1,735,966 2,004,152 1,950,594 1,593,825 1,566,877 -2% 0.7%<br />
Textiles, Clothing, Footware & Leather 74,977 65,649 53,145 47,319 44,405 49,500 <strong>60</strong>,242 53,503 49,104 49,103 0% -4.6%<br />
Wood & Wood Products 118,645 113,463 129,838 136,623 127,625 128,691 122,245 86,709 79,266 82,193 4% -4.0%<br />
Paper & Printing 98,163 86,624 82,916 70,674 73,137 80,804 71,074 58,747 49,178 47,927 -3% -7.7%<br />
Chemicals 71,628 84,048 59,800 72,377 80,268 81,683 84,177 86,568 70,845 81,058 14% 1.4%<br />
Rubber & Plastics 82,644 78,715 89,064 95,086 102,402 108,569 121,0<strong>60</strong> 123,181 90,501 85,937 -5% 0.4%<br />
Non-Metalic Minerals 396,365 264,754 158,079 186,053 177,417 182,958 257,150 206,878 176,705 249,454 41% -5.0%<br />
Basic & Fabricated Metal Products 120,247 119,710 131,181 127,792 140,542 141,044 153,580 165,406 112,247 97,488 -13% -2.3%<br />
Computer, Electronic & Optical Products 83,822 76,065 77,633 69,413 76,342 85,735 104,390 85,192 86,350 104,991 22% 2.5%<br />
Electrical equipment 41,507 36,924 38,231 41,997 43,808 46,410 38,921 43,104 37,172 34,862 -6% -1.9%<br />
Machinery & Equipment 87,493 80,948 79,866 87,647 102,455 102,390 114,599 123,801 93,666 86,018 -8% -0.2%<br />
Transport Equipment 10,163 11,157 8,421 9,337 10,270 11,825 11,347 11,050 10,015 9,779 -2% -0.4%<br />
Other Misc. Manu & Medical Devices 100,999 112,692 122,415 99,942 98,466 114,051 110,690 184,505 155,172 124,286 -20% 2.3%<br />
Energy, Water, Waste & Construction 875,876 888,848 852,273 1,064,344 1,227,064 1,561,397 1,544,555 1,839,626 1,359,059 9<strong>60</strong>,319 -29% 1.0%<br />
Information, Communications & Other Services 712,394 673,564 <strong>60</strong>3,465 646,315 741,820 791,505 983,476 1,223,267 1,200,797 1,167,665 -3% 5.6%<br />
Publishing, Broadcasting & Telecommunications 40,582 40,274 31,989 33,148 48,533 58,595 105,527 88,373 80,365 70,617 -12% 6.3%<br />
Computer Prog., Consult. & Related Activities 308,503 242,161 190,884 225,838 247,147 294,912 301,465 321,228 315,349 339,242 8% 1.1%<br />
Other IT & Computer Services 65,206 43,638 48,725 41,230 43,134 10,259 9,283 41,166 49,456 36,415 -26% -6.3%<br />
Financial Services 59,328 57,785 63,210 85,437 127,353 143,405 186,395 199,637 126,878 165,430 30% 12.1%<br />
Business, Education & Other Services 238,775 289,707 268,657 2<strong>60</strong>,662 275,652 284,334 380,806 572,862 628,748 555,9<strong>60</strong> -12% 9.8%<br />
15