Appendix (PDF, 60 pages, 394KB) - Forfás
Appendix (PDF, 60 pages, 394KB) - Forfás
Appendix (PDF, 60 pages, 394KB) - Forfás

Create successful ePaper yourself
Turn your PDF publications into a flip-book with our unique Google optimized e-Paper software.
FORFÁS ABSEI 2010<br />
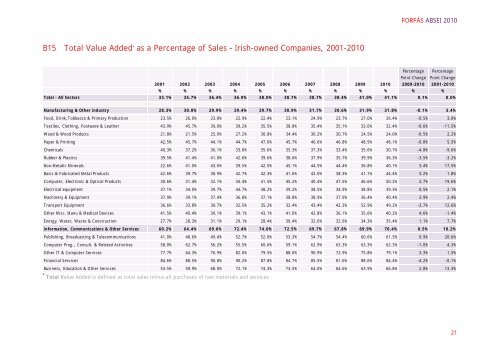
B15 Total Value Added * as a Percentage of Sales – Irish-owned Companies, 2001-2010<br />
2001 2002 2003 2004 2005 2006 2007 2008 2009 2010<br />
Percentage<br />
Point Change<br />
2009-2010<br />
Percentage<br />
Point Change<br />
2001-2010<br />
% % % % % % % % % % % %<br />
Total - All Sectors 33.1% 35.7% 36.4% 36.9% 38.0% 38.7% 38.7% 38.4% 41.0% 41.1% 0.1% 8.0%<br />
Manufacturing & Other Industry 28.3% 30.8% 29.9% 29.4% 29.7% 30.9% 31.7% 30.6% 31.9% 31.8% -0.1% 3.4%<br />
Food, Drink,Tobbacco & Primary Production 23.5% 26.0% 23.8% 22.9% 22.4% 23.1% 24.9% 23.7% 27.0% 26.4% -0.5% 3.0%<br />
Textiles, Clothing, Footware & Leather 43.9% 45.7% 39.0% 39.2% 35.5% 38.8% 35.4% 35.1% 33.0% 32.4% -0.6% -11.5%<br />
Wood & Wood Products 21.8% 21.5% 25.0% 27.2% 30.8% 34.4% 30.2% 30.7% 24.5% 24.0% -0.5% 2.2%<br />
Paper & Printing 42.5% 45.7% 44.1% 44.7% 47.0% 45.7% 46.6% 46.8% 48.9% 48.1% -0.8% 5.5%<br />
Chemicals 40.3% 37.2% 36.1% 33.8% 35.6% 35.3% 37.3% 33.4% 35.6% 30.7% -4.8% -9.6%<br />
Rubber & Plastics 39.5% 41.4% 41.0% 42.6% 39.6% 38.6% 37.9% 35.7% 39.9% 36.3% -3.5% -3.2%<br />
Non-Metalic Minerals 22.6% 41.0% 43.6% 39.5% 42.5% 45.1% 44.5% 44.4% 36.8% 40.1% 3.4% 17.5%<br />
Basic & Fabricated Metal Products 42.6% 39.7% 38.9% 42.7% 42.3% 41.6% 42.0% 38.3% 41.1% 44.4% 3.2% 1.8%<br />
Computer, Electronic & Optical Products 30.6% 31.4% 32.1% 34.4% 41.5% 45.2% 40.4% 47.5% 46.6% 50.2% 3.7% 19.6%<br />
Electrical equipment 37.1% 34.0% 39.7% 44.7% 38.2% 39.2% 38.5% 34.9% 38.8% 39.3% 0.5% 2.1%<br />
Machinery & Equipment 37.9% 39.1% 37.4% 36.8% 37.1% 38.8% 38.9% 37.9% 36.4% 40.4% 3.9% 2.4%<br />
Transport Equipment 36.6% 33.8% 30.7% 32.5% 35.2% 32.4% 43.4% 42.3% 52.9% 49.2% -3.7% 12.6%<br />
Other Misc. Manu & Medical Devices 41.5% 40.4% 39.1% 39.1% 43.1% 41.0% 42.8% 36.1% 35.6% 40.2% 4.6% -1.4%<br />
Energy, Water, Waste & Construction 27.7% 28.3% 31.1% 29.1% 28.4% 30.4% 32.6% 32.6% 34.3% 35.4% 1.1% 7.7%<br />
Information, Communications & Other Services <strong>60</strong>.2% 64.4% 69.6% 72.4% 74.0% 72.5% 69.7% 67.8% 69.9% 70.4% 0.5% 10.2%<br />
Publishing, Broadcasting & Telecommunications 41.0% 48.6% 49.4% 52.7% 52.0% 53.3% 54.7% 54.4% <strong>60</strong>.6% 61.5% 0.9% 20.6%<br />
Computer Prog., Consult. & Related Activities 58.0% 62.7% 56.2% 55.5% <strong>60</strong>.6% 59.1% 62.9% 63.3% 63.3% 62.3% -1.0% 4.3%<br />
Other IT & Computer Services 77.7% 64.3% 76.9% 82.0% 79.5% 88.0% 90.9% 72.9% 75.8% 79.1% 3.3% 1.5%<br />
Financial Services 84.6% 88.5% 90.8% 90.2% 87.8% 84.7% 85.5% 81.6% 88.6% 84.4% -4.2% -0.1%<br />
Business, Education & Other Services 53.5% 59.9% 68.0% 72.1% 74.3% 73.5% 64.0% 64.6% 63.9% 66.8% 2.8% 13.3%<br />
* Total Value Added is defined as total sales minus all purchases of raw materials and services<br />
21