Appendix (PDF, 60 pages, 394KB) - Forfás
Appendix (PDF, 60 pages, 394KB) - Forfás
Appendix (PDF, 60 pages, 394KB) - Forfás

You also want an ePaper? Increase the reach of your titles
YUMPU automatically turns print PDFs into web optimized ePapers that Google loves.
FORFÁS ABSEI 2010<br />
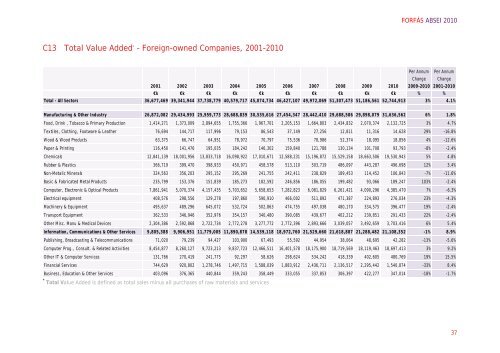
C13 Total Value Added * – Foreign-owned Companies, 2001-2010<br />
Per Annum<br />
Change<br />
2001 2002 2003 2004 2005 2006 2007 2008 2009 2010 2009-2010<br />
Per Annum<br />
Change<br />
2001-2010<br />
€k €k €k €k €k €k €k €k €k €k % %<br />
Total - All Sectors 36,677,469 39,341,944 37,738,779 40,579,717 45,074,734 46,427,107 49,972,069 51,307,473 51,186,561 52,744,913 3% 4.1%<br />
Manufacturing & Other Industry 26,872,082 29,434,993 25,959,773 28,688,839 30,535,616 27,454,347 28,442,410 29,688,586 29,898,079 31,636,562 6% 1.8%<br />
Food, Drink , Tobacco & Primary Production 1,414,271 1,373,009 2,894,655 1,755,366 1,967,701 2,205,153 1,664,803 2,434,832 2,070,374 2,132,725 3% 4.7%<br />
Textiles, Clothing, Footware & Leather 76,694 144,717 117,996 79,153 86,543 37,149 27,256 12,811 11,316 14,628 29% -16.8%<br />
Wood & Wood Products 63,375 66,747 64,951 78,972 70,797 75,536 78,986 52,374 18,095 18,856 4% -12.6%<br />
Paper & Printing 116,450 141,476 195,035 184,242 146,302 159,840 121,788 130,134 101,708 93,793 -8% -2.4%<br />
Chemicals 12,841,139 18,001,956 13,833,718 16,098,922 17,010,671 12,588,231 15,196,872 15,529,158 18,663,506 19,530,943 5% 4.8%<br />
Rubber & Plastics 366,719 399,470 398,933 450,971 458,578 513,110 503,719 486,097 443,287 496,698 12% 3.4%<br />
Non-Metalic Minerals 324,563 356,203 295,152 295,269 241,755 242,411 238,829 189,453 114,452 106,843 -7% -11.6%<br />
Basic & Fabricated Metal Products 235,799 153,376 151,839 185,273 182,592 246,856 186,055 199,482 93,066 189,247 103% -2.4%<br />
Computer, Electronic & Optical Products 7,861,941 5,070,374 4,157,435 5,703,652 5,658,653 7,282,823 6,081,829 6,261,421 4,090,296 4,385,470 7% -6.3%<br />
Electrical equipment 408,576 298,556 129,278 197,8<strong>60</strong> 590,910 466,002 511,892 471,387 224,893 276,034 23% -4.3%<br />
Machinery & Equipment 495,637 489,296 645,072 532,724 502,863 474,755 497,038 480,170 334,575 396,477 19% -2.4%<br />
Transport Equipment 362,533 346,946 352,976 354,157 340,480 390,085 439,677 402,212 239,851 291,433 22% -2.4%<br />
Other Misc. Manu & Medical Devices 2,304,386 2,592,868 2,722,734 2,772,278 3,277,772 2,772,396 2,893,666 3,039,057 3,492,659 3,703,416 6% 5.4%<br />
Information, Communications & Other Services 9,805,388 9,906,951 11,779,005 11,890,878 14,539,118 18,972,7<strong>60</strong> 21,529,6<strong>60</strong> 21,618,887 21,288,482 21,108,352 -1% 8.9%<br />
Publishing, Broadcasting & Telecommunications 71,020 79,239 94,427 103,900 67,493 55,592 44,954 38,064 48,695 42,282 -13% -5.6%<br />
Computer Prog., Consult. & Related Activities 8,454,877 8,2<strong>60</strong>,127 9,723,213 9,837,723 12,466,511 16,401,578 18,175,900 18,719,569 18,119,463 18,697,413 3% 9.2%<br />
Other IT & Computer Services 131,766 270,419 241,775 92,297 58,626 298,624 534,242 418,339 402,<strong>60</strong>5 480,769 19% 15.5%<br />
Financial Services 744,629 920,802 1,278,746 1,497,715 1,588,039 1,883,912 2,436,711 2,136,517 2,295,442 1,540,874 -33% 8.4%<br />
Business, Education & Other Services 403,096 376,365 440,844 359,243 358,449 333,055 337,853 306,397 422,277 347,014 -18% -1.7%<br />
* Total Value Added is defined as total sales minus all purchases of raw materials and services<br />
37