Appendix (PDF, 60 pages, 394KB) - Forfás
Appendix (PDF, 60 pages, 394KB) - Forfás
Appendix (PDF, 60 pages, 394KB) - Forfás

You also want an ePaper? Increase the reach of your titles
YUMPU automatically turns print PDFs into web optimized ePapers that Google loves.
FORFÁS ABSEI 2010<br />
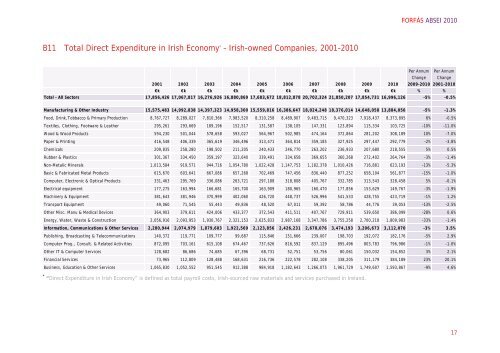
B11 Total Direct Expenditure in Irish Economy * – Irish-owned Companies, 2001-2010<br />
Per Annum<br />
Change<br />
2001 2002 2003 2004 2005 2006 2007 2008 2009 2010 2009-2010<br />
Per Annum<br />
Change<br />
2001-2010<br />
€k €k €k €k €k €k €k €k €k €k % %<br />
Total - All Sectors 17,856,426 17,067,817 16,276,926 16,880,869 17,683,672 18,812,878 20,702,324 21,850,207 17,854,731 16,996,126 -5% -0.5%<br />
Manufacturing & Other Industry 15,575,483 14,992,838 14,397,323 14,958,300 15,559,816 16,386,647 18,024,248 18,376,014 14,648,058 13,884,056 -5% -1.3%<br />
Food, Drink,Tobbacco & Primary Production 8,767,727 8,289,027 7,810,366 7,983,520 8,310,258 8,489,907 9,483,715 9,470,323 7,918,437 8,373,895 6% -0.5%<br />
Textiles, Clothing, Footware & Leather 295,261 293,669 189,196 152,517 131,587 138,105 147,331 123,894 115,334 103,725 -10% -11.0%<br />
Wood & Wood Products 594,230 501,044 578,658 593,027 564,967 502,985 474,164 372,864 281,202 308,189 10% -7.0%<br />
Paper & Printing 416,548 406,339 365,619 346,496 313,471 364,814 359,185 327,925 297,447 292,779 -2% -3.8%<br />
Chemicals 209,835 258,280 198,502 211,205 240,433 246,770 263,202 236,933 207,680 218,555 5% 0.5%<br />
Rubber & Plastics 301,367 334,450 359,197 323,640 339,491 334,658 369,655 3<strong>60</strong>,268 272,402 264,764 -3% -1.4%<br />
Non-Metalic Minerals 1,013,584 919,571 944,716 1,054,780 1,022,428 1,147,753 1,182,378 1,010,426 716,881 623,193 -13% -5.3%<br />
Basic & Fabricated Metal Products 615,670 <strong>60</strong>3,641 667,086 657,268 702,469 747,456 836,440 877,252 658,104 561,877 -15% -1.0%<br />
Computer, Electronic & Optical Products 331,463 295,769 336,086 263,721 297,188 318,808 405,767 332,785 313,543 328,458 5% -0.1%<br />
Electrical equipment 177,275 163,994 166,681 165,700 163,909 180,965 1<strong>60</strong>,470 177,856 153,629 149,767 -3% -1.9%<br />
Machinery & Equipment 381,643 381,946 370,999 402,0<strong>60</strong> 426,720 448,737 526,996 541,533 428,755 423,719 -1% 1.2%<br />
Transport Equipment 49,0<strong>60</strong> 71,545 55,443 49,836 48,520 67,011 59,392 58,786 44,776 39,053 -13% -2.5%<br />
Other Misc. Manu & Medical Devices 364,903 379,611 424,006 433,377 372,543 411,511 407,767 729,911 539,650 386,099 -28% 0.6%<br />
Energy, Water, Waste & Construction 2,056,916 2,093,953 1,930,767 2,321,153 2,625,833 2,987,168 3,347,786 3,755,258 2,700,218 1,809,983 -33% -1.4%<br />
Information, Communications & Other Services 2,280,944 2,074,979 1,879,<strong>60</strong>3 1,922,569 2,123,856 2,426,231 2,678,076 3,474,193 3,206,673 3,112,070 -3% 3.5%<br />
Publishing, Broadcasting & Telecommunications 140,372 119,771 109,777 99,687 115,846 151,666 239,007 198,703 192,072 182,176 -5% 2.9%<br />
Computer Prog., Consult. & Related Activities 872,095 703,161 615,108 674,467 737,626 816,592 837,129 895,496 803,783 796,986 -1% -1.0%<br />
Other IT & Computer Services 128,682 86,686 74,685 67,396 68,731 52,751 53,756 80,061 150,032 154,852 3% 2.1%<br />
Financial Services 73,965 112,809 128,488 168,631 216,736 222,578 282,108 338,205 311,179 384,189 23% 20.1%<br />
Business, Education & Other Services 1,065,830 1,052,552 951,545 912,388 984,918 1,182,643 1,266,075 1,961,729 1,749,<strong>60</strong>7 1,593,867 -9% 4.6%<br />
* “Direct Expenditure in Irish Economy” is defined as total payroll costs, Irish-sourced raw materials and services purchased in Ireland.<br />
17