Appendix (PDF, 60 pages, 394KB) - Forfás
Appendix (PDF, 60 pages, 394KB) - Forfás
Appendix (PDF, 60 pages, 394KB) - Forfás

You also want an ePaper? Increase the reach of your titles
YUMPU automatically turns print PDFs into web optimized ePapers that Google loves.
FORFÁS ABSEI 2010<br />
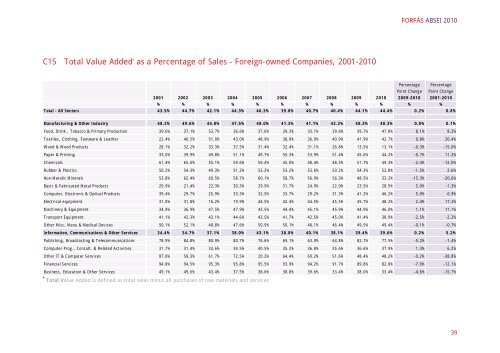
C15 Total Value Added * as a Percentage of Sales – Foreign-owned Companies, 2001-2010<br />
2001 2002 2003 2004 2005 2006 2007 2008 2009 2010<br />
Percentage<br />
Point Change<br />
2009-2010<br />
Percentage<br />
Point Change<br />
2001-2010<br />
% % % % % % % % % % % %<br />
Total - All Sectors 43.5% 44.7% 42.1% 44.3% 46.3% 39.8% 40.7% 40.4% 44.1% 44.4% 0.2% 0.8%<br />
Manufacturing & Other Industry 48.2% 49.6% 44.8% 47.5% 48.0% 41.3% 41.1% 42.2% 48.3% 48.3% 0.0% 0.1%<br />
Food, Drink , Tobacco & Primary Production 39.6% 37.1% 53.7% 36.6% 37.6% 39.3% 33.1% 39.6% 39.7% 47.8% 8.1% 8.2%<br />
Textiles, Clothing, Footware & Leather 22.4% 46.5% 51.0% 43.0% 48.9% 38.9% 36.0% 40.9% 41.9% 42.7% 0.8% 20.4%<br />
Wood & Wood Products 28.1% 32.2% 33.3% 37.5% 31.4% 32.4% 31.1% 26.8% 13.5% 13.1% -0.3% -15.0%<br />
Paper & Printing 33.0% 39.9% 49.8% 51.1% 49.7% 55.3% 53.9% 51.4% 45.0% 44.2% -0.7% 11.2%<br />
Chemicals 61.4% 65.0% 55.1% 59.6% 59.4% 45.0% 48.4% 48.5% 51.7% 49.3% -2.4% -12.0%<br />
Rubber & Plastics 50.2% 54.3% 49.3% 51.2% 53.2% 53.2% 53.6% 53.2% 54.3% 52.8% -1.5% 2.6%<br />
Non-Metalic Minerals 53.8% 62.4% <strong>60</strong>.5% 58.7% <strong>60</strong>.1% 58.7% 56.9% 56.3% 48.5% 33.2% -15.3% -20.6%<br />
Basic & Fabricated Metal Products 29.9% 21.4% 22.3% 30.3% 29.9% 31.7% 24.9% 22.9% 23.5% 28.5% 5.0% -1.3%<br />
Computer, Electronic & Optical Products 39.4% 29.7% 25.9% 33.3% 32.5% 33.7% 29.2% 31.3% 41.2% 46.2% 5.0% 6.9%<br />
Electrical equipment 31.0% 31.8% 16.2% 19.9% 44.5% 42.4% 44.5% 45.5% 45.7% 48.2% 2.4% 17.2%<br />
Machinery & Equipment 34.9% 36.9% 47.5% 47.9% 43.5% 44.4% 45.1% 45.9% 44.9% 46.0% 1.1% 11.1%<br />
Transport Equipment 41.1% 42.3% 43.1% 44.6% 42.5% 41.7% 42.5% 45.0% 41.4% 38.9% -2.5% -2.2%<br />
Other Misc. Manu & Medical Devices 50.1% 52.1% 48.8% 47.6% 50.9% 50.1% 48.1% 46.4% 49.5% 49.4% -0.1% -0.7%<br />
Information, Communications & Other Services 34.4% 34.7% 37.1% 38.0% 43.1% 38.0% 40.1% 38.1% 39.4% 39.6% 0.2% 5.2%<br />
Publishing, Broadcasting & Telecommunications 78.9% 84.8% 80.9% 80.7% 76.6% 69.1% 63.0% 64.8% 82.7% 77.5% -5.2% -1.4%<br />
Computer Prog., Consult. & Related Activities 31.7% 31.4% 33.6% 34.5% 40.5% 35.2% 36.8% 35.6% 36.6% 37.9% 1.3% 6.2%<br />
Other IT & Computer Services 87.0% 59.3% 61.7% 72.5% 20.2% 64.4% 69.2% 51.6% 48.4% 48.2% -0.2% -38.8%<br />
Financial Services 94.8% 94.5% 95.3% 95.8% 95.5% 93.9% 94.2% 91.7% 89.8% 82.8% -7.0% -12.1%<br />
Business, Education & Other Services 49.1% 49.6% 43.4% 37.5% 38.6% 38.8% 39.6% 33.4% 38.0% 33.4% -4.6% -15.7%<br />
* Total Value Added is defined as total sales minus all purchases of raw materials and services<br />
39