Appendix (PDF, 60 pages, 394KB) - Forfás
Appendix (PDF, 60 pages, 394KB) - Forfás
Appendix (PDF, 60 pages, 394KB) - Forfás

You also want an ePaper? Increase the reach of your titles
YUMPU automatically turns print PDFs into web optimized ePapers that Google loves.
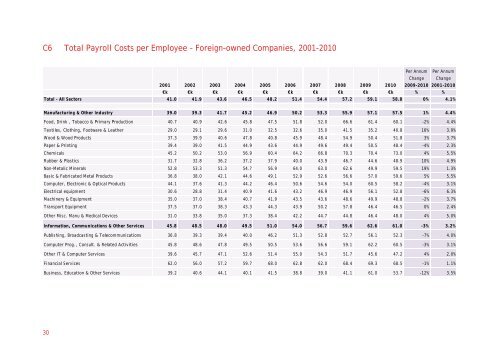
C6 Total Payroll Costs per Employee – Foreign-owned Companies, 2001-2010<br />
Per Annum<br />
Change<br />
2001 2002 2003 2004 2005 2006 2007 2008 2009 2010 2009-2010<br />
Per Annum<br />
Change<br />
2001-2010<br />
€k €k €k €k €k €k €k €k €k €k % %<br />
Total - All Sectors 41.0 41.9 43.6 46.5 48.2 51.4 54.4 57.2 59.1 58.8 0% 4.1%<br />
Manufacturing & Other Industry 39.0 39.3 41.7 45.2 46.9 50.2 53.3 55.9 57.1 57.5 1% 4.4%<br />
Food, Drink , Tobacco & Primary Production 40.7 40.9 42.6 45.8 47.5 51.8 52.0 66.6 61.4 <strong>60</strong>.1 -2% 4.4%<br />
Textiles, Clothing, Footware & Leather 29.0 29.1 29.6 31.0 32.5 32.6 35.0 41.5 35.2 40.8 16% 3.9%<br />
Wood & Wood Products 37.3 39.9 40.6 47.8 40.8 45.9 48.4 54.9 50.4 51.8 3% 3.7%<br />
Paper & Printing 39.4 39.0 41.5 44.9 43.6 44.9 49.6 49.4 50.5 48.4 -4% 2.3%<br />
Chemicals 45.2 50.2 53.0 56.9 <strong>60</strong>.4 64.2 66.8 70.3 70.4 73.0 4% 5.5%<br />
Rubber & Plastics 31.7 32.8 36.2 37.2 37.9 40.0 43.9 46.7 44.6 48.9 10% 4.9%<br />
Non-Metalic Minerals 52.8 53.3 51.3 54.7 56.9 64.0 63.0 62.6 49.9 59.5 19% 1.3%<br />
Basic & Fabricated Metal Products 36.8 38.0 42.1 44.6 49.1 52.9 52.6 56.6 57.0 59.6 5% 5.5%<br />
Computer, Electronic & Optical Products 44.1 37.6 41.3 44.2 46.4 50.6 54.6 54.0 <strong>60</strong>.5 58.2 -4% 3.1%<br />
Electrical equipment 30.6 28.8 31.4 40.9 41.6 43.2 46.9 46.9 56.1 52.8 -6% 6.3%<br />
Machinery & Equipment 35.0 37.0 38.4 40.7 41.9 43.5 43.6 48.6 49.9 48.8 -2% 3.7%<br />
Transport Equipment 37.5 37.0 38.3 43.3 44.3 43.9 50.2 57.8 46.4 46.5 0% 2.4%<br />
Other Misc. Manu & Medical Devices 31.0 33.8 35.0 37.3 38.4 42.2 44.7 44.8 46.4 48.0 4% 5.0%<br />
Information, Communications & Other Services 45.8 48.5 48.0 49.5 51.0 54.0 56.7 59.6 62.6 61.0 -3% 3.2%<br />
Publishing, Broadcasting & Telecommunications 36.8 39.3 39.4 40.0 46.2 51.3 52.8 52.7 56.1 52.3 -7% 4.0%<br />
Computer Prog., Consult. & Related Activities 45.8 48.6 47.8 49.5 50.5 53.6 56.6 59.1 62.2 <strong>60</strong>.5 -3% 3.1%<br />
Other IT & Computer Services 39.6 45.7 47.1 52.6 51.4 55.0 54.3 51.7 45.6 47.2 4% 2.0%<br />
Financial Services 62.0 56.0 57.2 59.7 68.0 62.8 62.0 68.4 69.3 68.5 -1% 1.1%<br />
Business, Education & Other Services 39.2 40.6 44.1 40.1 41.5 38.8 39.0 41.1 61.0 53.7 -12% 3.5%<br />
30