Tourism Statistics - Government of Botswana
Tourism Statistics - Government of Botswana
Tourism Statistics - Government of Botswana

You also want an ePaper? Increase the reach of your titles
YUMPU automatically turns print PDFs into web optimized ePapers that Google loves.
BOTSWANA<br />
STRENGTHENING TOURISM STATISTICS<br />
AND FORMULATION OF AN<br />
EXPERIMENTAL TSA - 2005/2006<br />
October 2007
0<br />
TABLE OF CONTENTS<br />
ABBREVIATIONS AND ACRONYMS ............................................................................................. 3<br />
ACKNOWLEDGEMENTS ................................................................................................................ 4<br />
EXECUTIVE SUMMARY ................................................................................................................. 6<br />
1. INTRODUCTION ...................................................................................................................... 8<br />
1.1 General Background for <strong>Botswana</strong> ............................................................................... 8<br />
1.2 General Background on <strong>Tourism</strong> Satellite Accounts .................................................. 8<br />
1.3 Introduction to the TSA Framework .............................................................................. 9<br />
1.4 TSA Outputs ..................................................................................................................... 9<br />
2. TOURISM CONSUMPTION IN BOTSWANA ........................................................................ 10<br />
2.1 General ........................................................................................................................... 10<br />
2.2 Inbound International Tourists ..................................................................................... 12<br />
2.3 Domestic Tourists ......................................................................................................... 19<br />
2.4 Resident Outbound Tourists ........................................................................................ 21<br />
2.5 Tables 2 to 4 in the TSA ................................................................................................ 21<br />
3. TOURISM SUPPLY IN BOTSWANA..................................................................................... 25<br />
3.1 General ........................................................................................................................... 25<br />
3.2 <strong>Tourism</strong> Characteristic Industries ............................................................................... 26<br />
3.3 Production Accounts .................................................................................................... 26<br />
4. ESTIMATION OF TOURISM VALUE ADDED .................................................................... 288<br />
4.1 Reconciliation <strong>of</strong> Supply and Demand ...................................................................... 288<br />
4.2 Measures <strong>of</strong> <strong>Tourism</strong> in <strong>Botswana</strong> .............................................................................. 28<br />
5. EMPLOYMENT AND NON-MONETARY INDICATORS ..................................................... 322<br />
5.1 <strong>Tourism</strong> Employment .................................................................................................. 322<br />
5.2 Non-Monetary Indicators ............................................................................................ 322<br />
6. CONCLUSIONS ..................................................................................................................... 34<br />
6.1 Contribution to the Economy ....................................................................................... 34<br />
6.2 Leakages and Linkages ................................................................................................ 34<br />
6.3 Conclusions on the TSA Process .............................................................................. 355<br />
6.4 The Way Forward ........................................................................................................... 36<br />
ANNEX 1: TERMS OF REFERENCE ............................................................................................ 37<br />
ANNEX 2: TSA DEFINITIONS ....................................................................................................... 38<br />
ANNEX 3: VISTOR SURVEYS ...................................................................................................... 41<br />
ANNEX 4: SAME-DAY VISITORS – INTERNATIONAL INBOUND ........................................... 455<br />
ANNEX 5: TOURISM CHARACTERISTIC PRODUCTS AND ACTIVITIES ................................. 49<br />
ANNEX 6: BASIC PRICES AND PURCHASERS’ PRICES ....................................................... 500<br />
ANNEX 7: SUPPLY AND USES OF GOODS AND SERVICES ................................................. 511<br />
ANNEX 8: DEFINITIONS IN TOURISM ...................................................................................... 522<br />
ANNEX 9: DETAILING THE DEFINITIONS ................................................................................ 533<br />
ANNEX 10: TRAVEL CREDIT & DEBIT ACCOUNT .................................................................... 54<br />
2
ABBREVIATIONS AND ACRONYMS<br />
BOB<br />
Bank <strong>of</strong> <strong>Botswana</strong><br />
COICOP Classification <strong>of</strong> Individual Consumption by Purpose<br />
CSO<br />
Central Statistical Office<br />
DOT<br />
Department <strong>of</strong> <strong>Tourism</strong><br />
GDP<br />
Gross Domestic Product<br />
GFCF Gross Fixed Capital Formation<br />
HATAB Hospitality and <strong>Tourism</strong> Association <strong>of</strong> <strong>Botswana</strong><br />
ISIC<br />
International Standard Industrial Classification <strong>of</strong> all Economic Activities<br />
NPISH Non Pr<strong>of</strong>it Institutions serving Households<br />
OECD Organisation for Economic Cooperation and Development<br />
RSU<br />
Research and <strong>Statistics</strong> Unit <strong>of</strong> the Department <strong>of</strong> <strong>Tourism</strong><br />
SNA 1993 System <strong>of</strong> National Accounts 1993<br />
TGDP <strong>Tourism</strong> Gross Domestic Product<br />
TOR<br />
Terms <strong>of</strong> Reference<br />
TVA<br />
<strong>Tourism</strong> Value Added<br />
UB<br />
University <strong>of</strong> <strong>Botswana</strong><br />
UNSC United Nations Statistical Commission<br />
UNDP United Nations Development Programme<br />
UNWTO United Nations World <strong>Tourism</strong> Organization<br />
WTTC World Travel and <strong>Tourism</strong> Council<br />
3
ACKNOWLEDGEMENTS<br />
The project team would like to express its sincere thanks and appreciation to the following for their<br />
valuable collaboration, guidance and support:<br />
Ministry <strong>of</strong> Environment, Wildlife and <strong>Tourism</strong>:<br />
H.E. Mr. Onkokame Kitso Mokaila, Honourable Minister<br />
Dr. Lucas P. Gakale, Permanent Secretary<br />
Mr. Edmont Bagaketse Moabi, Deputy Permanent Secretary<br />
Department <strong>of</strong> <strong>Tourism</strong>, Ministry <strong>of</strong> Environment, Wildlife and <strong>Tourism</strong>:<br />
Ms. Kelebaone G. Maselesele, Director <strong>of</strong> <strong>Tourism</strong><br />
A special word <strong>of</strong> thanks and praise should be accorded to Mrs. Temalo M. Lesetlhe, Director <strong>of</strong><br />
Research and <strong>Statistics</strong> Unit <strong>of</strong> the Department <strong>of</strong> <strong>Tourism</strong>, and her team, for all their hard work<br />
and assistance which culminated in this first TSA for <strong>Botswana</strong>.<br />
United Nations Development Programme:<br />
Ms. Viola Morgan, Resident Representative<br />
Mr. Sennye Obuseng, National Economist<br />
World <strong>Tourism</strong> Organization (UNWTO):<br />
Mr. Francesco Frangialli, Secretary-General<br />
Dr. Harsh Varma, Director <strong>of</strong> Development Assistance<br />
Ms Vanessa Satur, Project Coordinator, Department <strong>of</strong> Development Assistance<br />
The project was undertaken by the following consultants:<br />
Mr. Kevin Millington – Team Leader<br />
Mr. David McEwen – <strong>Statistics</strong> Expert<br />
Ms. Marion Libreros – TSA Expert<br />
Mr. Joe Heym – Database Expert<br />
4
Ngoma Causeway<br />
Photo 1: Cooperation between the Department <strong>of</strong> Immigration and the Research and <strong>Statistics</strong><br />
Unit <strong>of</strong> the Department <strong>of</strong> <strong>Tourism</strong> at Pioneer Gate – an illustration <strong>of</strong> the countrywide cooperation<br />
that took place in the UNDP/ UNWTO project.<br />
Photo 2: Interviewer Training at the Research and <strong>Statistics</strong> Unit <strong>of</strong> the Department <strong>of</strong> <strong>Tourism</strong> in<br />
Gaborone – an illustration <strong>of</strong> the substantial effort that has to be put into securing primary<br />
statistics. Trying to develop capacity to collect, compile and analyse primary statistics has been a<br />
focus <strong>of</strong> the UNDP/ UNWTO project.<br />
5
EXECUTIVE SUMMARY<br />
1. Introduction<br />
In 2004, a UNWTO executed project Strengthening <strong>Tourism</strong> <strong>Statistics</strong> in <strong>Botswana</strong> commenced.<br />
Its ultimate aim was to develop the first <strong>Tourism</strong> Satellite Account (TSA) for <strong>Botswana</strong>. However<br />
the TSA was not the only goal <strong>of</strong> this project. Over its duration the following significant milestones<br />
have been achieved:<br />
<br />
<br />
<br />
<br />
The process for measuring monthly accommodation statistics has been improved and<br />
upgraded. Data is now analysed and published within two months <strong>of</strong> the period for which<br />
it is collected.<br />
The annual visitor survey that is used to measure tourism expenditure has been improved<br />
to provide more useful information on the economic impact <strong>of</strong> tourism in <strong>Botswana</strong>.<br />
The national tourism statistics database has been revised to ensure it can process these<br />
statistics efficiently, and provide reports that are useful for all the relevant stakeholders. At<br />
the same time training has been provided in methods for extracting, processing and<br />
presenting tourism statistics.<br />
A five-year statistics bulletin for the period 2001-2005 was published.<br />
However, all <strong>of</strong> these procedures have also been implemented with the ultimate goal <strong>of</strong> developing<br />
<strong>Botswana</strong>‟s first TSA, following the principles set out in the UNWTO‟s System <strong>of</strong> <strong>Tourism</strong> <strong>Statistics</strong><br />
(STS).<br />
2. Recommended Methodological Framework (RMF) for the Experimental TSA<br />
With regard to this Experimental TSA, every attempt has been made to follow the concepts set out<br />
in the TSA: RMF published in 2001 by UNWTO et alia. It should be emphasised that the UNWTO‟s<br />
TSA: RMF focuses upon a statistical process involving the systematic collection and compilation <strong>of</strong><br />
primary statistics, including sample surveys. It does not focus on economic modelling aimed at<br />
using econometric equations for developing estimates <strong>of</strong> tourism statistics.<br />
The benefits <strong>of</strong> using a UNWTO statistical process are that it involves a large number <strong>of</strong><br />
institutions in <strong>Botswana</strong>, as well as individual pr<strong>of</strong>essionals within these institutions, cooperating<br />
and working together to attempt to build up a statistical database that will help with key economic<br />
decision-making for this important industry within <strong>Botswana</strong>. It is reasonable to say that the<br />
cooperation has been excellent, both with the Reference Group (DOT, Bank <strong>of</strong> <strong>Botswana</strong>, Central<br />
<strong>Statistics</strong> Office, and University <strong>of</strong> <strong>Botswana</strong>) and with others, e.g. HATAB (Hotel and <strong>Tourism</strong><br />
Association <strong>of</strong> <strong>Botswana</strong>).<br />
In this cooperative environment the UNWTO/UNDP project has attempted to build statistical<br />
capacity within the DOT with direct hands-on training. The intention, apart from trying to compile<br />
accurate, coherent and transparent statistics, is to set up the TSA as an ongoing work in progress<br />
that can be amended, modified, and enhanced to incorporate more economic information on<br />
tourism. Also, being a statistical process, it can be implemented by DOT and key collaborating<br />
institutes in <strong>Botswana</strong> directly, without the need for outside expertise, as would probably be<br />
necessary in an economic modelling process such as those used by other agencies.<br />
3. Key Statistical Inputs to the TSA<br />
The range <strong>of</strong> statistics that have been used as inputs into the TSA process has been extensive.<br />
The DOT has provided the Tourist Arrival <strong>Statistics</strong>, the <strong>Tourism</strong> Accommodation <strong>Statistics</strong>, and<br />
the Sample Surveys <strong>of</strong> Visitors, Tour Operators and <strong>Tourism</strong> Suppliers. The CSO has provided a<br />
very wide range <strong>of</strong> material from the National Accounts, the Household Income and Expenditure<br />
Surveys, the Labour <strong>Statistics</strong>, the Transport <strong>Statistics</strong>, the Foreign Trade <strong>Statistics</strong>, the Informal<br />
Sector Survey and the Social Accounting Matrices and others. The BOB has provided statistics on<br />
the travel and transport accounts and the Balance <strong>of</strong> Payments. Further data came from the<br />
6
<strong>Botswana</strong> Unified Revenue Service, HATAB, <strong>Government</strong> Budget and private sector<br />
organisations, and indeed some econometric information from outside <strong>Botswana</strong>.<br />
Despite this extensive range <strong>of</strong> statistics it has been necessary to work with anecdotal information<br />
as well, especially in relation to private sector activities. Where improvements could be made in<br />
forthcoming years are with respect to: -<br />
More statistical information on private sector activities, in particular the numbers <strong>of</strong><br />
tourists coming on package tours to <strong>Botswana</strong> would be helpful. Breakdowns on how<br />
part <strong>of</strong> the package tour price is spent in <strong>Botswana</strong> would also improve the TSA process.<br />
It is recommended that HATAB along with DOT be a key player in obtaining such<br />
information.<br />
Information on domestic tourism, not only by households (to be picked up next year by<br />
DOT in cooperation with CSO in a Household Survey) but also domestic tourism by<br />
<strong>Government</strong> staff and by businesses is needed. It is recommended that the DOT add an<br />
accommodation sample survey to their accommodation statistics process.<br />
It is recommended that the updating <strong>of</strong> the Social Accounting Matrix by the CSO be built<br />
into their programme. It is a major exercise but one that would be highly valuable for the<br />
TSA process, and one that could be achieved following the important sample surveys<br />
that are being carried out by CSO currently and in the next couple <strong>of</strong> years.<br />
4. TSA Outputs<br />
Following meetings with the Reference Group, it was decided to attempt an Experimental TSA for<br />
the Year 2005/2006 in order to try and make it as up-to-date as possible, taking into the account<br />
the good availability <strong>of</strong> National Accounting Data from the CSO. It is worth remarking that few<br />
countries, even statistically advanced countries, have attempted to bring the UNWTO TSA to so<br />
recent a date.<br />
The UNWTO TSA process is not in itself an economic impact/policy study. Its focus is on providing<br />
statistical input for economic decision-making with respect to the tourism sector. However, a few<br />
key observations can be made: -<br />
<strong>Tourism</strong>’s Contribution to GDP in <strong>Botswana</strong><br />
The TSA process indicates that TVA (<strong>Tourism</strong> Value Added) in 2005/2006 is around P1.9 billion.<br />
Comparisons with the Gross Value Added in the National Accounts for 2005/2006 <strong>of</strong> P54.8 billion<br />
(provisional figures) show that the Direct Contribution <strong>of</strong> the Tourist Expenditure (consumption) is<br />
around 3.4% to <strong>Botswana</strong>‟s GDP.<br />
It should be emphasised that this is the direct contribution and there are further indirect<br />
contributions that can arise from value added by suppliers to the tourism industry, who have no<br />
direct connection with the tourist, himself/herself.<br />
Indirect contribution can vary substantially, and can lie usually anywhere between 25% and 75% <strong>of</strong><br />
the direct contribution. If this were to apply in <strong>Botswana</strong>, it might be that the direct + indirect<br />
contribution would lie between 4.2% and 6.0%. These contributions relate to the impact <strong>of</strong> the<br />
expenditure/consumption.<br />
<strong>Tourism</strong> Employment in <strong>Botswana</strong><br />
CSO have indicated that the level <strong>of</strong> employment in the Hotels and Restaurants exceeds 11,000 in<br />
2004. Not all such employment is associated with tourism expenditure, but then expenditure by<br />
tourists outside <strong>of</strong> Hotels and Restaurants will broadly <strong>of</strong>fset the non-tourist expenditure.<br />
Employment at more than 11,000 is highly significant exceeding employment in Mining and<br />
Quarrying, in Transport and Communications, and in Finance.<br />
7
1. INTRODUCTION<br />
1.1 General Background for <strong>Botswana</strong><br />
<strong>Tourism</strong> is seen as an important sector in the economy <strong>of</strong> <strong>Botswana</strong> providing jobs, local incomes<br />
and making contributions to <strong>Government</strong> revenues. In recognition <strong>of</strong> this importance though<br />
lacking any objective measurement <strong>of</strong> it, the <strong>Government</strong> <strong>of</strong> <strong>Botswana</strong> decided to strengthen the<br />
process <strong>of</strong> collecting tourism statistics, and embarked upon measures to analyse the economic<br />
contribution <strong>of</strong> tourism with a view to underpinning a series <strong>of</strong> forthcoming strategies and policies<br />
for the development <strong>of</strong> tourism in the country.<br />
Central to this initiative has been the Research and <strong>Statistics</strong> Unit (RSU) <strong>of</strong> the Department <strong>of</strong><br />
<strong>Tourism</strong> (DOT). The RSU, as part <strong>of</strong> a UNDP/UNWTO project, has been strengthening the<br />
process <strong>of</strong> all the tourism statistics in <strong>Botswana</strong> including arrival statistics, accommodation<br />
statistics, statistics on visitors to the National Parks, sample surveys <strong>of</strong> visitors, and other surveys<br />
concerned with trying to improve the <strong>Government</strong>‟s understanding <strong>of</strong> the tourism industry.<br />
As a follow-on to the improvements in the tourism statistical processes, the DOT has taken the<br />
step <strong>of</strong> putting together this „Experimental <strong>Tourism</strong> Satellite Account‟, following the methodology<br />
recommended by the UNWTO and endorsed by the UN Statistical Commission, the Organisation<br />
for Economic Cooperation and Development (OECD) and the European Commission through<br />
Eurostat. The DOT has been assisted in this endeavour by a Reference Group within <strong>Botswana</strong><br />
that has included the Central <strong>Statistics</strong> Office (CSO), the Bank <strong>of</strong> <strong>Botswana</strong> (BOB), and the<br />
University <strong>of</strong> <strong>Botswana</strong> (UOB). Many other organisations within <strong>Botswana</strong> also contributed to the<br />
work, including the private sector. The efforts <strong>of</strong> so many organisations have been much<br />
appreciated by the DOT.<br />
1.2 General Background on <strong>Tourism</strong> Satellite Accounts<br />
Virtually all countries throughout the world have National Accounts in which the main economic<br />
aggregates have been measured/ estimated, such as, for example, Gross Domestic Product<br />
(GDP), value-added by different industries, intermediate consumption by different industries etc.<br />
However, such aggregation has not been possible for tourism within the National Accounts,<br />
although it is <strong>of</strong>ten done for hotels and restaurants, a key part <strong>of</strong> the tourism industries, because<br />
tourism is primarily a demand side phenomenon, that is determined by the expenditure associated<br />
to those identified as visitors whereas Value Added and GDP are measurements associated with<br />
productive activities. The concept <strong>of</strong> <strong>Tourism</strong> Satellite Accounts (TSA) was put forward to remedy<br />
this lack <strong>of</strong> economic data on tourism. In a TSA, demand/ consumption <strong>of</strong> tourism, a standard<br />
measurement <strong>of</strong> visitor expenditure, is identified, associated to the industries that serve them, and<br />
the value-added arising from that expenditure for the different industries that serve visitors can<br />
then be compiled and added together to establish tourism value added.<br />
The methodology for the TSA is set out in the UNWTO Manual known as TSA: RMF 2001 (RMF =<br />
Recommended Methodological Framework). Two key tenets <strong>of</strong> this methodology are, firstly, that a<br />
uniform methodology allows valid comparisons, enabling the tourism value-added to be compared<br />
with the value-added in other industries and also allowing comparisons with other countries to be<br />
made on a like-for-like basis. Secondly, a key tenet is that the information on demand by visitors<br />
(that can encompass both tourism products and non tourism products) is reconciled with the<br />
information on supply <strong>of</strong> these goods and services in the economy.<br />
In the course <strong>of</strong> this exercise the DOT has attempted to follow the general guidelines set out in the<br />
TSA: RMF, a Manual prepared under the auspices <strong>of</strong> the UNWTO which has given a forwardlooking<br />
guide for countries to follow in these endeavours.<br />
8
1.3 Introduction to the TSA Framework<br />
The conceptual framework <strong>of</strong> the TSA is set out in the TSA: RMF published by the UNWTO,<br />
OECD and the European Commission in 2001. Its key aspects are reiterated here and can be<br />
seen in detail in Chapter Four in the TSA: RMF document.<br />
The methodological framework for the elaboration <strong>of</strong> the TSA is made up <strong>of</strong> a set <strong>of</strong> definitions and<br />
classifications integrated into tables and organised in a logical consistent way. It allows the whole<br />
magnitude <strong>of</strong> tourism in both its aspects <strong>of</strong> demand and supply to be seen. The Ten Tables which<br />
comprise the satellite account are derived from or related to the tables <strong>of</strong> the 1993 SNA that<br />
concern the supply and use <strong>of</strong> goods and services. They are at the centre <strong>of</strong> international<br />
comparisons <strong>of</strong> the economic importance <strong>of</strong> tourism between economies.<br />
The minimal set <strong>of</strong> tables required to speak <strong>of</strong> a system <strong>of</strong> satellite accounts comprises Tables 1 to<br />
6 and Table 10. Accounts that concentrate solely on visitor consumption or solely on the supply by<br />
tourism industries and other industries do not qualify as tourism satellite accounts. At a minimum<br />
the TSA must include a detailed presentation <strong>of</strong> supply and consumption, in terms <strong>of</strong> goods and<br />
services consumed by visitors and the activities that produce them, as well as an overall<br />
confrontation <strong>of</strong> their corresponding aggregates, which is at the core <strong>of</strong> the TSA system.<br />
Figure 1.1 – The Ten Tables <strong>of</strong> the TSA<br />
Table 1<br />
Inbound<br />
Table 2<br />
Domestic<br />
Table 3<br />
Outbound<br />
Table 5<br />
Production<br />
Table 7<br />
Employment<br />
Table 8<br />
Capital<br />
Table 9<br />
Collective<br />
Table 10<br />
Indicators<br />
Table 4<br />
Internal<br />
Table 6<br />
Domestic<br />
Supply &<br />
Consumption<br />
1.4 TSA Outputs<br />
TSA: RMF suggests the following as a set <strong>of</strong> relevant indicators <strong>of</strong> the size <strong>of</strong> tourism in the<br />
economy:<br />
Internal tourism consumption (in cash and in kind);<br />
Value added <strong>of</strong> the tourism industries;<br />
<strong>Tourism</strong> value added; and<br />
<strong>Tourism</strong> GDP.<br />
<strong>Tourism</strong> value added and <strong>Tourism</strong> GDP provide measures <strong>of</strong> the economic importance <strong>of</strong> tourism<br />
in the same sense as the GDP <strong>of</strong> any productive activity does. They are indicators emanating from<br />
a reconciliation <strong>of</strong> tourism consumption and supply. Their values will depend in particular on the<br />
completeness <strong>of</strong> the scope <strong>of</strong> measurement <strong>of</strong> visitor consumption that a country adopts, and on<br />
the country‟s ability to assign visitor consumption to the industries that serve the visitors.<br />
9
2. TOURISM CONSUMPTION IN BOTSWANA<br />
2.1 General<br />
The TSA: RMF makes it very clear as to how visitors should be viewed. The visitor is a particular<br />
type <strong>of</strong> individual consumption unit, who is distinguished from other individuals by the fact that<br />
he/she is outside his/her usual environment and travels or visits a place for a purpose other than<br />
the exercise <strong>of</strong> an activity remunerated from within the place visited. Otherwise he/she behaves<br />
like an ordinary consumer, so that the characteristics <strong>of</strong> consumption activity described in the SNA<br />
1993 are also relevant for visitors. The distinction between a visitor and a non-visitor can be<br />
almost impossible to discern from the viewpoint <strong>of</strong> a supplier, and this is one <strong>of</strong> the key difficulties<br />
in compiling primary statistics for the TSA, that need to be based on information provided by the<br />
travellers themselves.<br />
Box 2.1: Concept <strong>of</strong> Usual Environment - UNWTO<br />
The concept <strong>of</strong> usual environment, and therefore tourism, has two dimensions. The first is<br />
frequency. Places which are frequently (on a routine basis) visited by a person are part <strong>of</strong> the<br />
usual environment <strong>of</strong> that person, even though these places may be located at a considerable<br />
distance from the place <strong>of</strong> residence. The second dimension is distance. Places located close to<br />
the place <strong>of</strong> residence are also part <strong>of</strong> the usual environment even though the actual spots are<br />
rarely visited. Therefore the usual environment consists <strong>of</strong> a certain area around the place <strong>of</strong><br />
residence plus all places visited rather frequently.<br />
…there is no single operational definition <strong>of</strong> „usual environment‟ that can be applied all over the<br />
world …. countries should look for a practical definition that excludes virtually all routine travel <strong>of</strong><br />
their residents and travel to places very close to the usual place <strong>of</strong> residence from tourism.<br />
Internal tourism consumption, that is the consumption activity <strong>of</strong> visitors within a country, includes<br />
the consumption <strong>of</strong> the following individuals:<br />
Inbound international visitors, staying overnight (and thus being international<br />
tourists) – travelling for the purposes <strong>of</strong> holiday, business, VFR and a number <strong>of</strong> other<br />
tourism purposes, but particularly excluding visitors being remunerated from within<br />
the country visited;<br />
Inbound international visitors, not staying overnight, and thus being same-day<br />
visitors, but nonetheless travelling outside their usual environment. However,<br />
individuals coming into the country in order to make purchases <strong>of</strong> goods to sell back<br />
in their country <strong>of</strong> origin should be excluded;<br />
Domestic visitors staying overnight - travelling for the purposes <strong>of</strong> holiday, business,<br />
VFR and a number <strong>of</strong> other tourism purposes. Visiting one‟s second home is seen as<br />
a tourism purpose;<br />
Domestic visitors, not staying overnight, and thus being same-day visitors, but<br />
nonetheless travelling outside their usual environment; and<br />
Residents on an outbound trip, who spend something within their country <strong>of</strong><br />
reference whilst being on an outbound trip – for example, pre-trip expenditure <strong>of</strong><br />
things to bring along or use on the trip, transportation using a resident carrier, using<br />
the services <strong>of</strong> a resident travel agency, etc.<br />
10
Internal tourism consumption is seen as including a number <strong>of</strong> categories <strong>of</strong> expenditure that will<br />
need to be estimated separately:<br />
Those acquired through direct expenditure by the visitors themselves;<br />
Those imputed to them (consumption for own final use);<br />
Those obtained from other institutional units as transfers in kind other than social<br />
transfers in kind;<br />
Those acquired as social transfers in kind from NPISH;<br />
Those acquired as social transfers in kind from the <strong>Government</strong>; and<br />
Those acquired for their benefit by businesses and that these businesses consider as<br />
part <strong>of</strong> their costs (intermediate consumption): transportation, accommodation costs<br />
paid for by businesses.<br />
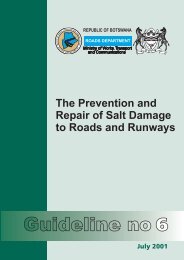
Measuring tourism within <strong>Botswana</strong> is a very substantial task because <strong>of</strong> the physical size <strong>of</strong> the<br />
country and the large number <strong>of</strong> border posts (for the measurement <strong>of</strong> international tourism). More<br />
than this, most <strong>of</strong> the border posts are road border posts involving a substantial level <strong>of</strong> cross<br />
border travel. Many <strong>Government</strong> Departments have had to contribute to this task <strong>of</strong> putting<br />
together tourism statistics.<br />
Figure 2.1: <strong>Botswana</strong> Border Posts<br />
11
Estimates <strong>of</strong> internal tourism consumption have been put together based upon:<br />
Inbound International Visitors;<br />
Domestic Tourists; and<br />
The domestic component <strong>of</strong> an outbound trip by <strong>Botswana</strong> residents.<br />
Each <strong>of</strong> these components is discussed in the following sub-sections.<br />
2.2 Inbound International Tourists<br />
The expenditure by Inbound International Tourists can be divided into:<br />
Expenditure by tourists themselves in <strong>Botswana</strong>, on which they can report;<br />
Acquisition <strong>of</strong> tourism and other services by Tour Operators spending in <strong>Botswana</strong> on<br />
behalf <strong>of</strong> tourists, from the money already paid to the tour operator (or travel agency, or<br />
ground operator) by the tourist as part <strong>of</strong> the package tour price; and<br />
Expenditure by Same-day visitors who are coming across the border and not staying the<br />
night.<br />
Each <strong>of</strong> these is reported upon in the next sub-sections. There are other expenditures that need to<br />
be estimated from other sources but these are not included for the time being.<br />
2.2.1 Direct Spending by Tourists themselves<br />
The Visitor Arrival <strong>Statistics</strong>, from CSO/DOT, based upon the entry/departure cards (E/D Cards)<br />
collected by the Department <strong>of</strong> Immigration at the border posts indicate the numbers <strong>of</strong> people<br />
entering and leaving <strong>Botswana</strong>. From this information tourist arrivals have to be derived, taking out<br />
returning residents and various other categories <strong>of</strong> border entrants that are not included in the<br />
Inbound Tourist statistics.<br />
Definitions <strong>of</strong> Basic <strong>Tourism</strong> Units (from UNWTO) are shown in<br />
Annex 8. Details <strong>of</strong> some <strong>of</strong> these definitions are given in Annex 9.<br />
This gives an indication <strong>of</strong> the complexities in deriving information<br />
on tourist arrivals.<br />
Since <strong>Botswana</strong> has a large number <strong>of</strong> road border posts (24) as<br />
well as several airports (4), the collection <strong>of</strong> such statistics is a<br />
major operation requiring considerable cooperation between<br />
several <strong>Government</strong> Departments.<br />
Cooperation has been good both, inter alia, for the collection <strong>of</strong><br />
tourist arrival statistics and for the visitor sample surveys carried<br />
out by DOT. The DOT published the tourism statistics for the<br />
period 2001 to 2005 in a publicly available document as shown in<br />
Figure 2.2.<br />
Figure 2.2 – <strong>Tourism</strong> <strong>Statistics</strong> Publication<br />
The tourist arrivals for 2001 – 2004 are shown in Table 2.1. A substantial increase in tourist<br />
arrivals in 2005 and in 2006 is anticipated. Provisional Figures for 2005 are 1.675 million. One<br />
cannot understate the significance <strong>of</strong> the two neighbouring countries <strong>of</strong> South Africa and<br />
Zimbabwe. An exceptional situation exists with Zimbabwe, generating travel that has a complex<br />
mix <strong>of</strong> motives. Numbers are large and most travel is through the border post <strong>of</strong> Ramokgwebana.<br />
The proximity <strong>of</strong> the major towns/ cities in South Africa such as Mafeking, and also Pretoria and<br />
Johannesburg, together with family ties and commercial ties across the borders, inevitably results<br />
in substantial international travel. This includes cross-border travel, some <strong>of</strong> which will be within<br />
the „usual environment‟ and thus should not be counted as tourism.<br />
12
Table 2.1: Tourist Arrivals by Country <strong>of</strong> Residence (Overnight Visitors)<br />
Residence 2001 2002 2003 2004<br />
Africa South Africa 557,747 527,505 514,708 626,207<br />
Zimbabwe 354,230 454,847 550,994 576,328<br />
Namibia 50,251 64,001 69,587 57,542<br />
Zambia 41,430 25,637 83,588 72,492<br />
Americas USA 21,619 16,322 15,087 17,670<br />
Canada 2,632 1,932 2,065 2,811<br />
Far East Australia 5,669 5,728 5,708 5,595<br />
Japan 3,144 2,281 2,492 2,518<br />
Europe UK 18,486 20,548 18,518 24,069<br />
Germany 9,170 9,985 10,444 9,685<br />
Netherlands 6,342 6,377 6,146 4,929<br />
France 4,381 3,596 3,732 3,989<br />
Italy 3,087 2,323 2,782 3,196<br />
Total 1,193,399 1,273,814 1,405,985 1,522,847<br />
Source: <strong>Tourism</strong> <strong>Statistics</strong> 2001-2005, Department <strong>of</strong> <strong>Tourism</strong><br />
Tourist arrivals give an indication <strong>of</strong> numbers coming into <strong>Botswana</strong> but these numbers have to be<br />
converted into tourist expenditure. This requires information on how long visitors are staying in<br />
<strong>Botswana</strong> and how much they are spending in <strong>Botswana</strong>, as well as a breakdown <strong>of</strong> what<br />
products they are spending on.<br />
Visitor Surveys play the key role in estimating this information (See Annex 3 – Visitor Surveys).<br />
Key information from the Visitor Surveys on these three variables is set out below.<br />
Average Length <strong>of</strong> Stay<br />
Because a total figure for tourist arrivals embraces such a wide range <strong>of</strong> different types <strong>of</strong> visitor,<br />
many <strong>of</strong> them undertaking different activities and staying for varying periods, it is best to try to<br />
segment this total in various ways. „Country <strong>of</strong> residence‟ and the „purpose <strong>of</strong> visit‟ have been<br />
looked at in particular. Average length <strong>of</strong> stay varies according to the purpose <strong>of</strong> visit. Examples<br />
include some transit visitors who are staying for only a<br />
night whilst holiday visitors can be staying for nearly six<br />
nights on average. For our reference year <strong>of</strong> 2005/2006<br />
an average for the length <strong>of</strong> stay between the sample<br />
survey data for the Year 2005 and the Year 2006, as<br />
shown in Annex 3 - Table A3.1, has been adopted.<br />
In order to use figures with a lower relative sampling<br />
error, the sample data has <strong>of</strong>ten been brought together<br />
into larger groupings. The relative sampling error (the<br />
standard error times 1.96 – 95% confidence level) has<br />
been calculated as a percentage <strong>of</strong> the arithmetic mean.<br />
Photo 3: Interviewing at Tlokweng Gate<br />
Average Direct Expenditure per Day<br />
Expenditure data has been gleaned from the DOT visitor surveys for 2005 and 2006. In a similar<br />
manner to the „length <strong>of</strong> stay‟, for our reference year <strong>of</strong> 2005/2006, An average for the „expenditure<br />
per day‟ between the sample survey data for the Year 2005 and the Year 2006 has been adopted.<br />
Using the „country <strong>of</strong> residence‟ and the „purpose <strong>of</strong> visit‟ as a way <strong>of</strong> segmenting the total figures<br />
allows one to take into account the considerable disparity in „length <strong>of</strong> stay‟ and „expenditure per<br />
day‟ between individual tourist arrivals. The base figures for expenditure per day are shown in<br />
Annex 3 - Table A3.2. Ideally it is „good practice‟ to focus upon expenditure with relative sampling<br />
errors below 25%, but this has not always been possible in this process.<br />
13
Total Direct Spending for Overnight Visitors in 2005/ 2006<br />
The Total Direct Spending by visitors for 2005/2006 is then estimated by multiplying the spend per<br />
day by the average length <strong>of</strong> stay by the number <strong>of</strong> tourist visitors. This total does not include the<br />
spending on their behalf by tour operators/ ground operators/ travel agents etc.<br />
Table 2.2: Total Direct Spending for Overnight Visitors in 2005/ 2006<br />
Total Number <strong>of</strong> Tourist Arrivals 2005/06 1,759,000<br />
Average Length <strong>of</strong> Stay<br />
5.3 nights<br />
Average Expenditure per Day 270<br />
Total Direct Expenditure P million 2517<br />
Source: Derived from DOT Arrival <strong>Statistics</strong> and Visitor Surveys<br />
The total direct spending is estimated at Pula 2,517 million for 2005/06.<br />
In reviewing the markets, as shown in Table 2.3 and Figure 2.2, the significance <strong>of</strong> the<br />
neighbouring countries is apparent, but the above figures do not include tour operator spending on<br />
behalf <strong>of</strong> tourists.<br />
Table 2.3: Total Direct Spending for Overnight Visitors in 2005/ 2006 by Market<br />
Country <strong>of</strong><br />
Residence<br />
Proportion <strong>of</strong><br />
Total<br />
Arrivals<br />
Average<br />
Length <strong>of</strong><br />
stay – Nights<br />
Average<br />
Direct<br />
Expenditure<br />
per day –<br />
Pula<br />
Total Direct<br />
Spend<br />
P Million<br />
Proportion <strong>of</strong><br />
total direct<br />
spend<br />
Australia 0.37% 8.5 580 31.9 1.3%<br />
France 0.26% 7.7 513 18.3 0.7%<br />
Germany 0.64% 7.8 474 41.6 1.7%<br />
Namibia 3.78% 3.6 279 66.1 2.6%<br />
South Africa 41.12% 3.6 333 872.9 34.9%<br />
UK 1.58% 8.2 567 128.4 5.1%<br />
USA 1.16% 8.8 591 106.7 4.3%<br />
Zambia 4.76% 5.0 408 170.9 6.8%<br />
Zimbabwe 37.85% 5.9 149 581.4 23.3%<br />
Other 8.49% 11.0 293 481.7 19.3%<br />
Total 100.00% 5.3 270 2,499.8 100.0%<br />
Adjustment 17<br />
Source: Derived from DOT Arrival <strong>Statistics</strong> and Visitor Surveys<br />
It is interesting to observe that although South Africa and Zimbabwe represent almost 80% <strong>of</strong><br />
arrivals, the percentage is much lower in terms <strong>of</strong> total direct spend (somewhat less than 60%),<br />
because their average length <strong>of</strong> stay and their average expenditure per day is notably lower.<br />
14
Figure 2.2 – Direct Expenditure by Source Market<br />
DIRECT EXPENDITURE FROM SOURCE MARKET<br />
Australia France Germany<br />
Namibia<br />
Other<br />
South Africa<br />
Zimbabw e<br />
Zambia<br />
USA<br />
UK<br />
Australia France Germany Namibia South Africa UK USA Zambia Zimbabw e Other<br />
Breakdown <strong>of</strong> the Visitor Spending<br />
Sample estimates <strong>of</strong> the breakdown <strong>of</strong> overnight visitor expenditure are obtained from DOT visitor<br />
surveys in 2005 and in 2006. The key feature <strong>of</strong> these breakdowns is that this is the expenditure<br />
by the tourist himself or herself.<br />
The breakdowns <strong>of</strong> expenditure and the figures adopted for 2005/2006 are shown in the Table 2.4<br />
below. These figures derive from the respondent‟s view on how much he spent on the different<br />
categories <strong>of</strong> expenditure.<br />
Table 2.4: Breakdown <strong>of</strong> the Direct Spending by Overnight Visitors in <strong>Botswana</strong> – 2005/06<br />
Adopted for<br />
2005/2006<br />
Direct Spend<br />
P millions<br />
Money Spent on Accommodation 33% 831<br />
Money Spent on Meals and Drink 11% 277<br />
Money Spent on Transport 7% 176<br />
Money Spent on Recreation 7% 176<br />
Money Spent on Shopping 16% 403<br />
Money Spent on 'Other' Spending 26% 654<br />
Total 100% 2,517<br />
Source: DOT Visitor Surveys<br />
15
Figure 2.3: Breakdown <strong>of</strong> the Direct Spending by Overnight Visitors in <strong>Botswana</strong> 2005/06<br />
26% Accommodation<br />
33%<br />
Meals & Drinks<br />
Local Transport<br />
Recreation<br />
Shopping<br />
16%<br />
11%<br />
'Other'<br />
7% 7%<br />
2.2.2 Adding Tour Operator Spending on Behalf <strong>of</strong> Tourists<br />
Expenditure by tour operators in <strong>Botswana</strong> on behalf <strong>of</strong> tourists is a part <strong>of</strong> overnight visitor<br />
expenditure (i.e. Inbound <strong>Tourism</strong> Expenditure) as required in Table 1 <strong>of</strong> the TSA. The TSA: RMF<br />
does not tabulate it as a separate component but as a part <strong>of</strong> overnight visitor expenditure.<br />
<strong>Botswana</strong> has developed a substantial tour operating business, much admired in other tourist<br />
destinations. Many leading tour operators in the country are members <strong>of</strong> HATAB (Hospitality and<br />
<strong>Tourism</strong> Association <strong>of</strong> <strong>Botswana</strong>), the coordinating body for the industry.<br />
Photo 4: Mowana Lodge – HATAB Forums<br />
Even though HATAB has some excellent<br />
industry forums (See Photo <strong>of</strong> Mowana Lodge<br />
Forum, April 2007), business statistics on the<br />
tour operating/ ground operating businesses<br />
are minimal. As a consequence, it has been<br />
necessary to put together a reasonable<br />
supposition based upon what information<br />
could be obtained from sample surveys (Visitor<br />
Surveys, Tour Operator Survey, Supplier<br />
Survey carried out by DOT) and from<br />
anecdotal information in order to reach<br />
estimates for the numbers <strong>of</strong> package tours<br />
and the subsequent spending by tour<br />
operators on behalf <strong>of</strong> tourists in <strong>Botswana</strong>.<br />
16
Adding in the Tour Operator Spending on behalf <strong>of</strong> tourists<br />
Separate estimates have been made for the tour operator spending on behalf <strong>of</strong> tourists, as shown<br />
in Table 2.5. These are added together with the direct spending by the tourist him/herself and this<br />
gives the totals in Table 2.6.<br />
Table 2.5: Breakdown <strong>of</strong> Spending in <strong>Botswana</strong> by the Tour Operator<br />
Percentage<br />
Breakdown<br />
Expenditure for<br />
2005/2006 P million<br />
Money Spent on Accommodation, Food and Drink 41% 197<br />
Money Spent on Local Transport 17% 82<br />
Money Spent on Recreation (e.g. Park Fees, inter alia) 9% 43<br />
Money Spent on 'Other' Spending 18% 87<br />
Mark-Up for Tour Operator for own costs 15% 72<br />
Total 100% 481<br />
Table 2.6: Total Spending 2005/2006 – Direct Tourist Spending plus Spending by Tour<br />
Operators on Tourists’ behalf<br />
Direct Spend<br />
P millions<br />
Tour Operator<br />
Spending<br />
P millions<br />
Total Spending<br />
P millions<br />
Money Spent on Accommodation 831 197 1,028<br />
Money Spent on Meals and Drink 277 277<br />
Money Spent on Transport 176 82 258<br />
Money Spent on Recreation 176 43 219<br />
Money Spent on Shopping 403 403<br />
Money Spent on 'Other' Spending 654 159 813<br />
Total 2,517 481 2,998<br />
A best estimate is that the total <strong>of</strong> tourist expenditure (staying overnight visitors) is around P 3<br />
billion in <strong>Botswana</strong> in 2005/2006.<br />
2.2.3 Same-Day Visitor Spending<br />
Same-day travel is important for <strong>Botswana</strong> but a good part <strong>of</strong> it will not be tourism. Rather it will be<br />
cross-border travel within the „usual environment‟. Details <strong>of</strong> the estimate are shown in Annex 4.<br />
The key feature <strong>of</strong> these breakdowns is that the Same-Day Visitors into <strong>Botswana</strong> are not<br />
spending on the usual tourism services – accommodation, meals and drinks, transport, recreation<br />
- or hardly at all. They are spending on „shopping‟ and on „other‟ items, which appear to<br />
encompass a whole range <strong>of</strong> other goods and services – see Table 2.7.<br />
Table 2.7: Breakdown <strong>of</strong> the Total Spending by Same-day visitors in 2005/ 2006<br />
Percent Total Spend<br />
P million<br />
Money Spent on Accommodation 2.5% 1.58<br />
Money Spent on Meals and Drink 3.3% 2.08<br />
Money Spent on Transport 2.5% 1.58<br />
Money Spent on Recreation 0.5% 0.32<br />
Money Spent on Shopping 63.2% 39.82<br />
Money Spent on 'Other' Spending 28.0% 17.64<br />
Total 100.0% 63.00<br />
17
Figure 2.4: Breakdown <strong>of</strong> the Same-day Visitor Spending in <strong>Botswana</strong> 2005/06<br />
DAY VISITOR EXPENDITURE BREAKDOWN<br />
28%<br />
3% 3% 3% 1%<br />
62%<br />
Money Spent on Accommodation<br />
Money Spent on Transport<br />
Money Spent on Shopping<br />
Money Spent on Meals and Drink<br />
Money Spent on Recreation<br />
Money Spent on 'Other' Spending<br />
Even though Same-day visitors are not staying the night, some do hire tourism accommodation for<br />
the day.<br />
The expenditure by the three components <strong>of</strong> Inbound International Tourists, namely:<br />
Expenditure by tourists themselves in <strong>Botswana</strong>;<br />
Tour Operators spending in <strong>Botswana</strong> on behalf <strong>of</strong> tourists; and<br />
Same-day visitors.<br />
Make up <strong>of</strong> Table 1 <strong>of</strong> the TSA, as shown below.<br />
Expenditure by others on their behalf and estimated services provided on own account (second<br />
homes) are not included.<br />
18
TSA TABLE 1- Inbound tourism consumption by products and categories <strong>of</strong> visitors –<br />
<strong>Botswana</strong> 2005/2006<br />
(visitor final consumption expenditure in cash) (net valuation) – P millions<br />
Same-day visitors Tourists Total visitors<br />
Products (1.1) (1.2)<br />
(1.3) = (1.1) +<br />
(1.2)<br />
A. Specific products<br />
A.1 Characteristic products<br />
Accommodation 2 1,028 1,030<br />
Food & Drink 2 277 279<br />
Transport 1 258 259<br />
Recreation 219 219<br />
Tour Operator (Margin) 72 72<br />
A.2 Connected products<br />
Shopping 40 403 443<br />
B. Non specific products<br />
Other Spending 18 741 759<br />
TOTAL 63 2,998 3,061<br />
number <strong>of</strong> trips 213,000 1,759,000<br />
Sources: Derived from DOT & CSO Arrival <strong>Statistics</strong>, DOT Visitor Surveys, Tour Operator Survey<br />
2.3 Domestic Tourists<br />
number <strong>of</strong> overnights 9,300,000<br />
Measuring Domestic <strong>Tourism</strong> Consumption requires considerable sample survey data upon<br />
household travel (making same-day trips, making tourist trips staying overnight, and making trips<br />
abroad whether same-day or staying). It also requires considerable data upon business travel by<br />
private sector companies and considerable information on travel by <strong>Government</strong> institutions<br />
including parastatals. Currently this information is not available in <strong>Botswana</strong>, though it is intended<br />
to extend the Household Survey next year (2008) to ascertain more information on residents‟<br />
travel habits. In the absence <strong>of</strong> this detailed information broad estimations <strong>of</strong> Domestic <strong>Tourism</strong><br />
Consumption from different sources have been put together, as proxies for the actual statistics.<br />
It is necessary to look at Domestic <strong>Tourism</strong> Consumption from three key sources, namely:<br />
Households;<br />
<strong>Government</strong> (Central and Local); and<br />
Businesses.<br />
Information from the following has been taken into account, namely the Household Income and<br />
Expenditure Surveys (HIES), the <strong>Government</strong> Budgets and the National Accounts Data.<br />
Overall, the HIES results in 2002/2003 do lead to the view that domestic household consumption<br />
<strong>of</strong> „hotels and restaurants‟ will be lower than the domestic consumption by businesses<br />
(intermediate consumption) and the domestic consumption by <strong>Government</strong>. This broadly confirms<br />
observation in tourism accommodation.<br />
There are no figures on <strong>Government</strong> Consumption <strong>of</strong> Hotels and tourism related products. Within<br />
the <strong>Government</strong> budget the following have been identified:<br />
(1) Internal Travel;<br />
(2) External Travel, and<br />
(3) Expenditure on Councils, Exhibitions and Conferences.<br />
19
Whilst P 0.9 billion is the <strong>Government</strong> budget for (1) and (3) above for 2006/2007, the precise<br />
content <strong>of</strong> this expenditure is not clear.<br />
Similarly with Businesses there is no allocation <strong>of</strong> intermediate consumption towards Hotels and<br />
Restaurants. Some 3% to 4% <strong>of</strong> intermediate consumption within the economy is not implausible.<br />
The balance between these different sources has been adapted from the Social Accounting Matrix<br />
for <strong>Botswana</strong> from 1996/97. There, the Absorption Matrix indicated that the total supply <strong>of</strong> the<br />
commodity, „Hotels and Restaurants‟ was used in the following manner: -<br />
Commodity Absorbed by: P million 1996/97 Percentage<br />
Households 59.0 11.8%<br />
Exports 210.9 42.3%<br />
Productive Activities – Intermediate Consumption 120.7 24.2%<br />
Central and Local <strong>Government</strong> 108.0 21.7%<br />
Total Output 498.6 100.0%<br />
Source: Social Accounting Matrix 1996/97<br />
The above has been adapted on anecdotal evidence to the figures below.<br />
Households Businesses <strong>Government</strong> Exports Total<br />
Breakdown 5.0% 28.0% 25.0% 42.0% 100.0%<br />
Turnover in<br />
Hotels and<br />
Restaurants P.<br />
million 204.1 1,143.0 1,020.6 1,714.5 4,082.2<br />
But only a proportion <strong>of</strong> this turnover is associated with tourism. Also the turnover has to be<br />
divided between hotels themselves and restaurants. There are number <strong>of</strong> guideposts to the<br />
possible scale and composition <strong>of</strong> components <strong>of</strong> the hotel and restaurant trade. These are: -<br />
The turnover established through the National Accounts procedures (P4.1 billion in<br />
2005/06);<br />
The balance between domestic arrivals and foreign arrivals at hotels (35:65 in 2005);<br />
The earnings that can be obtained from the capacity in tourism accommodation (nearly<br />
8,000 beds);<br />
The data from the <strong>Government</strong> Budget;<br />
Information on business operations; and<br />
Information on hotel and restaurant operations.<br />
In relation to the figure for hotel and restaurant turnover <strong>of</strong> more than P 4 billion in 2005/06, to find<br />
a reasonable fit with this information it has been necessary to assume that the hotel: restaurant<br />
split is around 39:61 and also to assume that the non-tourism component is up towards 20% for<br />
the hotels and over 70% for the restaurants.<br />
Putting together estimates such as these, which could be described as broadly plausible, is a<br />
temporary measure in order to find reasonable orders <strong>of</strong> magnitude. A key issue is that using<br />
information from both the demand side and the supply side compromises the independence <strong>of</strong> the<br />
approaches and any subsequent reconciliation <strong>of</strong> data on demand and supply. However in the<br />
absence <strong>of</strong> more information this has been necessary.<br />
20
2.4 Resident Outbound Tourists<br />
The information from the Bank <strong>of</strong> <strong>Botswana</strong> indicates the following for 2005/2006: -<br />
Period Travel P ‘000 Transport P ‘000<br />
Credit Debit Credit Debit<br />
2005 Q3 360,723 60,602 41,468 65,177<br />
Q4 383,770 75,184 61,726 506,248<br />
2006 Q1 15,703 71,992 64,941 71,441<br />
Q2 381,529 58,460 44,218 81,387<br />
Total 1,141,725 266,238 212,353 724,253<br />
Source: Bank <strong>of</strong> <strong>Botswana</strong><br />
Travel Credits totalled some P1.1 billion, and transport credits a further P 0.2 billion, making P1.4<br />
billion altogether. These figures reflect foreign transactions within the banking system. Because<br />
there are so many ways to make foreign exchange transactions, these figures tend to understate<br />
the inbound tourism expenditure. The figures since the Year 2000 are shown in Annex 10.<br />
For outbound tourism spending, the figures indicate more than P 0.9 billion <strong>of</strong> which the majority is<br />
in the transport account. The domestic component <strong>of</strong> spending on trips abroad appears unlikely to<br />
exceed a substantial percentage addition because <strong>Botswana</strong>‟s airlines tend to deal with domestic<br />
flights and short-haul international flights. Tour operations and travel agency operations (as<br />
margins) are relatively modest in volume for outbound tourism. As a notional order <strong>of</strong> magnitude<br />
for the domestic component <strong>of</strong> trips abroad, one may be talking <strong>of</strong> 5-10%. In the context <strong>of</strong> the<br />
figures above, An arbitrary figure has been used, making it the same as the tour operator margins<br />
on the inbound tourism expenditure (P 72 million).<br />
For the estimate <strong>of</strong> outbound tourism spending the BOB figures have been used from the debits<br />
for travel and transport as a broad order <strong>of</strong> magnitude, giving a figure <strong>of</strong> P 990 million.<br />
2.5 Tables 2 to 4 in the TSA<br />
In putting together Table 2, it has not been possible to make an estimate <strong>of</strong> same-day tourism<br />
domestic trips outside <strong>of</strong> the „usual environment‟.<br />
There is a lot <strong>of</strong> domestic travel in <strong>Botswana</strong>, because the population moves for the purpose <strong>of</strong><br />
finding work but is still travelling back to its traditional homelands or to see family and friends. The<br />
population does not see this travel as tourism. Given its frequency, it is questionable where to<br />
draw a line between what is tourism and what is not. Also some <strong>of</strong> the population own or rent a<br />
house where they work (e.g. Gaborone) but also have a house back in their home town or village.<br />
Going between their house in their home village and their house where they work is frequent but<br />
not seen as tourism by the local people.<br />
However, in terms <strong>of</strong> tourism analysis, the house in their home town or village to which they travel,<br />
frequently or not frequently, can be viewed as a second home. Visits to second homes are<br />
considered as tourism, irrespective <strong>of</strong> the distance to the usual place <strong>of</strong> residence and the<br />
frequency <strong>of</strong> the visit.<br />
A breakdown <strong>of</strong> domestic tourism expenditure beyond the spending in hotels and restaurants has<br />
not been possible. The balance between domestic expenditure on accommodation and on food<br />
and beverage reflects the significant level <strong>of</strong> travel to visit friends and relatives.<br />
With these reservations, estimates have been entered into Table 2 (Domestic <strong>Tourism</strong> Spending)<br />
and Table 3 (Resident Outbound <strong>Tourism</strong> Spending) and then adding together Tables 1 & 2, one<br />
obtains Table 4 which is described as Internal <strong>Tourism</strong> Consumption.<br />
21
TABLE 2 - Domestic tourism consumption by products and sets <strong>of</strong> resident visitors<br />
(visitor final consumption expenditure in cash) (net valuation)<br />
Pula millions 2005/06<br />
Products (2.1) (2.2)<br />
Resident visitors travelling<br />
to a different country(*)<br />
Resident visitors travelling<br />
only within the country <strong>of</strong><br />
reference<br />
Sameday<br />
Total<br />
Tourists<br />
visitors<br />
Sameday<br />
Tourists<br />
Total<br />
visitors<br />
Sameday<br />
visitors visitors Visitors<br />
(2.3) =<br />
(2.6) = (2.7) =<br />
(2.1) +<br />
(2.4) + (2.1) +<br />
(2.2) (2.4) (2.5) (2.5) 2.4)<br />
All resident visitors (**)<br />
Tourists<br />
(2.8) =<br />
(2.2) +<br />
(2.5)<br />
Total<br />
visitors<br />
(2.9) =<br />
(2.3) +<br />
(2.6)<br />
A. Specific products<br />
A.1 Characteristic<br />
products<br />
Accommodation 447 0 447<br />
Food & Drink 534 0 534<br />
Transport 0 0 0<br />
Recreation 0 0 0<br />
Tour Operator/Travel Agent<br />
(Margin) 0 72 72<br />
A.2 Connected products<br />
Shopping 0 0 0<br />
B. Non specific products<br />
Other 0 0 0<br />
TOTAL 981 72 1,053<br />
number <strong>of</strong> trips<br />
number <strong>of</strong> overnights<br />
22
TABLE 3 - Outbound tourism consumption by products and categories <strong>of</strong> visitors<br />
(visitor final consumption expenditure in cash) (net valuation)<br />
Pula millions 2005/06 Same-day Tourists Total visitors<br />
visitors<br />
Products (3.1) (3.2) (3.3)=(3.1)+(3.2)<br />
A. Specific products<br />
A.1 Characteristic products<br />
A.2 Connected products<br />
B. Non specific products<br />
TOTAL 990<br />
number <strong>of</strong> trips<br />
number <strong>of</strong> overnights<br />
23
TABLE 4 - Internal tourism consumption by products and types <strong>of</strong> tourism (net valuation)<br />
Pula millions 2005/06<br />
Visitors final consumption<br />
Other<br />
components<br />
Internal<br />
tourism<br />
expenditure<br />
in cash <strong>of</strong> visitors consumption<br />
Inbound<br />
tourism<br />
Domestic<br />
tourism<br />
Internal<br />
tourism Consumption<br />
(in cash and<br />
in kind)<br />
consumption consumption<br />
consumption<br />
in cash<br />
Products (4.1)* (4.2)**<br />
(4.1) + (4.2)<br />
= (4.3) (4.4)***<br />
(4.5) = (4.3)<br />
+ (4.4)<br />
A. Specific products<br />
A.1 Characteristic products<br />
Accommodation 1,030 447 1,477 1,477<br />
Food & Drink 279 534 813 813<br />
Transport 259 0 259 259<br />
Recreation 219 0 219 219<br />
Tour Operator (Margin) 72 72 144 144<br />
A.2 Connected products<br />
Shopping 443 0 443 443<br />
B. Non specific products<br />
Other 759 0 759 759<br />
TOTAL 3,061 1,053 4,114 4,114<br />
24
3. TOURISM SUPPLY IN BOTSWANA<br />
3.1 General<br />
<strong>Botswana</strong> has been fortunate in having an outstanding Central <strong>Statistics</strong> Office that has produced<br />
many exceptional surveys and ongoing statistics, giving a basis for considering the implementation<br />
<strong>of</strong> an Experimental <strong>Tourism</strong> Satellite Account. Important publications have included:<br />
National Accounts, both annual and quarterly<br />
Household Expenditure Surveys<br />
Informal Sector Survey<br />
Social Accounting Matrices<br />
Labour <strong>Statistics</strong><br />
Foreign Trade <strong>Statistics</strong><br />
When the work <strong>of</strong> the CSO is combined with the work <strong>of</strong> the Research and <strong>Statistics</strong> Unit <strong>of</strong> the<br />
Department <strong>of</strong> <strong>Tourism</strong> in providing primary statistics with respect to:<br />
Turning Border <strong>Statistics</strong> into <strong>Tourism</strong> Arrival <strong>Statistics</strong><br />
Accommodation <strong>Statistics</strong><br />
Visitor Sample Surveys<br />
Tour Operator Sample Survey<br />
Supplier Sample Survey<br />
Much <strong>of</strong> this work forms the basis for estimating the supply <strong>of</strong> tourism products and services.<br />
Table 3.1: National Accounts Data – Hotels and Restaurants<br />
NA Year Turnover Cost <strong>of</strong><br />
Sales<br />
Gross<br />
Output<br />
Intermediate<br />
Consumption<br />
Gross Value<br />
Added<br />
P Million (current prices)<br />
1993/94 308.6 73.4 235.2 65.8 169.5<br />
1994/95 366.4 45.9 320.5 126.5 194.0<br />
1995/96 449.5 89.2 360.3 116.0 244.3<br />
1996/97 585.4 109.5 475.9 159.3 316.6<br />
1997/98 721.8 122.9 599.0 210.6 388.3<br />
1998/99 859.9 159.3 700.6 235.6 465.0<br />
1999/00 1,086.9 201.3 885.5 303.6 581.9<br />
2000/01 1,172.7 213.3 959.4 310.6 648.7<br />
2001/02 1,392.5 247.0 1,145.5 394.1 751.4<br />
2002/03 2,194.2 534.2 1,660.1 551.1 1,108.9<br />
2003/04 2,707.0 839.1 1,867.9 620.1 1,247.7<br />
2004/05 2,739.0 839.9 1,899.1 630.5 1,268.6<br />
2005/06 4,082.2 1,224.7 2,857.5 948.7 1,908.8<br />
Source: CSO National Accounts<br />
25
3.2 <strong>Tourism</strong> Characteristic Industries<br />
The TSA: RMF sets out clearly the <strong>Tourism</strong> Characteristic Industries for which it is appropriate to<br />
present information on their production (See Annex 5). Such information is reliant upon two<br />
aspects:<br />
(1) The National Accounts relating to the different production industries; and<br />
(2) The details on tourist‟s expenditure in the appropriate product categories as shown in Annex 5,<br />
which itself is reliant upon the sample surveys undertaken.<br />
With these constraints it has been found necessary to limit the TSA to the main tourism industries,<br />
which were:<br />
<strong>Tourism</strong> collective accommodation (but not second homes);<br />
Restaurants and similar;<br />
Road Transport;<br />
Air Transport;<br />
Travel Agencies/ Tour Operators (margins); and<br />
Other industries.<br />
Lack <strong>of</strong> information on Second Homes used for tourism purposes in <strong>Botswana</strong> means that it is not<br />
possible to compile suitable statistics. Rail travel for tourism purposes is thought to be minimal.<br />
Water Travel is similarly minimal. For the other categories <strong>of</strong> either expenditure or industries,<br />
identifying these separately has not been possible, so they are put together in the category<br />
„others‟. In principle Goods should be treated separately from services: for goods (shopping) only<br />
the retail trade margin generates tourism value added, not the total value <strong>of</strong> the good purchased.<br />
3.3 Production Accounts<br />
The production accounts for the above six industries have been estimated by using the information<br />
available from the CSO, for the national accounts for 2005/2006. The CSO National Accounts give<br />
the key breakdowns into Intermediate Consumption and into Gross Value Added. Both Output and<br />
Gross Value Added are in Basic Prices. The difference between Basic Prices, Producer Prices and<br />
Purchasers‟ Prices is illustrated in Annex 6.<br />
The TSA: RMF recommends a specific format for Table 5 <strong>of</strong> the TSA, which sets out the<br />
production <strong>of</strong> products by the <strong>Tourism</strong> Characteristic Industries and then outlines the Inputs which<br />
will make up Intermediate Consumption, and then finally gives a breakdown <strong>of</strong> Gross Value Added<br />
into its components. (For the relationship between these macroeconomic aggregates, see Annex<br />
7)<br />
A key issue here is that a particular product can be produced by more than one industry, and <strong>of</strong><br />
course a tourism industry can produce products other than the product that is its typical output.<br />
Identifying and then measuring these different components is a critical task. Here in <strong>Botswana</strong> it<br />
has not been possible to identify these boundaries with clarity, and for this reason the gross<br />
figures <strong>of</strong> output for any industry may cover other products as well.<br />
Additionally, the output <strong>of</strong> any industry, even a tourism industry, is seldom consumed 100% by<br />
tourists. Except for the accommodation services for visitors, the bulk <strong>of</strong> the products go to nontourism<br />
use.<br />
In order to keep broad comparability with the National Accounts process, „Cost <strong>of</strong> Sales‟ has been<br />
included with Intermediate Consumption. The Production Accounts are in Table 5.<br />
26
TABLE 5 - Production accounts <strong>of</strong> tourism industries and other industries (net valuation)<br />
Pula Millions – 2005/06<br />
A. Specific products 1a<br />
Accommod<br />
ation<br />
Services in<br />
55<br />
T O U R I S M I N D U S T R I E S<br />
2 -<br />
Restaurants<br />
and similar<br />
4 - Road<br />
transport<br />
6 - Air<br />
transport<br />
8 – Travel<br />
agencies<br />
and similar<br />
TOTAL<br />
<strong>Tourism</strong><br />
Industries<br />
Other Non<br />
tourism<br />
Industries<br />
TOTAL output <strong>of</strong><br />
domestic producers<br />
(at basic prices)<br />
A.1 Characteristic products (5.1a) (5.2) (5.4) (5.6) (5.8) (5.13) (5.14) (5.15) = (5.13) +(5.14)<br />
1.1 – Hotels and other accommodate 1,480.4 0.0 0.0 0.0 0.0 1,480.4 0.0 1,480.4<br />
2 – Restaurants and similar 0.0 2,315.5 0.0 0.0 0.0 2,315.5 0.0 2,315.5<br />
3.2 Road passenger transport services 0.0 0.0 1,068.8 0.0 0.0 1,068.8 0.0 1,068.8<br />
3.4 Air passenger transport services 0.0 0.0 0.0 668.6 0.0 668.6 0.0 668.6<br />
4 – Travel agencies and similar 0.0 0.0 0.0 0.0 149.0 149.0 0.0 149.0<br />
B. Non specific products 52.1 81.5 6.5 5.4 0.0 145.4 89,921.7 90,067.1<br />
TOTAL output (at basic prices) 1,532.5 2,397.0 1,075.2 674.0 149.0 5,827.8 89,921.7 95,749.4<br />
Inputs - Direct Imports & Duties 137.7 328.0 274.5 154.6 16.7 911.4 8,343.9 9,255.3<br />
1. Agriculture, forestry and fishery products 0.8 2.0 0.0 0.0 0.0 2.8 984.9 987.7<br />
2. Ores and minerals 0.0 0.0 0.0 0.0 0.1 0.1 92.3 92.4<br />
3. Electricity, gas and water 28.0 68.9 4.6 2.6 1.7 105.7 716.4 822.1<br />
4. Manufacturing 124.6 381.1 82.9 76.0 2.7 667.3 2,582.9 3,250.2<br />
5. Construction work and construction 30.5 74.9 2.8 7.0 2.9 118.1 2,205.2 2,323.4<br />
6. Trade services, restaurants and hotel services 18.3 44.9 10.0 5.1 1.8 80.1 4,734.5 4,814.6<br />
7. Transport, storage and communication services 130.3 320.6 11.7 18.5 3.4 484.6 1,543.1 2,027.7<br />
8. Business services 121.0 297.7 7.8 90.1 5.1 521.6 2,162.6 2,684.2<br />
9. Community, social and personal services 6.5 16.0 89.6 27.5 1.4 140.9 684.3 825.2<br />
Total intermediate consumption (purchasers pr.) 597.7 1,534.1 483.9 381.4 35.7 3,032.7 24,050.1 27,082.8<br />
Wholesale and Retail - Cost <strong>of</strong> Sales 18,956.6 18,956.6<br />
Total gross value added (at basic prices) 934.8 862.9 591.4 292.7 113.3 2,795.1 46,915.0 49,710.1<br />
Compensation <strong>of</strong> employees 175.7 198.6 236.2 86.5 33.4 730.5 13,000.9 13,731.4<br />
Other taxes less subsidies on production 0.7 0.5 5.5 0.0 -4.2 2.4 -1.7 0.7<br />
Depreciation 46.7 34.5 409.6 107.0 26.9 624.8 5,976.3 6,601.1<br />
Gross Operating surplus (including Mixed Income) 711.4 629.1 -59.6 99.1 57.2 1,437.1 27,939.3 29,376.4<br />
Adjustment 0.3 0.3 -0.3 0.0 0.0 0.2 0.3 0.5<br />
27
4. ESTIMATION OF TOURISM VALUE ADDED<br />
4.1 Reconciliation <strong>of</strong> Supply and Demand<br />
At the very heart <strong>of</strong> the TSA process, as recommended in the TSA: RMF is the concept <strong>of</strong><br />
reconciling demand and supply. This is a powerful concept that attempts to improve both the<br />
collection and compilation <strong>of</strong> statistics as well as improving the analyses that are necessary to<br />
achieve it. It introduces an exemplary rigour into the process <strong>of</strong> using tourism statistics for<br />
economic analyses.<br />
The TSA: RMF again recommends a format for Table 6 which brings together this reconciliation.<br />
The key process for bringing about the reconciliation is „Internal <strong>Tourism</strong> Consumption‟, as<br />
measured in Table 4, and the tourism share <strong>of</strong> the production <strong>of</strong> products as indicated in Table 6,<br />
as shown in the following pages. Ideally, these two measures should be entirely independent <strong>of</strong><br />
each other.<br />
TSA:RMF suggests the following as a set <strong>of</strong> relevant indicators <strong>of</strong> the size <strong>of</strong> tourism in the<br />
economy:<br />
Internal tourism consumption (in cash and in kind);<br />
Value added <strong>of</strong> the tourism industries;<br />
<strong>Tourism</strong> value added; and<br />
<strong>Tourism</strong> GDP.<br />
4.2 Measures <strong>of</strong> <strong>Tourism</strong> in <strong>Botswana</strong><br />
Internal <strong>Tourism</strong> Consumption has been estimated in Table 4, and gives a figure <strong>of</strong> around P<br />
4.1 billion. It is necessary to emphasise that this figure is mostly related to tourists. It combines<br />
international inbound tourism (both overnight visitors and same-day visitors) and domestic tourists<br />
(both overnight visitors and same-day visitors) who are travelling outside their usual environment.<br />
It also includes the domestic component <strong>of</strong> an outbound trip by a <strong>Botswana</strong> resident. The statistics<br />
are minimal upon some elements <strong>of</strong> „Internal <strong>Tourism</strong> Consumption‟. It is reasonable to suggest<br />
that P4.1 billion is a conservative figure for <strong>Botswana</strong>.<br />
Value Added <strong>of</strong> the <strong>Tourism</strong> Industries (VATI) is shown in Table 5. It is P2.8 billion at Basic<br />
Prices. This estimate is limited to the five industries that have been identified as <strong>Tourism</strong><br />
Industries. If figures for more <strong>Tourism</strong> Industries were identifiable, then the Value added <strong>of</strong> the<br />
<strong>Tourism</strong> Industries would be higher. On the other hand these <strong>Tourism</strong> Industries do supply many<br />
products to persons who are not visitors, so the total Value Added <strong>of</strong> the <strong>Tourism</strong> Industries has<br />
these different elements which mean that precisely what is included has to be taken into account<br />
when using these measures for economic decision-making.<br />
<strong>Tourism</strong> Value Added (TVA) is estimated in Table 6. The figure is around P 1.9 billion which is<br />
the direct impact <strong>of</strong> tourism spending. It is the gross value added in Basic Prices by the actual<br />
tourism expenditure (or consumption). It does not take into account indirect effects or induced<br />
effects.<br />
<strong>Tourism</strong> GDP (TGDP) is measured in market prices and involves adding back in product taxes. It<br />
will be broadly higher than the TVA.<br />
28
TABLE 6 - Domestic Supply and Internal <strong>Tourism</strong> Consumption by Products (net valuation)<br />
Page 1 <strong>of</strong> 3<br />
Pula million 2005/06<br />
A. Specific products<br />
A.1 Characteristic products<br />
1a<br />
Accommodation<br />
Services in 55<br />
Output<br />
(5.1a)<br />
<strong>Tourism</strong><br />
share<br />
2 - Restaurants<br />
and similar<br />
Output<br />
(5.2)<br />
<strong>Tourism</strong><br />
share<br />
Output<br />
(5.4)<br />
4 - Road<br />
transport<br />
<strong>Tourism</strong><br />
share<br />
6 - Air transport<br />
Output<br />
(5.6)<br />
<strong>Tourism</strong><br />
share<br />
1 – Accommodation services<br />
for visitors<br />
1.1 – Hotels and other<br />
1480.4 1228.7 0.0 0.0 0.0 0.0 0.0 0.0<br />
accommodation services<br />
2 – Restaurants and similar 0.0 0.0 2315.5 509.4 0.0 0.0 0.0 0.0<br />
3 – Transport services<br />
3.2 Road transport services 0.0 0.0 0.0 0.0 1068.8 106.9 0.0 0.0<br />
3.4 Air transport services 0.0 0.0 0.0 0.0 0.0 0.0 668.6 635.2<br />
4 – Travel agencies and<br />
similar<br />
Reservation services (1)(2) 0.0 0.0 0.0 0.0 0.0 0.0 0.0 0.0<br />
B. Non specific products<br />
Services/ Goods (3) 52.1 43.2 81.5 17.9 6.5 0.6 5.4 5.1<br />
TOTAL output (at basic prices) 1532.5 1272.0 2397.0 527.3 1075.2 107.5 674.0 640.3<br />
Direct Imports & Duties 137.7 114.3 328.0 72.2 274.5 27.4 154.6 146.9<br />
1. Agriculture, forestry and<br />
0.8 0.7 2.0 0.4 0.0 0.0 0.0 0.0<br />
fishery products<br />
2. Ores and minerals 0.0 0.0 0.0 0.0 0.0 0.0 0.0 0.0<br />
3. Electricity, gas and water 28.0 23.3 68.9 15.2 4.6 0.5 2.6 2.4<br />
4. Manufacturing 124.6 103.4 381.1 83.8 82.9 8.3 76.0 72.2<br />
5. Construction work and<br />
construction<br />
6. Trade services, restaurants<br />
and hotel services<br />
7. Transport, storage and<br />
communication services<br />
30.5 25.3 74.9 16.5 2.8 0.3 7.0 6.7<br />
18.3 15.2 44.9 9.9 10.0 1.0 5.1 4.9<br />
130.3 108.2 320.6 70.5 11.7 1.2 18.5 17.6<br />
8. Business services 121.0 100.4 297.7 65.5 7.8 0.8 90.1 85.6<br />
9. Community, social and<br />
personal services<br />
Total intermediate<br />
consumption (at purchasers<br />
price)<br />
6.5 5.4 16.0 3.5 89.6 9.0 27.5 26.1<br />
597.7 496.1 1534.1 337.5 483.9 48.4 381.4 362.3<br />
Total gross value added <strong>of</strong><br />
activities (at basic prices)<br />
934.8 775.9 862.9 189.8 591.4 59.1 292.7 278.0<br />
Compensation <strong>of</strong> employees 175.7 145.9 198.6 43.7 236.2 23.6 86.5 82.2<br />
Other taxes less subsidies on<br />
0.7 0.5 0.5 0.1 5.5 0.5 0.0 0.0<br />
production<br />
Depreciation 46.7 38.8 34.5 7.6 409.6 41.0 107.0 101.7<br />
Gross Operating<br />
711.4 590.5 629.1 138.4 -59.6 -6.0 99.1 94.2<br />
surplus(incl.mixed in.)<br />
Adjustment 0.3 0.2 0.3 0.1 -0.3 0.0 0.0 0.0<br />
29
TABLE 6 - Domestic Supply and Internal <strong>Tourism</strong> Consumption by Products (net valuation)<br />
Page 2 <strong>of</strong> 3<br />
Pula millions 2005/06<br />
A. Specific products<br />
A.1 Characteristic products<br />
1 – Accommodation services for<br />
visitors<br />
1.1 – Hotels and other<br />
accommodation services<br />
8 - Travel<br />
agencies and<br />
similar<br />
Output<br />
(5.8)<br />
<strong>Tourism</strong><br />
share<br />
TOTAL <strong>Tourism</strong><br />
Industries<br />
Output<br />
(5.13)<br />
<strong>Tourism</strong><br />
share<br />
Other Industries<br />
Output<br />
(5.14)<br />
<strong>Tourism</strong><br />
share<br />
TOTAL output <strong>of</strong><br />
domestic<br />
producers (at<br />
basic prices)<br />
Output<br />
(5.15)<br />
<strong>Tourism</strong><br />
share<br />
0.0 0.0 1480.4 1228.7 0.0 0.0 1480.4 1228.7<br />
2 – Restaurants and similar 0.0 0.0 2315.5 509.4 0.0 0.0 2315.5 509.4<br />
3 – Transport services<br />
3.2 Road transport services 0.0 0.0 1068.8 106.9 0.0 0.0 1068.8 106.9<br />
3.4 Air transport services 0.0 0.0 668.6 635.2 0.0 0.0 668.6 635.2<br />
4 – Travel agencies and similar<br />
Reservation services (1) (2) 149.0 149.0 149.0 149.0 0.0 0.0 149.0 149.0<br />
B. Non specific products<br />
Services/ Goods (3) 0.0 0.0 145.4 66.9 89921.7 899.2 90067.1 966.2<br />
TOTAL output (at basic prices) 149.0 149.0 5827.8 2696.2 89921.7 899.2 95749.4 3595.4<br />
Direct Imports & Duties 16.7 16.7 911.4 377.4 8343.9 83.4 9255.3 460.9<br />
1. Agriculture, forestry and fishery<br />
0.0 0.0 2.8 1.1 984.9 9.8 987.7 11.0<br />
products<br />
2. Ores and minerals 0.1 0.1 0.1 0.1 92.3 0.9 92.4 1.0<br />
3. Electricity, gas and water 1.7 1.7 105.7 43.0 716.4 7.2 822.1 50.1<br />
4. Manufacturing 2.7 2.7 667.3 270.4 2582.9 25.8 3250.2 296.3<br />
5. Construction work and<br />
construction<br />
6. Trade services, restaurants and<br />
hotel services<br />
7. Transport, storage and<br />
communication services<br />
2.9 2.9 118.1 51.6 2205.2 22.1 2323.4 73.7<br />
1.8 1.8 80.1 32.7 4734.5 47.3 4814.6 80.1<br />
3.4 3.4 484.6 200.9 1543.1 15.4 2027.7 216.3<br />
8. Business services 5.1 5.1 521.6 257.3 2162.6 21.6 2684.2 279.0<br />
9. Community, social and personal<br />
services<br />
Total intermediate consumption<br />
(at purchasers price)<br />
1.4 1.4 140.9 45.3 684.3 6.8 825.2 52.2<br />
35.7 35.7 3032.7 1279.9 24050.1 240.5 27082.8 1520.4<br />
Wholesale and Retail Cost <strong>of</strong><br />
0.0 0.0 0.0 0.0 18956.6 189.6 18956.6 189.6<br />
Sales<br />
Total gross value added <strong>of</strong><br />
113.3 113.3 2795.1 1416.2 46915.0 469.2 49710.1 1885.4<br />
activities (at basic prices)<br />
Compensation <strong>of</strong> employees 33.4 33.4 730.5 328.8 13000.9 130.0 13731.4 458.8<br />
Other taxes less subsidies on<br />
-4.2 -4.2 2.4 -3.0 -1.7 0.0 0.7 -3.0<br />
production<br />
Depreciation 26.9 26.9 624.8 215.9 5976.3 59.8 6601.1 275.7<br />
Gross Operating surplus(incl.mixed 57.2 57.2 1437.1 874.2 27939.3 279.4 29376.4 1153.6<br />
in.)<br />
Adjustment 0.0 0.0 0.2 0.3 0.3 0.0 0.5 0.3<br />
30
TABLE 6 - Domestic Supply and Internal <strong>Tourism</strong> Consumption by Products (net valuation) Page 3 <strong>of</strong> 3<br />
Pula millions 2005/06 Imports* Taxes less subsidies<br />
on products<br />
nationally produced<br />
and imported<br />
Output<br />
(6.1)<br />
<strong>Tourism</strong><br />
share<br />
Output<br />
(6.2)<br />
<strong>Tourism</strong><br />
share<br />
Trade & Transport<br />
Margins<br />
Output<br />
(6.3)<br />
<strong>Tourism</strong><br />
share<br />
Total Domestic supply<br />
(at purchasers prices)<br />
(4)<br />
(6.4) = (5.15) +(6.1) + (6.2)<br />
+ (6.3)<br />
Internal<br />
tourism<br />
consumption<br />
Rest <strong>of</strong><br />
Demand<br />
(4.3) (6.5) = (6.4) -<br />
(4.3)<br />
A. Specific products<br />
A.1 Characteristic products<br />
1 – Accommodation services for<br />
visitors<br />
1.1 – Hotels and other<br />
accommodation services for visitors<br />
other than 1.2 0.0 0.0 88.5 73.4 0.0 0.0 1568.9 1477.0 91.9<br />
2 – Restaurants and similar<br />
0.0 0.0 138.4 30.4 0.0 0.0 2453.9 813.0 1640.9<br />
3 – Transport services<br />
3.2 Road transport services<br />
3.4 Air transport services<br />
0.0 0.0 81.3 8.1 0.0 0.0 1150.1 130.0 1020.1<br />
4 – Travel agencies and similar<br />
other reservation services (1) (2)<br />
B. Non specific products<br />
Services/ Goods (3)<br />
TOTAL output (at basic prices) (5)<br />
0.0 0.0 57.6 54.8 0.0 0.0 726.3 129.0 597.3<br />
0.0 0.0 9.6 9.6 0.0 0.0 158.6 144.0 14.6<br />
19892.0 368.7 6000.0 92.2 5404.0 58.3 121363.1 1421.0 119942.1<br />
19892.0 368.7 6375.4 268.5 5404.0 58.3 127420.9 4114.0 123306.9<br />
*Imports excludes direct purchase <strong>of</strong> residents abroad<br />
(1) Corresponds to the services charged <strong>of</strong> the travel agencies (2) Corresponds to the services charged <strong>of</strong> the tour operators<br />
(3) Excludes valuables and tourism single purpose consumer durable goods the value <strong>of</strong> which exceed the custom threshold, and that Balance <strong>of</strong> Payments statistics and National Accounts include<br />
as imports or exports <strong>of</strong> goods under general merchandise trade<br />
(4) Domestic Supply includes both imports into <strong>Botswana</strong> and exports, which will go out <strong>of</strong> <strong>Botswana</strong><br />
(5) includes wholesale and retail - cost <strong>of</strong> sales<br />
31
5. EMPLOYMENT AND NON-MONETARY INDICATORS<br />
5.1 <strong>Tourism</strong> Employment<br />
CSO have indicated the level <strong>of</strong> employment in the Hotels and Restaurants exceeds 11,000 in<br />
2004. Not all such employment is associated with tourism expenditure, but then expenditure by<br />
tourists outside <strong>of</strong> Hotels and Restaurants will broadly <strong>of</strong>fset the non-tourist expenditure.<br />
Employment at more than 11,000 is highly significant exceeding employment in Mining and<br />
Quarrying, in Transport and Communications, and in Finance. These figures form the basis <strong>of</strong><br />
Table 7, which is shown below.<br />
Table 7 – Employment in the <strong>Tourism</strong> Industries<br />
2994 Number <strong>of</strong><br />
Number <strong>of</strong> Jobs<br />
Number <strong>of</strong> Employed Persons<br />
Establishments<br />
<strong>Tourism</strong> industries Male Female Total Male Female Total<br />
1 & 2 – Hotels and<br />
Restaurants 2192 (2003) 3,925 7,127 11,052<br />
5.2 Non-Monetary Indicators<br />
The last <strong>of</strong> the Tables in the TSA is Table 10, which is described as Non-Monetary Indicators,<br />
which is shown below. Tables 8 (Collective Consumption) and Table 9 (Gross Fixed Capital<br />
Formation) are as yet and for the time being not included in the TSA.<br />
Table 10 – Non-Monetary Indicators<br />
a. Number <strong>of</strong> trips and overnights by type <strong>of</strong> tourism and categories <strong>of</strong> visitors<br />
Provisional<br />
Inbound tourism (*)<br />
Tourists<br />
Total<br />
Domestic tourism<br />
Tourists<br />
Total<br />
Sameday<br />
Sameday<br />
Sameday<br />
Outbound tourism<br />
Tourists<br />
2005 in „000 visitors visitors visitors visitors visitors visitors<br />
Number <strong>of</strong> trips (*) 210 1,675 1,885<br />
Number <strong>of</strong><br />
overnights - million<br />
9.2 9.2<br />
b. Inbound tourism: Number <strong>of</strong> arrivals and overnights by means <strong>of</strong> transport<br />
Total<br />
2004 in ‘000<br />
Number <strong>of</strong><br />
arrivals<br />
1.Air 66<br />
3. Land 1,455<br />
Other 2<br />
Total 1523<br />
Number <strong>of</strong><br />
overnights<br />
c. Number <strong>of</strong> establishments and capacity by forms <strong>of</strong> accommodation<br />
Hotels and similar<br />
number <strong>of</strong> establishments<br />
capacity (rooms) 4,050<br />
capacity (beds) 7,800<br />
capacity utilization (rooms)<br />
41.5% (sample)<br />
capacity utilization (beds)<br />
36.0% (sample)<br />
32
d. Number <strong>of</strong> establishments in tourism characteristic and tourism connected activities classified according to<br />
number <strong>of</strong> employed persons<br />
2003 Nil 1-4 5-29 30-49 50-99 100+ WP Unknown TOTAL<br />
<strong>Tourism</strong> Characteristic activities<br />
1 & 2 Hotels and Restaurants 6 1,194 655 46 18 12 73 188 2192<br />
WP = Working Proprietor<br />
33
6. CONCLUSIONS<br />
6.1 Contribution to the Economy<br />
The key question that is <strong>of</strong>ten asked is „what is the contribution <strong>of</strong> tourism to the <strong>Botswana</strong><br />
economy?‟ The response is frequently framed in terms <strong>of</strong> „Contribution to GDP‟ from tourism<br />
expenditure.<br />
The TSA process here indicates that TVA is around P1.9 billion in 2005/2006. Comparing this with<br />
Gross Value Added in the National Accounts for 2005/2006 <strong>of</strong> P 54.8 billion (provisional figures)<br />
indicates that the Direct Contribution <strong>of</strong> Tourist Expenditure (consumption) is around 3.4% to<br />
<strong>Botswana</strong>‟s GDP.<br />
It should be emphasised that this is the „direct‟ contribution and there are further „indirect‟<br />
contributions that can arise from the chain <strong>of</strong> value added by suppliers to the tourism industry, and<br />
then from suppliers to these suppliers, etc. who have no direct connection with the tourist,<br />
himself/herself.<br />
„Indirect‟ contribution can vary substantially, and can lie usually anywhere between 25% and 75%<br />
<strong>of</strong> the „direct‟ contribution. If this were to apply in <strong>Botswana</strong>, it might be that the „direct + indirect‟<br />
contribution would lie between 4.2% and 6.0%. These contributions relate to the impact <strong>of</strong> the<br />
expenditure/consumption. They do not include for capital expenditure (which can be highly<br />
variable through the years).<br />
The “induced” impacts are more abstract: they take into consideration the effects <strong>of</strong> increased<br />
income on expenditure, and then, the effects <strong>of</strong> these increased expenditures on GDP.<br />
6.2 Leakages and Linkages<br />
Leakages and linkages are frequently mentioned in the context <strong>of</strong> economic initiatives to reduce<br />
leakages and to improve linkages.<br />
The Supply Survey and the Accommodation Survey carried out and put together by DOT indicated<br />
a number <strong>of</strong> opportunities for reducing leakages and improving linkages. The most important <strong>of</strong><br />
these are:<br />
Increasing the number <strong>of</strong> <strong>Botswana</strong> in employment in the tourism industries<br />
Compared with some other destinations (e.g. Kenya), there is still an opportunity to encourage<br />
more employment in <strong>Botswana</strong>. The current levels <strong>of</strong> around 6% from abroad in the hotels could<br />
perhaps be substantially reduced. Kenya is now less than 1%. There, all staff are local unless<br />
there is some exceptional skill that the foreign staff bring to a post e.g. speak Russian. If there is<br />
suitable training and there is the same level <strong>of</strong> productivity from local labour then <strong>Botswana</strong><br />
employment can be increased. However, this should be done in conjunction with the owners <strong>of</strong> the<br />
businesses, who nowadays are always seeking the most productive solutions, so there is no point<br />
in having foreign staff if local staff can do the job. But there is an opportunity.<br />
Encouraging the provision <strong>of</strong> local services and local supplies by <strong>Botswana</strong><br />
The Supplier Survey, whilst not statistically significant, does indicate that there is an opportunity for<br />
increasing supplies from local producers and local services. However, as with staff, they have to<br />
be equal in productivity and quality. Again, there is an opportunity.<br />
Mostly they have to do with the reduction <strong>of</strong> the dependency on imported inputs and capital goods,<br />
and their substitutions with nationally produced goods: this has to do with the industrial<br />
development <strong>of</strong> the country. Regarding food serving services, it might be possible to promote the<br />
production <strong>of</strong> food stuff, and also the promotion <strong>of</strong> the use <strong>of</strong> local food in restaurants, based on<br />
locally available inputs.<br />
34
Encouraging the private sector tour operators to make available more information on their<br />
operations in <strong>Botswana</strong>, through the medium <strong>of</strong> HATAB<br />
Understandably there is a view that revenues declared and taxes paid in <strong>Botswana</strong> by some <strong>of</strong> the<br />
tour operators are not as high as it could be. Inevitably there is some scope for „transfer pricing‟,<br />
but no serious data is available to draw any conclusions on this.<br />
„Transfer pricing‟ refers to the pricing <strong>of</strong> goods and services within a business organization,<br />
particularly in regard to cross-border transactions. In effect, the business is able to price services<br />
and goods sold to itself such that it can reduce its exposure to tax in a particular economy.<br />
The answer for <strong>Botswana</strong> to clarify such an issue would be for there to be more transparency and<br />
more information shared by the tourism industry with their representative body, HATAB, and then<br />
informed discussion between <strong>Government</strong> and the industry can take place. The <strong>Government</strong> does<br />
play a most important part in looking after the environment and wildlife, spending significant sums<br />
<strong>of</strong> taxpayers‟ money. Clearly informed debate could be to mutual benefit. Probably such an<br />
initiative through HATAB would address concerns about leakage.<br />
6.3 Conclusions on the TSA Process<br />
A very substantial effort has gone into collecting primary statistics on tourism in <strong>Botswana</strong>, where<br />
the collection <strong>of</strong> primary statistics is not easy because <strong>of</strong> the large physical scale <strong>of</strong> the country<br />
because <strong>of</strong> the large number <strong>of</strong> border posts, and because <strong>of</strong> the large number <strong>of</strong> business<br />
enterprises involved with tourists.<br />
The TSA requires a great deal <strong>of</strong> collaboration to collect, compile and analyse primary statistics<br />
from a whole range <strong>of</strong> different institutions – DOT, CSO, BOB and UB to name some key players.<br />
Such collaboration has been good and can continue to be so.<br />
The process has helped in the strengthening <strong>of</strong> the statistical capacity within the country (an<br />
objective <strong>of</strong> the UNWTO/ UNDP), which is already at a high level, but there is always a value in<br />
continuing to update. Presenting an Experimental TSA, as recent as 2005/2006, is a relatively rare<br />
event, even in some <strong>of</strong> the very advanced statistical nations.<br />
Of course, there are many improvements that can be made to this TSA process. Many will<br />
probably be made in the next two to three years with the whole range <strong>of</strong> new sample surveys<br />
being carried out by the CSO.<br />
Particularly important are considerations regarding the visitors and tourist arrivals to ensure that<br />
there is not the inclusion <strong>of</strong> arriving non-residents that are not visitors. Also the measurement <strong>of</strong><br />
domestic tourism consumption is essential.<br />
Despite the extensive range <strong>of</strong> statistics available, it has been necessary to work with anecdotal<br />
information as well, especially in relation to private sector activities. Where improvements could be<br />
made in forthcoming years are with respect to:<br />
More statistical information on private sector activities, in particular the numbers <strong>of</strong><br />
tourists coming on package tours to <strong>Botswana</strong> would be helpful. Breakdowns on how<br />
part <strong>of</strong> the package tour price is spent in <strong>Botswana</strong> would also improve the TSA process.<br />
It is recommended that HATAB along with DOT be a key player in obtaining such<br />
information;<br />
Information on domestic tourism, not only by households (to be picked up next year by<br />
DOT in cooperation with CSO in a Household Survey) but also tourism by <strong>Government</strong><br />
staff and by businesses is needed. It is recommended that the DOT add an<br />
accommodation sample survey to their accommodation statistics process; and<br />
Updating <strong>of</strong> the Social Accounting Matrix by the CSO is recommended. It is a major<br />
exercise but one that would be highly valuable for the TSA process, and one that could<br />
35
e achieved following the important surveys that are being carried out by CSO currently<br />
and in the next couple <strong>of</strong> years.<br />
6.4 The Way Forward<br />
The following table provides a list <strong>of</strong> action items that are required to move tourism statistics<br />
forward in <strong>Botswana</strong>, as well as improve the statistical base in future revisions <strong>of</strong> the TSA. The key<br />
bodies responsible for each action item are shown, as is the proposed timing (short = during 2008,<br />
medium = 2009-2011 years, long = 2012 onwards). The statistical coverage <strong>of</strong> each action item is<br />
also indicated.<br />
Action Item Responsibility Timing Statistical Coverage<br />
Domestic <strong>Tourism</strong><br />
Survey<br />
Training for DOT on<br />
statistics analysis<br />
<strong>Tourism</strong> <strong>Statistics</strong><br />
Database<br />
Maintenance<br />
Production on<br />
Quarterly<br />
Accommodation<br />
Reports<br />
CSO, DOT Short Domestic <strong>Tourism</strong>,<br />
TSA Tables 2 and 10<br />
Consultant Input Short All <strong>Statistics</strong><br />
Consultant Input Short All <strong>Statistics</strong><br />
DOT Short Accommodation<br />
<strong>Statistics</strong><br />
Annual Visitor Survey DOT Short / Medium Inbound Visitor<br />
Expenditure, TSA<br />
Table 1<br />
Production <strong>of</strong> Annual<br />
<strong>Tourism</strong> <strong>Statistics</strong><br />
Report<br />
Update Social<br />
Accounting Matrix<br />
<strong>Tourism</strong> Employment<br />
Survey<br />
Package Holiday/Tour<br />
Operator Survey<br />
DOT Short / Medium All <strong>Statistics</strong><br />
CSO Medium TSA Table 5<br />
DOT, CSO Medium TSA Tables 7 and 10<br />
DOT Medium Inbound Visitor<br />
Expenditure, TSA<br />
Table 1<br />
Computerization <strong>of</strong><br />
border posts<br />
Department <strong>of</strong><br />
Immigration<br />
Medium<br />
Inbound Visitor<br />
Arrivals, TSA Tables 1<br />
and 10<br />
Update TSA for a new<br />
reference year<br />
CSO, DOT,<br />
Consultant Input<br />
Medium<br />
All <strong>Statistics</strong><br />
36
ANNEX 1: TERMS OF REFERENCE<br />
The development <strong>of</strong> the Experimental TSA is Phase 2 <strong>of</strong> the overall project involving the<br />
„Strengthening <strong>of</strong> <strong>Tourism</strong> <strong>Statistics</strong> in <strong>Botswana</strong>‟. The original Project Document states:<br />
“TSA Development:<br />
The level <strong>of</strong> development <strong>of</strong> the TSA will be dependent on the success <strong>of</strong> the data collection.<br />
However, the developed TSA should be considered to be a “preliminary TSA” until the data<br />
collection procedures become more established and the data can be verified further.<br />
Phase 2: TSA Development<br />
This phase will focus on the development <strong>of</strong> the TSA, commencing with tables 1, 7 and 10 (that is<br />
inbound tourism consumption, employment and non-monetary tourism indicators). The successful<br />
development <strong>of</strong> these tables will trigger (albeit to a preliminary level) development <strong>of</strong> Tables 2 and<br />
3 (domestic and outbound tourism consumption), Table 4 (consolidation <strong>of</strong> Tables 1 and 2) and<br />
Table 5 (production accounts <strong>of</strong> the tourism supply). This will culminate in the generation <strong>of</strong> Table<br />
6, the core <strong>of</strong> the TSA system, where the confrontation between supply and demand (internal<br />
tourism consumption) takes place. Preliminary calculations, such as <strong>Tourism</strong> Value Added (TVA)<br />
and <strong>Tourism</strong> GDP will be undertaken at this stage.”<br />
Work Programme for the <strong>Botswana</strong> TSA<br />
The Work Programme for the TSA has built upon a combination <strong>of</strong> sample surveys, national<br />
accounting statistics, Social Accounting Matrices, and analytical exercises to arrive at a<br />
reasonable set <strong>of</strong> estimates <strong>of</strong> the information to go into the Experimental <strong>Tourism</strong> Satellite<br />
Account for <strong>Botswana</strong>.<br />
The guidelines indicated in the TSA: RMF (Recommended Methodological Framework)<br />
established by the UNWTO and endorsed by the OECD and the European Commission (Eurostat)<br />
have been followed.<br />
37
ANNEX 2: TSA DEFINITIONS<br />
Internal tourism consumption is the amount <strong>of</strong> visitor consumption within the economic territory<br />
<strong>of</strong> the country <strong>of</strong> reference. Visitor consumption includes flows – tourism business expenses –<br />
which national accounts classify within the intermediate consumption <strong>of</strong> productive activities and<br />
not as part <strong>of</strong> final demand. In this context a visitor includes inbound visitors to the country <strong>of</strong><br />
reference (same day and staying the night), domestic visitors within the country <strong>of</strong> reference, and<br />
resident‟s consumption within the country <strong>of</strong> reference as part <strong>of</strong> a visit abroad.<br />
Value added <strong>of</strong> the tourism industries simply sums the total value added <strong>of</strong> all characteristic<br />
producers, regardless <strong>of</strong> whether all <strong>of</strong> their product is provided to visitors. It leaves out the effect<br />
<strong>of</strong> visitor consumption on other productive activities that might serve them. The estimate <strong>of</strong> the<br />
value added <strong>of</strong> tourism industries is dependent on the definition <strong>of</strong> the characteristic industries.<br />
Value added <strong>of</strong> tourism industries is a measure <strong>of</strong> the supply side <strong>of</strong> tourism but is not sufficiently<br />
well defined in terms <strong>of</strong> its links to visitor consumption to allow it to be the most accurate measure<br />
<strong>of</strong> tourism supply.<br />
<strong>Tourism</strong> value added includes the proportion <strong>of</strong> value added generated by all industries in the<br />
provision <strong>of</strong> goods and services to visitors.<br />
Gross Domestic Product generated by Internal tourism consumption is the sum <strong>of</strong> the value<br />
added (at basic prices) generated by all industries in response to internal tourism consumption and<br />
the amount <strong>of</strong> net taxes on products and imports included within the value <strong>of</strong> this expenditure.<br />
Classifications<br />
In the TSA, Products and Activities (Industries) are classified as:<br />
Products<br />
Activities (industries)<br />
A. <strong>Tourism</strong> Specific A. <strong>Tourism</strong> Specific<br />
A1 – <strong>Tourism</strong> Characteristic<br />
A1 – <strong>Tourism</strong> Characteristic<br />
A2 - <strong>Tourism</strong> Connected<br />
A2 - <strong>Tourism</strong> Connected<br />
B. Non- Specific B. Non- Specific<br />
Source: TSA:RMF<br />
The TSA:RMF points out that the classifications to be used will also respond to different stages <strong>of</strong><br />
development <strong>of</strong> classifications at the international level.<br />
The TSA defines a tourism characteristic industry as a group <strong>of</strong> establishments whose principal<br />
productive activity is a tourism characteristic activity. <strong>Tourism</strong> industries are the group <strong>of</strong> all<br />
tourism characteristic industries.<br />
Products considered as tourism characteristic, tourism connected and tourism specific follow<br />
roughly the following pragmatic criteria:<br />
<strong>Tourism</strong>-characteristic products: products which in the absence <strong>of</strong> visitors, in most<br />
countries would probably cease to exist in meaningful quantity or for which the level<br />
<strong>of</strong> consumption would be significantly reduced and for which it seems possible to<br />
obtain statistical information;<br />
<strong>Tourism</strong>-connected products: a residual category, including those that have been<br />
identified as tourism-specific in a given country but for which this attribute has not<br />
been acknowledged on a worldwide basis; and<br />
<strong>Tourism</strong>-specific products: the sum <strong>of</strong> the two previous categories.<br />
38
Classifications do not exist for connected products, and as the TSA:RMF indicates, some<br />
countries may include different products and activities under the categories <strong>of</strong> „characteristic‟ and<br />
„connected‟.<br />
Key issues that make measurement difficult for the purposes <strong>of</strong> focusing upon tourism are:<br />
that particular broad product categories can be produced by many different<br />
activities/industries; and<br />
that an industry, broadly defined, may produce many different products, some to<br />
serve visitors, some to serve residents and some to serve both visitors and residents.<br />
The TSA: RMF neatly encapsulates the difficulty in the Figure below.<br />
Also the pragmatic criteria for identifying products does emphasise the need to use product<br />
categories „for which it seems possible to obtain statistical information‟.<br />
Data Transformations<br />
Developing a country‟s TSA requires from the compiler not only a basic set <strong>of</strong> direct data-collection<br />
procedures but also a transformation and partitioning <strong>of</strong> the information already existing in the<br />
national accounts <strong>of</strong> a country into the tourism orientation embodied in the TSA. This process<br />
includes: -<br />
The extraction <strong>of</strong> data on tourism-specific products and activities from the databases<br />
used for the elaboration <strong>of</strong> make and use matrices <strong>of</strong> national accounts;<br />
The transformation <strong>of</strong> package tours from their gross valuation in the national<br />
accounts to the net valuation required by the TSA;<br />
The extraction <strong>of</strong> the value <strong>of</strong> travel agency services from the costs <strong>of</strong> the services in<br />
which they are included;<br />
The breakdown <strong>of</strong> the value <strong>of</strong> goods acquired by visitors between the distribution<br />
margins and the basic value <strong>of</strong> the good;<br />
The identification <strong>of</strong> visitor consumption in all its components as distinct from nonvisitor<br />
consumption; and<br />
A dual classification <strong>of</strong> business tourism expenses, both as a component <strong>of</strong> visitor<br />
consumption where the balance between supply and use is concerned, and as a cost<br />
<strong>of</strong> production <strong>of</strong> productive activities when describing these production processes and<br />
establishing tourism value added and tourism gross domestic product.<br />
39
Of the six transformations <strong>of</strong> basic information, four <strong>of</strong> them (different classifications for products<br />
and activities, separation <strong>of</strong> the margins from the value <strong>of</strong> goods, identification <strong>of</strong> visitor<br />
consumption, and dual classification <strong>of</strong> business expenses) mean that the breakdowns by<br />
products and activities are modified but the not the total values themselves. However, this is not<br />
the case for the net valuation <strong>of</strong> package tours and for the extraction <strong>of</strong> travel agency services,<br />
which have implications for the values and classifications <strong>of</strong> flows within the different concepts <strong>of</strong><br />
visitor consumption.<br />
Key Economic Concepts<br />
It is fair to say that <strong>Tourism</strong> Satellite Accounts are still very much a „work in progress‟. There are<br />
methodological issues that are continually being refined.<br />
40
ANNEX 3: VISTOR SURVEYS<br />
DOT has developed considerable expertise in carrying out sample surveys <strong>of</strong> visitors since the<br />
Year 2000 with UNDP/UNWTO guidance. These sample surveys take place in April and October<br />
and total interviews exceed 4000. These sample surveys provide the key estimates <strong>of</strong> average<br />
length <strong>of</strong> stay and expenditure per day.<br />
For the development <strong>of</strong> the TSA the sample surveys carried out in 2005 (April and October) and<br />
similarly in 2006 have been used. In addition a Visitor Survey was carried in April 2007 by DOT.<br />
There are a large number <strong>of</strong> Border Posts in <strong>Botswana</strong>. Some <strong>of</strong> these border posts could be<br />
described as remote and indeed conditions for interviewing are not at all easy.<br />
Photo A3.1: Interviewer‟s Living Conditions in Ngoma – illustrating the substantial field operations<br />
required to collect primary statistics <strong>of</strong>ten in remote border areas.<br />
Average Length <strong>of</strong> Stay<br />
Because a total figure for tourist arrivals embraces such a wide range <strong>of</strong> different types <strong>of</strong> visitor,<br />
many <strong>of</strong> them undertaking different activities and staying for varying periods, it is best to try to<br />
segment this total in various ways. „Country <strong>of</strong> residence‟ and the „purpose <strong>of</strong> visit‟ have been<br />
looked at in particular. Average length <strong>of</strong> stay varies according to the purpose <strong>of</strong> visit. Examples<br />
include transit visitors who are staying for only a night whilst holiday visitors can be staying for<br />
nearly six nights on average.<br />
For the reference year <strong>of</strong> 2005/2006 an average has been adopted for the length <strong>of</strong> stay between<br />
the sample survey data for the Year 2005 and the Year 2006, as shown in Table A3.1.<br />
In order to use figures with a lower relative sampling error, the sample data has <strong>of</strong>ten been<br />
brought together into larger groupings. The relative sampling error (the standard error times 1.96 –<br />
95% confidence level) has been calculated as a percentage <strong>of</strong> the arithmetic mean.<br />
41
Table A3.1: Average Length <strong>of</strong> Stay<br />
Country <strong>of</strong><br />
Residence &<br />
Purpose <strong>of</strong> Visit<br />
Australia<br />
2005<br />
Mean<br />
Nights<br />
N 2005<br />
Median<br />
Nights<br />
Relative<br />
Sampling<br />
Error<br />
2006<br />
Mean<br />
Nights<br />
N 2006<br />
Median<br />
Nights<br />
Relative<br />
Sampling<br />
Error<br />
2005/<br />
2006<br />
Nights<br />
Holiday or Leisure 9.8 51 6 39% 7.7 22 7 28% 8.8<br />
Total 10.2 56 6 36% 6.8 34 5 23% 8.5<br />
France<br />
Holiday or Leisure 5.3 12 2 66% 8.9 9 10 56% 7.1<br />
Germany<br />
Holiday or Leisure 6.9 70 5 19% 7.4 60 6 19% 7.1<br />
Total 7.7 78 5 19% 8.0 81 4 28% 7.8<br />
Namibia<br />
Holiday or Leisure 4.8 35 3 30% 3.0 29 1 51% 3.9<br />
In Transit 0.7 20 0.5 50% 0.8 41 1 19% 0.8<br />
VFR 7.4 10 6.5 45% 3.6 22 2 72% 5.5<br />
Total 4.9 93 2 52% 2.2 131 1 27% 3.6<br />
Netherlands<br />
Holiday or Leisure 6.0 42 5 21% 6.0 38 4 30% 6.0<br />
Total 5.8 45 4 20% 5.8 40 4 30% 5.8<br />
South Africa<br />
Business 2.8 659 2 12% 2.9 874 2 18% 2.8<br />
Holiday or Leisure 4.2 279 3 10% 5.0 543 4 10% 4.6<br />
In Transit 0.7 50 0 34% 0.8 96 1 19% 0.7<br />
VFR 4.1 371 2 13% 5.2 443 3 13% 4.6<br />
Total 3.3 1359 2 7% 3.9 1964 2 8% 3.6<br />
United Kingdom<br />
Holiday or Leisure 7.2 108 5 31% 7.2 64 5 21% 7.2<br />
Total 7.8 137 4 32% 8.5 96 6 22% 8.2<br />
USA<br />
Holiday or Leisure 9.6 70 5 25% 7.6 58 6 23% 8.6<br />
Total 10.4 92 5 40% 7.3 87 6 19% 8.8<br />
Zambia<br />
Holiday or Leisure 3.8 5 4 38% 2.3 3 2 74% 3.1<br />
Zimbabwe<br />
Business 2.1 352 1 18% 3.6 230 1 24% 2.9<br />
Holiday or Leisure 2.7 170 1 28% 4.6 195 3 25% 3.6<br />
In Transit 0.5 41 0 40% 0.9 24 1 53% 0.7<br />
VFR 6.5 1908 2 9% 6.8 1888 2 8% 6.6<br />
Total 5.5 2471 2 8% 6.2 2340 2 8% 5.9<br />
Total<br />
Business 3.8 1164 2 17% 3.5 1295 2 12% 3.6<br />
Holiday or Leisure 5.7 970 4 10% 5.6 1150 4 7% 5.7<br />
In Transit 0.9 123 0 56% 0.8 181 1 14% 0.8<br />
VFR 6.2 2377 2 8% 6.6 2442 2 7% 6.4<br />
Total 5.3 4634 2 6% 5.3 5083 2 5% 5.3<br />
Source: DOT Visitor Surveys in 2005 & 2006<br />
42
Table A3.2: Average Spend per Day–Pula<br />
Country <strong>of</strong><br />
Residence &<br />
Purpose <strong>of</strong> Visit<br />
Australia<br />
Mean<br />
Spend<br />
Pula<br />
N<br />
2005<br />
Median<br />
Spend<br />
Pula<br />
Relative<br />
Sampling<br />
Error<br />
Mean<br />
Spend<br />
Pula<br />
N<br />
2006<br />
Median<br />
Spend<br />
Pula<br />
Relative<br />
Sampling<br />
Error<br />
2005/<br />
2006<br />
Spend P<br />
Total 346 45 183 41% 815 34 265 66% 580<br />
France<br />
Total 602 13 414 80% 425 12 297 63% 513<br />
Germany<br />
Total 462 73 227 31% 488 75 113 69% 475<br />
Namibia<br />
Business 387 28 232 51% 263 39 134 34% 325<br />
Holiday /Leisure 339 29 222 37% 150 23 125 46% 244<br />
In Transit 202 10 167 38% 222 31 156 32% 212<br />
Total 339 76 217 28% 220 113 141 20% 279<br />
Netherlands<br />
Holiday /Leisure 241 31 83 46% 326 35 188 50% 283<br />
Total 234 33 83 45% 333 36 193 48% 283<br />
South Africa<br />
Business 431 516 305 10% 526 784 287 15% 479<br />
Holiday /Leisure 302 232 202 16% 256 530 150 12% 279<br />
In Transit 217 17 208 31% 227 62 175 23% 222<br />
VFR 165 299 75 16% 124 429 42 18% 144<br />
Total 325 1064 200 8% 341 1808 150 11% 333<br />
United Kingdom<br />
Holiday /Leisure 552 89 227 42% 541 63 295 32% 546<br />
Total 632 112 288 34% 502 95 275 26% 567<br />
USA<br />
Business 977 14 660 52% 535 18 617 26% 756<br />
Holiday /Leisure 629 61 267 42% 489 58 60 50% 559<br />
Total 679 78 332 33% 504 87 167 35% 591<br />
Zambia<br />
Holiday /Leisure 272 5 225 66% 159 3 150 33% 215<br />
Total 231 31 200 24% 586 27 167 91% 408<br />
Zimbabwe<br />
Business 355 275 200 22% 171 197 62 24% 263<br />
Holiday /Leisure 278 140 170 24% 187 189 72 20% 233<br />
In Transit 172 14 145 43% 76 13 50 68% 124<br />
VFR 158 1777 63 9% 94 1841 21 22% 126<br />
Total 190 2206 85 9% 108 2243 25 16% 149<br />
Total<br />
Business 429 936 270 9% 502 1171 251 12% 466<br />
Holiday /Leisure 375 806 190 12% 353 1106 150 18% 364<br />
In Transit 258 50 193 39% 209 114 151 18% 233<br />
VFR 170 2158 67 9% 113 2378 25 16% 141<br />
Total 274 3950 125 6% 266 4779 70 9% 270<br />
Source: DOT Visitor Surveys in 2005 & 2006<br />
43
Average Direct Expenditure per day<br />
Expenditure data has been gleaned from the DOT visitor surveys for 2005 and 2006. In a similar<br />
manner to the „length <strong>of</strong> stay‟, for our reference year <strong>of</strong> 2005/2006 an average for the „expenditure<br />
per day‟ between the sample survey data for the Year 2005 and the Year 2006 has been adopted.<br />
Using the „country <strong>of</strong> residence‟ and the „purpose <strong>of</strong> visit‟ as a way <strong>of</strong> segmenting the total figures<br />
allows one to take into account the considerable disparity in „length <strong>of</strong> stay‟ and „expenditure per<br />
day‟ between individual tourist arrivals.<br />
The base figures for expenditure per day are shown in Table A3.2. Ideally it is „good practice‟ to<br />
focus upon expenditure with relative sampling errors below 25%, but this has not always been<br />
possible in this process.<br />
Relative Sampling Errors are 1.96 times Standard Error - 95% confidence level.<br />
44
ANNEX 4: SAME-DAY VISITORS – INTERNATIONAL INBOUND<br />
1. General<br />
Expenditure by Same-Day Visitors is part <strong>of</strong> Inbound <strong>Tourism</strong> Expenditure as required in Table 1<br />
<strong>of</strong> the TSA.<br />
In a country with a large physical area, with many road border posts, and <strong>of</strong>ten with strong ties<br />
between family/friends across borders, and frequent commercial relationships between<br />
neighbouring border towns, inevitably<br />
same-day visitors (day visitors) can be<br />
substantial. For <strong>Botswana</strong>, there are many<br />
ties with South Africa and also with<br />
Zimbabwe. For the latter country, there are<br />
exceptional circumstances leading to travel<br />
which looks like tourism travel in that<br />
Zimbabweans are visiting <strong>Botswana</strong> in ever<br />
increasing numbers. But it is difficult to<br />
distinguish between genuine same-day<br />
tourist travel, cross border travel which is<br />
really within the usual environment<br />
(frequency/distance) and other travel, such<br />
as short-term visits for the purpose <strong>of</strong><br />
picking up casual employment through the<br />
week and going home at the weekend,<br />
which are not tourism visits because the traveller is being employed in the country visited, etc.<br />
(e.g. Zimbabweans in Francistown, as the DOT interviewers found in anecdotal discussions in<br />
Ramokgwebana – see Photo A4.1 <strong>of</strong> Ramokgwebana border post above, the interviewers in the<br />
foreground).<br />
2. Same-day visitor numbers<br />
The Visitor Arrival <strong>Statistics</strong>, from CSO/ DOT, indicate that Day Visitors in 2004 were 204,000 and<br />
provisional figures for 2005 were 210,000. Provisional figures for 2005/2006 indicate a total <strong>of</strong><br />
around 213,000 day visitors.<br />
Table A4.1: Breakdown <strong>of</strong> Day visitors by Country <strong>of</strong> Residence for 2005/2006<br />
Other 3%<br />
Namibia 5%<br />
South Africa 42%<br />
Zambia 1%<br />
Zimbabwe 50%<br />
The same-day visitors are primarily from the neighbours, South Africa and Zimbabwe, and to a<br />
much smaller extent from Namibia and Zambia. In addition there are small numbers from other<br />
countries <strong>of</strong> residence but these are people visiting South Africa, Zimbabwe, Zambia and Namibia,<br />
and just coming over for a daytrip to <strong>Botswana</strong>, or indeed transiting <strong>Botswana</strong> (e.g. Germans<br />
transiting to Namibia).<br />
3. Day visitor spend per trip<br />
Expenditure data has been gleaned from the DOT visitor surveys for those respondents who<br />
indicated that they were not staying the night in <strong>Botswana</strong>. Expenditure statistics are available for<br />
same-day visitors from South Africa, Zimbabwe and Namibia. Sample numbers from Zambia are<br />
too small to allow reasonable estimates <strong>of</strong> such spending. Median expenditures for Day visitors<br />
are similar for all three <strong>of</strong> the fore-mentioned neighbouring countries at around Pula 50 per day<br />
visit. The differences in the arithmetic means are caused by relatively small numbers <strong>of</strong> higher<br />
than average spenders. The high spending derives from either „shopping spending‟ or from<br />
45
Spend per person<br />
spending on „other‟ items. From South Africa there are a number <strong>of</strong> relatively high spenders –<br />
businessmen flying over for the day and spending on lunch and other items – but these are small<br />
in number. From Zimbabwe, there are high spenders coming over and shopping, because <strong>of</strong> the<br />
lack <strong>of</strong> goods in their own country, and also spending on „other‟ goods and services. If such<br />
behaviour is routine then they should be considered as being within their usual environment.<br />
Anecdotal evidence suggests that some Zimbabweans are coming over to complete banking<br />
transactions and foreign exchange transactions, which are tedious in their own country. Some <strong>of</strong><br />
these may also be considered as being within their usual environment. There is then an issue <strong>of</strong><br />
these transactions having an effect on the travel item <strong>of</strong> the Balance <strong>of</strong> Payments, even though<br />
they are not visitors.<br />
Figure A4.1: Same-day visitor spending per trip – Outliers 2005<br />
10000.00<br />
8000.00<br />
309<br />
3,516<br />
3,828<br />
Investigation <strong>of</strong> the frequency distributions<br />
for the Same-day visitor spending suggests<br />
that some <strong>of</strong> the high levels <strong>of</strong> expenditure<br />
could be described as „outliers‟ or „freak‟<br />
results. An illustration <strong>of</strong> the process is<br />
shown in the Figure alongside.<br />
6000.00<br />
4000.00<br />
2,559<br />
4,465<br />
4,166<br />
2,341<br />
It may also be that these „outliers‟<br />
correspond to the “non-tourism” type <strong>of</strong><br />
traveller and the expenditure is not for own<br />
use or as a gift.<br />
2000.00<br />
0.00<br />
2,858<br />
4,297<br />
4,210<br />
3,262<br />
3,228<br />
3,614<br />
2,732<br />
3,886<br />
3,746<br />
2,367<br />
Because <strong>of</strong> these „outliers‟, the view has<br />
been taken that it is better to use the lower<br />
<strong>of</strong> the means obtained in either 2005 or<br />
2006 as the appropriate statistic to be<br />
adopted for the 2005/2006 analyses.<br />
India Namibia South Africa Zambia Zimbabwe<br />
Country <strong>of</strong> Residence<br />
The estimates for Same-day visitor<br />
spending are shown in the Table below.<br />
Table A4.2: Spending on the Same-day Visit Trip - Pula<br />
Country <strong>of</strong><br />
Residence<br />
2005<br />
Statistic<br />
2006<br />
Statistic<br />
Adopted for<br />
2005/2006<br />
Namibia Mean 97.5000 53.66 54<br />
Relative Sampling Error 117% 53%<br />
5% Trimmed Mean 80.5556 51.26<br />
Median 50.0000 43.00<br />
South Africa Mean 346.8649 605.81 347<br />
Relative Sampling Error 65% 77%<br />
5% Trimmed Mean 184.8498 144.88<br />
Median 111.5000 50.38<br />
Zimbabwe Mean 728.4513 275.90 276<br />
Relative Sampling Error 27% 78%<br />
5% Trimmed Mean 509.6202 119.44<br />
Median 251.0000 50.75<br />
46
4. Total Spending by Same-day visitors<br />
The Total Spending by Same-day visitors for 2005/2006 (day visitors) is then estimated by<br />
multiplying the Spend per Same-day visitor by the number <strong>of</strong> Same-day visitors.<br />
Table A4.3: Total Spending by Same-day visitors in 2005/ 2006<br />
Total Number <strong>of</strong> Same-day visitors 213,000<br />
Country <strong>of</strong> Residence Percent Spend Total Spend<br />
Pula P million<br />
Other 2.5% 347 1.85<br />
Namibia 4.5% 54 0.52<br />
South Africa 42.0% 347 31.04<br />
Zambia 1.0% 54 0.12<br />
Zimbabwe 50.0% 276 29.39<br />
62.92<br />
The total day visitor spending is estimated at Pula 63 million for 2005/06. It is fair to mention that<br />
the relative sampling errors that are associated with these statistics are upwards <strong>of</strong> 60%. So, as<br />
with any estimates involving sampling, it is necessary to indicate that this estimate (P 63 million)<br />
could lie with 95% confidence levels anywhere between P25million and P100 million<br />
(approximately).<br />
5. Breakdown <strong>of</strong> the Same-day visitor spending<br />
Sample estimates <strong>of</strong> the breakdown <strong>of</strong> day visitor expenditure are obtained from DOT visitor<br />
surveys in 2005 and in 2006. The key feature <strong>of</strong> these breakdowns is that the day visitors into<br />
<strong>Botswana</strong> are not spending on the usual tourism services – accommodation, meals and drinks,<br />
transport, recreation - or hardly at all. They are spending on „shopping‟ and on „other‟ items, which<br />
appear to encompass a whole range <strong>of</strong> other goods and services.<br />
To some extent these findings coincide with simple observation. Zimbabweans are coming across<br />
to make transactions within <strong>Botswana</strong> that perhaps in other years they may have made within their<br />
own country. South Africa is different to Zimbabwe but again the focus <strong>of</strong> expenditure is upon<br />
„shopping‟ and „other‟ items. Estimates for South African expenditure could be influenced by the<br />
strong involvement <strong>of</strong> South African companies in the <strong>Botswana</strong> economy. For example, some<br />
business expenditure by a South African day visitor will be met by the local <strong>of</strong>fice in, say,<br />
Gaborone. So DOT interviewers at Sir Seretse Khama airport, would come across South Africans,<br />
both same-day visitors and overnight visitors, who had spent almost nothing because all their<br />
costs had been picked up by the company in <strong>Botswana</strong>.<br />
The breakdowns <strong>of</strong> expenditure and the figures adopted for 2005/2006 are shown in the Table<br />
below.<br />
Table A4.4: Breakdown <strong>of</strong> Spending on the Same-day Visit Trip - Percent<br />
2005<br />
Statistic<br />
2006<br />
Statistic<br />
Adopted for<br />
2005/2006<br />
Money Spent on Accommodation 1.1% 3.9% 2.5%<br />
Money Spent on Meals and Drink 2.7% 4.0% 3.3%<br />
Money Spent on Transport 3.0% 1.9% 2.5%<br />
Money Spent on Recreation 0.1% 0.8% 0.5%<br />
Money Spent on Shopping 64.4% 0.1% 63.2%<br />
Money Spent on 'Other' Spending 28.8% 89.3% 28.0%<br />
Total 100.0% 100.0% 100.0%<br />
47
The breakdown <strong>of</strong> the total Same-day visitor spending in 2005/2006 is shown in the Table A4.5<br />
below.<br />
Table A4.5: Breakdown <strong>of</strong> the Total Spending by Same-day visitors in 2005/ 2006<br />
Total Expenditure by Day visitors P million 63<br />
Country <strong>of</strong> Residence Percent Total Spend P<br />
million<br />
Money Spent on Accommodation 2.5% 1.58<br />
Money Spent on Meals and Drink 3.3% 2.08<br />
Money Spent on Transport 2.5% 1.58<br />
Money Spent on Recreation 0.5% 0.32<br />
Money Spent on Shopping 63.2% 39.82<br />
Money Spent on 'Other' Spending 28.0% 17.64<br />
Total 100.0% 63.00<br />
48
ANNEX 5: TOURISM CHARACTERISTIC PRODUCTS AND ACTIVITIES<br />
<strong>Tourism</strong> Characteristic Products<br />
A. Specific products<br />
A.1 Characteristic products<br />
1 – Accommodation services<br />
1.1 – Hotels and other lodging services<br />
1.2 – Second homes services on own account or for<br />
free<br />
2 – Food and beverage serving services<br />
3 – Passenger transport services<br />
3.1 Interurban railway<br />
3.2 Road<br />
3.3 Water<br />
3.4 Air<br />
3.5 Supporting services<br />
3.6 Transport equipment rental<br />
3.7 Maintenance and repair services<br />
4 – Travel agency, tour operator and tourist guide<br />
services<br />
4.1 Travel agency<br />
4.2 Tour operator<br />
4.3 Tourist information and tourist guide<br />
5 – Cultural services<br />
5.1 Performing arts<br />
5.2 Museum and other cultural services<br />
6 – Recreation and other entertainment services<br />
6.1 Sports and recreational sport services<br />
6.2 Other amusement and recreational services<br />
7 – Miscellaneous tourism services<br />
7.1 Financial and insurance services<br />
7.2 Other good rental services<br />
7.3 Other tourism services<br />
Linked to CPC<br />
Source: TSA:RMF Figures 4.3 & 4.4<br />
<strong>Tourism</strong> Characteristic Activities<br />
1 - Hotels and similar<br />
2 - Second home ownership (imputed)<br />
3 - Restaurants and similar<br />
4 - Railway passenger transport<br />
5 - Road passenger transport<br />
6 - Water passenger transport<br />
7 - Air passenger transport<br />
8 - Passenger transport supporting industries<br />
9 - Passenger transport equipment rental<br />
10 - Travel agencies and similar<br />
11 - Cultural services<br />
12 - Sporting and other recreational services<br />
Linked to ISIC Rev.3 and SICTA<br />
49
ANNEX 6: BASIC PRICES AND PURCHASERS’ PRICES<br />
Source: SNA 93<br />
50
ANNEX 7: SUPPLY AND USES OF GOODS AND SERVICES<br />
Source: SNA 93<br />
51
ANNEX 8: DEFINITIONS IN TOURISM<br />
Definitions: Basic <strong>Tourism</strong> Units<br />
Visitor: refers to any person travelling to a place other than that <strong>of</strong> his/her usual environment for<br />
less than 12 consecutive months and whose main purpose <strong>of</strong> trip is other than the exercise <strong>of</strong> an<br />
activity remunerated from within the place visited.<br />
International visitor: refers to any person travelling to a country other than the one in which s/he<br />
has his/her usual residence, but outside his/her usual environment, for less than 12 consecutive<br />
months and whose main purpose <strong>of</strong> trip is other than the exercise <strong>of</strong> an activity remunerated from<br />
within the country visited.<br />
Domestic visitor: refers to any person residing in a country, who travels to a place within the<br />
country, other than that <strong>of</strong> his/her usual environment for less than 12 consecutive months and<br />
whose main purpose <strong>of</strong> trip is other than the exercise <strong>of</strong> an activity remunerated from within the<br />
place visited.<br />
Tourists (overnight visitors): is a visitor who stays at least one night in a collective or private<br />
accommodation in the place visited.<br />
An international tourist is an international visitor who stays at least one night in a collective or<br />
private accommodation in the country visited. Domestic tourist refers to a domestic visitor who<br />
stays at least one night in a collective <strong>of</strong> private accommodation in the place visited.<br />
Same Day Visitor: a visitor who does not spend the night in a collective or private accommodation<br />
in the place visited. An international same-day visitor is an international visitor who does not spend<br />
the night in a collective or private accommodation in the country visited. This definition includes<br />
cruise passengers (see below). A domestic same-day visitor is a domestic visitor who does not<br />
spend the night in a collective or private accommodation in the place visited.<br />
Cruise passengers: who arrive in a country on a cruise ship and return to the ship each night to<br />
sleep on board even though the ship remains in port for several days. Also included in this group<br />
are, by extension, owners or passengers <strong>of</strong> yachts and passengers on a group tour<br />
accommodated in a train.<br />
Direct Transit passengers: (who do not formally enter the country) who do not leave the transit<br />
area <strong>of</strong> the airport or the port, including transfer between airports and ports.<br />
(See UNWTO‟s Recommendations on <strong>Tourism</strong> <strong>Statistics</strong> and Concepts, Definitions and<br />
Classifications for <strong>Tourism</strong> <strong>Statistics</strong> for further information).<br />
52
ANNEX 9: DETAILING THE DEFINITIONS<br />
Category <strong>of</strong> traveller<br />
Commuters travelling to regular place <strong>of</strong><br />
work<br />
Border Workers<br />
Businessmen travelling between ancillary<br />
establishments <strong>of</strong> their firm<br />
Persons without a fixed place <strong>of</strong> work (e.g.<br />
lorry drivers)<br />
Commuters travelling to regular place <strong>of</strong><br />
Study<br />
Students<br />
Persons travelling on a routine basis<br />
Border shoppers<br />
Travellers to localities in the direct vicinity<br />
<strong>of</strong> the place <strong>of</strong> residence<br />
Long term migrants<br />
Short term migrants<br />
Persons moving to another place within the<br />
same country for an intended stay <strong>of</strong> more<br />
than a year<br />
Persons moving to another place within the<br />
same country for an intended stay <strong>of</strong> less<br />
than a year<br />
Diplomats and dependents<br />
Members <strong>of</strong> armed forces<br />
Nomads<br />
Refugees<br />
Prisoners<br />
International transit passengers<br />
Cruise Passengers<br />
Persons leaving their own country but not<br />
entering another (e.g. some yachtsmen)<br />
Nationals Living Abroad<br />
Working Holiday Visitors<br />
Transportation Crews (e.g. airline crew)<br />
Treat in following way:<br />
Exclude because seen as travelling in usual<br />
environment<br />
Exclude because seen as travelling in usual<br />
environment<br />
Include, if travelling outside their usual<br />
environment<br />
Include, if travelling outside their usual<br />
environment, but exclude if travelling to head<br />
<strong>of</strong>fice or fleet base<br />
Exclude because seen as in usual environment<br />
Include, if outside usual environment<br />
Exclude because seen as in usual environment<br />
Include, if outside usual environment<br />
Exclude because seen as in usual environment<br />
Exclude, because remunerated in place visited<br />
Exclude, because remunerated in place visited<br />
Exclude, because beyond staying beyond 12<br />
months<br />
Exclude when remunerated from within the<br />
place visited<br />
Exclude when travelling to duty station<br />
Exclude when travelling to duty station<br />
Exclude<br />
Exclude<br />
Exclude<br />
Exclude when they do not enter the country<br />
Treat as Same-day visitors<br />
Domestic visitors<br />
Include as tourists, but as separate segment<br />
Include if main motivation is place visited<br />
Include as tourists or same-day visitors<br />
Source: UNWTO Technical Manual – Concepts, Definitions and Classifications for <strong>Tourism</strong><br />
<strong>Statistics</strong> – Page 23 and Appendix B<br />
53
ANNEX 10: TRAVEL CREDIT & DEBIT ACCOUNT<br />
TRAVEL CREDIT & DEBIT ACCOUNT (P ‘000)<br />
Travel<br />
Transport<br />
Credit Debit Credit Debit<br />
2000<br />
Q1 33,478 67,815 6,079 52,043<br />
Q2 65,865 57,340 13,954 50,457<br />
Q3 2,204 57,295 14,389 58,433<br />
Q4 2,619 41,116 9,827 44,759<br />
104,166 223,567 44,248 205,692<br />
2001<br />
Q1 45,713 50,089 15,837 43,888<br />
Q2 115,948 50,335 20,352 49,630<br />
Q3 242,019 61,292 31,194 54,845<br />
Q4 87,652 65,138 20,572 47,530<br />
491,332 226,854 87,954 195,894<br />
2002<br />
Q1 92,561 59,711 23,391 43,388<br />
Q2 77,706 69,434 12,111 44,756<br />
Q3 36,867 63,220 15,407 45,059<br />
Q4 73,550 65,316 17,324 59,406<br />
280,685 257,681 68,233 192,610<br />
2003<br />
Q1 118,673 74,401 79,173 71,493<br />
Q2 49,852 32,644 16,978 35,497<br />
Q3 166,449 37,987 8,841 44,876<br />
Q4 44,779 38,161 8,367 70,594<br />
379,754 183,192 113,359 222,459<br />
2004<br />
Q1 263,686 190,067 47,373 75,700<br />
Q2 366,649 40,859 60,854 53,838<br />
Q3 235,599 49,282 3,373 68,452<br />
Q4 101,662 45,621 22,634 83,083<br />
967,597 325,829 134,234 281,072<br />
2005<br />
Q1 187,852 55,251 31,010 53,619<br />
Q2 192,566 74,226 19,150 85,723<br />
Q3 360,723 60,602 41,468 65,177<br />
Q4 383,770 75,184 61,726 506,248<br />
1,124,912 265,262 153,353 710,767<br />
2006<br />
Q1 15,703 71,992 64,941 71,441<br />
Q2 381,529 58,460 44,218 81,387<br />
Q3 243,914 74,141 45,664 83,539<br />
Q4 196,680 45,856 38,312 700,377<br />
837,826 250,449 193,135 936,744<br />
2007<br />
Q1 108,830 83,941 173,749 84,134<br />
Source: Bank <strong>of</strong> <strong>Botswana</strong><br />
54