Tourism Statistics - Government of Botswana
Tourism Statistics - Government of Botswana
Tourism Statistics - Government of Botswana

You also want an ePaper? Increase the reach of your titles
YUMPU automatically turns print PDFs into web optimized ePapers that Google loves.
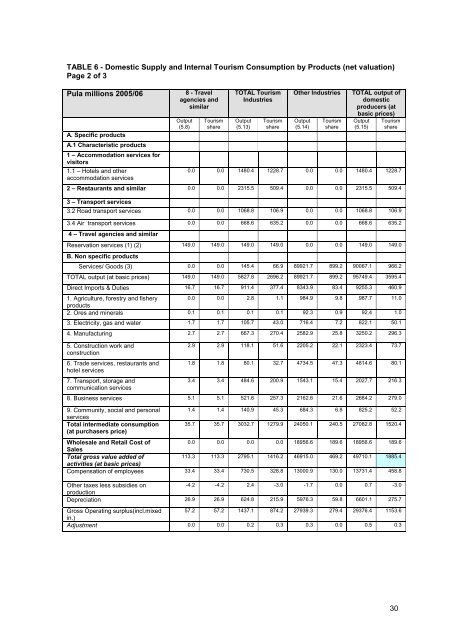
TABLE 6 - Domestic Supply and Internal <strong>Tourism</strong> Consumption by Products (net valuation)<br />
Page 2 <strong>of</strong> 3<br />
Pula millions 2005/06<br />
A. Specific products<br />
A.1 Characteristic products<br />
1 – Accommodation services for<br />
visitors<br />
1.1 – Hotels and other<br />
accommodation services<br />
8 - Travel<br />
agencies and<br />
similar<br />
Output<br />
(5.8)<br />
<strong>Tourism</strong><br />
share<br />
TOTAL <strong>Tourism</strong><br />
Industries<br />
Output<br />
(5.13)<br />
<strong>Tourism</strong><br />
share<br />
Other Industries<br />
Output<br />
(5.14)<br />
<strong>Tourism</strong><br />
share<br />
TOTAL output <strong>of</strong><br />
domestic<br />
producers (at<br />
basic prices)<br />
Output<br />
(5.15)<br />
<strong>Tourism</strong><br />
share<br />
0.0 0.0 1480.4 1228.7 0.0 0.0 1480.4 1228.7<br />
2 – Restaurants and similar 0.0 0.0 2315.5 509.4 0.0 0.0 2315.5 509.4<br />
3 – Transport services<br />
3.2 Road transport services 0.0 0.0 1068.8 106.9 0.0 0.0 1068.8 106.9<br />
3.4 Air transport services 0.0 0.0 668.6 635.2 0.0 0.0 668.6 635.2<br />
4 – Travel agencies and similar<br />
Reservation services (1) (2) 149.0 149.0 149.0 149.0 0.0 0.0 149.0 149.0<br />
B. Non specific products<br />
Services/ Goods (3) 0.0 0.0 145.4 66.9 89921.7 899.2 90067.1 966.2<br />
TOTAL output (at basic prices) 149.0 149.0 5827.8 2696.2 89921.7 899.2 95749.4 3595.4<br />
Direct Imports & Duties 16.7 16.7 911.4 377.4 8343.9 83.4 9255.3 460.9<br />
1. Agriculture, forestry and fishery<br />
0.0 0.0 2.8 1.1 984.9 9.8 987.7 11.0<br />
products<br />
2. Ores and minerals 0.1 0.1 0.1 0.1 92.3 0.9 92.4 1.0<br />
3. Electricity, gas and water 1.7 1.7 105.7 43.0 716.4 7.2 822.1 50.1<br />
4. Manufacturing 2.7 2.7 667.3 270.4 2582.9 25.8 3250.2 296.3<br />
5. Construction work and<br />
construction<br />
6. Trade services, restaurants and<br />
hotel services<br />
7. Transport, storage and<br />
communication services<br />
2.9 2.9 118.1 51.6 2205.2 22.1 2323.4 73.7<br />
1.8 1.8 80.1 32.7 4734.5 47.3 4814.6 80.1<br />
3.4 3.4 484.6 200.9 1543.1 15.4 2027.7 216.3<br />
8. Business services 5.1 5.1 521.6 257.3 2162.6 21.6 2684.2 279.0<br />
9. Community, social and personal<br />
services<br />
Total intermediate consumption<br />
(at purchasers price)<br />
1.4 1.4 140.9 45.3 684.3 6.8 825.2 52.2<br />
35.7 35.7 3032.7 1279.9 24050.1 240.5 27082.8 1520.4<br />
Wholesale and Retail Cost <strong>of</strong><br />
0.0 0.0 0.0 0.0 18956.6 189.6 18956.6 189.6<br />
Sales<br />
Total gross value added <strong>of</strong><br />
113.3 113.3 2795.1 1416.2 46915.0 469.2 49710.1 1885.4<br />
activities (at basic prices)<br />
Compensation <strong>of</strong> employees 33.4 33.4 730.5 328.8 13000.9 130.0 13731.4 458.8<br />
Other taxes less subsidies on<br />
-4.2 -4.2 2.4 -3.0 -1.7 0.0 0.7 -3.0<br />
production<br />
Depreciation 26.9 26.9 624.8 215.9 5976.3 59.8 6601.1 275.7<br />
Gross Operating surplus(incl.mixed 57.2 57.2 1437.1 874.2 27939.3 279.4 29376.4 1153.6<br />
in.)<br />
Adjustment 0.0 0.0 0.2 0.3 0.3 0.0 0.5 0.3<br />
30