Tourism Statistics - Government of Botswana
Tourism Statistics - Government of Botswana
Tourism Statistics - Government of Botswana

You also want an ePaper? Increase the reach of your titles
YUMPU automatically turns print PDFs into web optimized ePapers that Google loves.
Table 2.1: Tourist Arrivals by Country <strong>of</strong> Residence (Overnight Visitors)<br />
Residence 2001 2002 2003 2004<br />
Africa South Africa 557,747 527,505 514,708 626,207<br />
Zimbabwe 354,230 454,847 550,994 576,328<br />
Namibia 50,251 64,001 69,587 57,542<br />
Zambia 41,430 25,637 83,588 72,492<br />
Americas USA 21,619 16,322 15,087 17,670<br />
Canada 2,632 1,932 2,065 2,811<br />
Far East Australia 5,669 5,728 5,708 5,595<br />
Japan 3,144 2,281 2,492 2,518<br />
Europe UK 18,486 20,548 18,518 24,069<br />
Germany 9,170 9,985 10,444 9,685<br />
Netherlands 6,342 6,377 6,146 4,929<br />
France 4,381 3,596 3,732 3,989<br />
Italy 3,087 2,323 2,782 3,196<br />
Total 1,193,399 1,273,814 1,405,985 1,522,847<br />
Source: <strong>Tourism</strong> <strong>Statistics</strong> 2001-2005, Department <strong>of</strong> <strong>Tourism</strong><br />
Tourist arrivals give an indication <strong>of</strong> numbers coming into <strong>Botswana</strong> but these numbers have to be<br />
converted into tourist expenditure. This requires information on how long visitors are staying in<br />
<strong>Botswana</strong> and how much they are spending in <strong>Botswana</strong>, as well as a breakdown <strong>of</strong> what<br />
products they are spending on.<br />
Visitor Surveys play the key role in estimating this information (See Annex 3 – Visitor Surveys).<br />
Key information from the Visitor Surveys on these three variables is set out below.<br />
Average Length <strong>of</strong> Stay<br />
Because a total figure for tourist arrivals embraces such a wide range <strong>of</strong> different types <strong>of</strong> visitor,<br />
many <strong>of</strong> them undertaking different activities and staying for varying periods, it is best to try to<br />
segment this total in various ways. „Country <strong>of</strong> residence‟ and the „purpose <strong>of</strong> visit‟ have been<br />
looked at in particular. Average length <strong>of</strong> stay varies according to the purpose <strong>of</strong> visit. Examples<br />
include some transit visitors who are staying for only a<br />
night whilst holiday visitors can be staying for nearly six<br />
nights on average. For our reference year <strong>of</strong> 2005/2006<br />
an average for the length <strong>of</strong> stay between the sample<br />
survey data for the Year 2005 and the Year 2006, as<br />
shown in Annex 3 - Table A3.1, has been adopted.<br />
In order to use figures with a lower relative sampling<br />
error, the sample data has <strong>of</strong>ten been brought together<br />
into larger groupings. The relative sampling error (the<br />
standard error times 1.96 – 95% confidence level) has<br />
been calculated as a percentage <strong>of</strong> the arithmetic mean.<br />
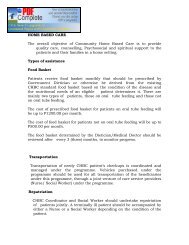
Photo 3: Interviewing at Tlokweng Gate<br />
Average Direct Expenditure per Day<br />
Expenditure data has been gleaned from the DOT visitor surveys for 2005 and 2006. In a similar<br />
manner to the „length <strong>of</strong> stay‟, for our reference year <strong>of</strong> 2005/2006, An average for the „expenditure<br />
per day‟ between the sample survey data for the Year 2005 and the Year 2006 has been adopted.<br />
Using the „country <strong>of</strong> residence‟ and the „purpose <strong>of</strong> visit‟ as a way <strong>of</strong> segmenting the total figures<br />
allows one to take into account the considerable disparity in „length <strong>of</strong> stay‟ and „expenditure per<br />
day‟ between individual tourist arrivals. The base figures for expenditure per day are shown in<br />
Annex 3 - Table A3.2. Ideally it is „good practice‟ to focus upon expenditure with relative sampling<br />
errors below 25%, but this has not always been possible in this process.<br />
13