Tourism Statistics - Government of Botswana
Tourism Statistics - Government of Botswana
Tourism Statistics - Government of Botswana

You also want an ePaper? Increase the reach of your titles
YUMPU automatically turns print PDFs into web optimized ePapers that Google loves.
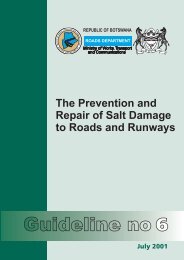
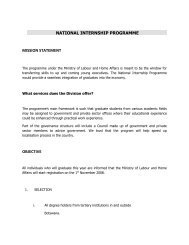
Figure 2.2 – Direct Expenditure by Source Market<br />
DIRECT EXPENDITURE FROM SOURCE MARKET<br />
Australia France Germany<br />
Namibia<br />
Other<br />
South Africa<br />
Zimbabw e<br />
Zambia<br />
USA<br />
UK<br />
Australia France Germany Namibia South Africa UK USA Zambia Zimbabw e Other<br />
Breakdown <strong>of</strong> the Visitor Spending<br />
Sample estimates <strong>of</strong> the breakdown <strong>of</strong> overnight visitor expenditure are obtained from DOT visitor<br />
surveys in 2005 and in 2006. The key feature <strong>of</strong> these breakdowns is that this is the expenditure<br />
by the tourist himself or herself.<br />
The breakdowns <strong>of</strong> expenditure and the figures adopted for 2005/2006 are shown in the Table 2.4<br />
below. These figures derive from the respondent‟s view on how much he spent on the different<br />
categories <strong>of</strong> expenditure.<br />
Table 2.4: Breakdown <strong>of</strong> the Direct Spending by Overnight Visitors in <strong>Botswana</strong> – 2005/06<br />
Adopted for<br />
2005/2006<br />
Direct Spend<br />
P millions<br />
Money Spent on Accommodation 33% 831<br />
Money Spent on Meals and Drink 11% 277<br />
Money Spent on Transport 7% 176<br />
Money Spent on Recreation 7% 176<br />
Money Spent on Shopping 16% 403<br />
Money Spent on 'Other' Spending 26% 654<br />
Total 100% 2,517<br />
Source: DOT Visitor Surveys<br />
15