Tourism Statistics - Government of Botswana
Tourism Statistics - Government of Botswana
Tourism Statistics - Government of Botswana

You also want an ePaper? Increase the reach of your titles
YUMPU automatically turns print PDFs into web optimized ePapers that Google loves.
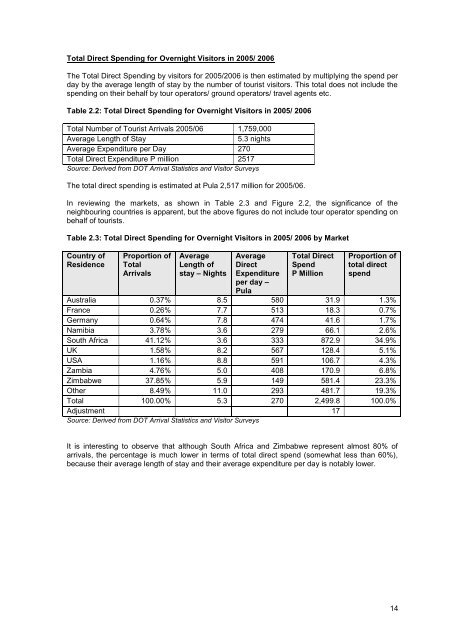
Total Direct Spending for Overnight Visitors in 2005/ 2006<br />
The Total Direct Spending by visitors for 2005/2006 is then estimated by multiplying the spend per<br />
day by the average length <strong>of</strong> stay by the number <strong>of</strong> tourist visitors. This total does not include the<br />
spending on their behalf by tour operators/ ground operators/ travel agents etc.<br />
Table 2.2: Total Direct Spending for Overnight Visitors in 2005/ 2006<br />
Total Number <strong>of</strong> Tourist Arrivals 2005/06 1,759,000<br />
Average Length <strong>of</strong> Stay<br />
5.3 nights<br />
Average Expenditure per Day 270<br />
Total Direct Expenditure P million 2517<br />
Source: Derived from DOT Arrival <strong>Statistics</strong> and Visitor Surveys<br />
The total direct spending is estimated at Pula 2,517 million for 2005/06.<br />
In reviewing the markets, as shown in Table 2.3 and Figure 2.2, the significance <strong>of</strong> the<br />
neighbouring countries is apparent, but the above figures do not include tour operator spending on<br />
behalf <strong>of</strong> tourists.<br />
Table 2.3: Total Direct Spending for Overnight Visitors in 2005/ 2006 by Market<br />
Country <strong>of</strong><br />
Residence<br />
Proportion <strong>of</strong><br />
Total<br />
Arrivals<br />
Average<br />
Length <strong>of</strong><br />
stay – Nights<br />
Average<br />
Direct<br />
Expenditure<br />
per day –<br />
Pula<br />
Total Direct<br />
Spend<br />
P Million<br />
Proportion <strong>of</strong><br />
total direct<br />
spend<br />
Australia 0.37% 8.5 580 31.9 1.3%<br />
France 0.26% 7.7 513 18.3 0.7%<br />
Germany 0.64% 7.8 474 41.6 1.7%<br />
Namibia 3.78% 3.6 279 66.1 2.6%<br />
South Africa 41.12% 3.6 333 872.9 34.9%<br />
UK 1.58% 8.2 567 128.4 5.1%<br />
USA 1.16% 8.8 591 106.7 4.3%<br />
Zambia 4.76% 5.0 408 170.9 6.8%<br />
Zimbabwe 37.85% 5.9 149 581.4 23.3%<br />
Other 8.49% 11.0 293 481.7 19.3%<br />
Total 100.00% 5.3 270 2,499.8 100.0%<br />
Adjustment 17<br />
Source: Derived from DOT Arrival <strong>Statistics</strong> and Visitor Surveys<br />
It is interesting to observe that although South Africa and Zimbabwe represent almost 80% <strong>of</strong><br />
arrivals, the percentage is much lower in terms <strong>of</strong> total direct spend (somewhat less than 60%),<br />
because their average length <strong>of</strong> stay and their average expenditure per day is notably lower.<br />
14