Financial Report and Registration Document 2010 - Groupe Seb
Financial Report and Registration Document 2010 - Groupe Seb
Financial Report and Registration Document 2010 - Groupe Seb

Create successful ePaper yourself
Turn your PDF publications into a flip-book with our unique Google optimized e-Paper software.
FINANCIAL REPORT<br />
AND REGISTRATION DOCUMENT<br />
<strong>2010</strong><br />
COUVERTURE À VENIR
CONTENTS<br />
GROUP PROFILE AND KEY FIGURES <strong>2010</strong> 1<br />
1<br />
GROUPE SEB IN <strong>2010</strong> 3<br />
Milestones in the history of the Group 4<br />
Business sectors 6<br />
Group strategy 8<br />
Industrial strategy 9<br />
Management report on <strong>2010</strong> 11<br />
Outlook for 2011 18<br />
Risk management 19<br />
Social performance indicators 26<br />
Environment performance indicators 32<br />
2<br />
CORPORATE GOVERNANCE 35<br />
Board of Directors 36<br />
Organization <strong>and</strong> operation of the Board of Directors 42<br />
Group management bodies 45<br />
Chairman’s report on internal control 51<br />
Statutory auditors’ report on internal control 56<br />
Statutory auditors 57<br />
5<br />
ANNUAL GENERAL MEETING 135<br />
<strong>Report</strong> of the Board of Directors on the resolutions proposed<br />
to the Annual General Meeting of 17 May 2011 136<br />
Auditors’ special report on regulated agreements<br />
<strong>and</strong> commitments with third parties 139<br />
Proposed resolutions 141<br />
6<br />
ADDITIONAL INFORMATION 147<br />
General information concerning SEB S.A. 148<br />
Share capital breakdown <strong>and</strong> changes 151<br />
<strong>Financial</strong> authorizations 155<br />
Employee shareholding 156<br />
Stock market <strong>and</strong> dividend information 160<br />
Consultation of legal documents 162<br />
Notes 163<br />
FINANCIAL AGENDA 2011 166<br />
3<br />
CONSOLIDATED FINANCIAL STATEMENTS 59<br />
<strong>Financial</strong> summary 60<br />
Consolidated ratios 61<br />
<strong>Financial</strong> statements 62<br />
Notes to the consolidated financial statements 67<br />
Statutory auditors’ report on the consolidated financial statements 116<br />
4<br />
COMPANY FINANCIAL STATEMENTS 117<br />
Balance sheet – at 31 December 118<br />
Income statement – years ended 31 December 120<br />
<strong>Report</strong> of the Board of Directors 121<br />
Notes to the Company financial statements 122<br />
Auditors’ report on the Company financial statements 133<br />
FINANCIAL REPORT AND REGISTRATION DOCUMENT <strong>2010</strong><br />
GROUPE SEB
GROUP PROFILE<br />
AND KEY FIGURES <strong>2010</strong><br />
GROUPE SEB,<br />
IN TOUCH WITH<br />
CHANGING TIMES<br />
With a presence in almost 150 countries, <strong>Groupe</strong> SEB has<br />
earned strong positions on all continents through a wide,<br />
diversifi ed product range <strong>and</strong> an exceptional br<strong>and</strong><br />
portfolio. Today it is the world leader in Small Household<br />
Equipment.<br />
Its success is rooted in its ability to innovate <strong>and</strong> invent<br />
for daily life in tomorrow’s world.<br />
A MULTI-SPECIALIST GROUP<br />
COOKWARE<br />
Frying pans, saucepans, casseroles, baking trays,<br />
oven dishes, pressure cookers, low-pressure steam<br />
pots, kitchen utensils, etc.<br />
KITCHEN ELECTRICS<br />
Electric cooking: deep fryers, table-top ovens, rice<br />
cookers, induction hobs, electric pressure cookers,<br />
barbecues, informal meal appliances, waffle makers,<br />
meat grills, toasters, steam cookers, bread makers, etc.<br />
Preparation: food processors, beaters, mixers,<br />
blenders, centrifugal juice extractors, small foodpreparation<br />
equipment, coffee makers (pod, filter<br />
<strong>and</strong> espresso), electric kettles, hot-water dispensers,<br />
home beer-tapping machines, etc.<br />
HOME AND PERSONAL CARE<br />
Personal care: hair care equipment, depilators,<br />
bathroom scales, foot massage appliances, baby-care<br />
equipment (bottles, bottle-heaters, sterilizers,<br />
nightlights) etc.<br />
Linen care: steam irons <strong>and</strong> steam systems,<br />
semi-automatic washing machines, garment steam<br />
brushes, etc.<br />
Home care: vacuum cleaners (upright or canister,<br />
with <strong>and</strong> without dust bag, compact <strong>and</strong> cordless),<br />
fans, heaters <strong>and</strong> air-conditioners, etc.<br />
SALES<br />
€3,652 M +15%<br />
OPERATING<br />
MARGIN<br />
€438 M +23%<br />
NET INCOME<br />
€220 M +51%<br />
WORLD RANKING<br />
No. 1<br />
No. 2<br />
No. 3<br />
Cookware – Pressure cookers – Steam irons <strong>and</strong> steam systems – Kettles – Steam cookers – Toasters –<br />
Fryers – Breadmakers – Informal meal appliances – Scales (bathroom scales <strong>and</strong> kitchen scales)<br />
Espresso coffee machines – Table top ovens – Waffle makers <strong>and</strong> s<strong>and</strong>wich makers<br />
Food preparation appliances – Electric depilators<br />
NET DEBT<br />
€131 M -€112 M<br />
CAPITAL<br />
EXPENDITURE<br />
€140 M +28 %<br />
OUR MARKET LEADERSHIP IS SUPPORTED BY FAMOUS BRANDS:<br />
World br<strong>and</strong>s: All-Clad, Krups, Lagostina, Moulinex, Rowenta <strong>and</strong> Tefal;<br />
Regional br<strong>and</strong>s: Calor <strong>and</strong> <strong>Seb</strong> (France <strong>and</strong> Belgium), T-fal, Mirro WearEver, AirBake,<br />
Regal (North America), Arno, Panex, Rochedo, Penedo, Clock, Samurai* (South America), <strong>and</strong> Supor (China).<br />
* In addition to Imusa <strong>and</strong> Umco in 2011.<br />
EMPLOYEES<br />
23,058 PEOPLE<br />
31/12/<strong>2010</strong><br />
WORLDWIDE<br />
GROUPE SEB<br />
FINANCIAL REPORT AND REGISTRATION DOCUMENT <strong>2010</strong><br />
1
This <strong>Registration</strong> <strong>Document</strong> was filed with the French <strong>Financial</strong> Markets Authority (Autorité des marchés financiers or AMF) on 7 April 2011,<br />
in accordance with Article 212-13 of AMF general regulations. It may be used as a basis for financial transactions if it is accompanied by an AMF<br />
information memor<strong>and</strong>um. This document was drawn up by <strong>and</strong> is the responsibility of the issuer <strong>and</strong> the Chairman <strong>and</strong> CEO.<br />
This <strong>Registration</strong> <strong>Document</strong> is available on the <strong>Groupe</strong> SEB website, www.groupeseb.com <strong>and</strong> on the AMF website www.amf-france.org<br />
2 FINANCIAL REPORT AND REGISTRATION DOCUMENT <strong>2010</strong> GROUPE SEB
GROUPE SEB IN <strong>2010</strong><br />
1<br />
GROUPE SEB<br />
IN <strong>2010</strong><br />
MILESTONES IN THE HISTORY OF THE GROUP 4<br />
External growth: a dynamic acquisition strategy 4<br />
Organic growth:<br />
innovation <strong>and</strong> international expansion 5<br />
BUSINESS SECTORS 6<br />
Separate <strong>and</strong> complementary business models 7<br />
Multiple forms of competition 7<br />
GROUP STRATEGY 8<br />
A long term strategy 8<br />
INDUSTRIAL STRATEGY 9<br />
Research & Development 10<br />
Partnerships 10<br />
Purchasing 10<br />
MANAGEMENT REPORT ON <strong>2010</strong> 11<br />
<strong>2010</strong> Highlights 11<br />
Comments on <strong>2010</strong> sales 13<br />
Comments on <strong>2010</strong> results 15<br />
OUTLOOK FOR 2011 18<br />
RISK MANAGEMENT 19<br />
Risks inherent to operations 19<br />
Dependency risks 22<br />
Legal risks 23<br />
<strong>Financial</strong> market risks 23<br />
Sensitivity analysis 24<br />
Insurance 24<br />
Exceptional events <strong>and</strong> litigation 25<br />
SOCIAL PERFORMANCE INDICATORS 26<br />
Payroll <strong>and</strong> charges 26<br />
Breakdown of employees by geographical zone 26<br />
Breakdown of employees by category 27<br />
Breakdown of changes in staffing 27<br />
Breakdown of employees by type of contract 27<br />
Persons with disabilities 28<br />
Absenteeism 28<br />
Breakdown by gender <strong>and</strong> category 28<br />
Collective agreements 29<br />
External labour 29<br />
Paid overtime 29<br />
Workplace safety: frequency <strong>and</strong> severity 29<br />
Training (staff <strong>and</strong> training hours) 30<br />
Training budget 30<br />
<strong>Groupe</strong> SEB academy training 30<br />
Bonuses <strong>and</strong> profit sharing 31<br />
ENVIRONMENT PERFORMANCE INDICATORS 32<br />
Energy consumption 32<br />
Greenhouse gas emissions 32<br />
Waste 33<br />
ISO certification 33<br />
1<br />
GROUPE SEB FINANCIAL REPORT AND REGISTRATION DOCUMENT <strong>2010</strong><br />
3
1 MILESTONES<br />
GROUPE SEB IN <strong>2010</strong><br />
IN THE HISTORY OF THE GROUP<br />
MILESTONES IN THE HISTORY<br />
OF THE GROUP<br />
<strong>Groupe</strong> SEB dates from 1857 with the creation of the company Antoine<br />
Lescure, in Burgundy, France. Beginning as a tinware company specialized<br />
in making buckets <strong>and</strong> watering cans, it gradually exp<strong>and</strong>ed its activities to<br />
include kitchen utensils, zinc tubs <strong>and</strong> other articles. It began to mechanize<br />
production when it bought its first press at the beginning of the 20th century.<br />
At that time, the company’s business was confined to its local region.<br />
It took a major stride forward in 1953 when it launched the pressure cooker.<br />
This gave the company, thereafter called Société d’Emboutissage de<br />
Bourgogne, a new national dimension.<br />
The subsequent history of the Group would take shape through successive<br />
phases of acquisitions <strong>and</strong> organic growth.<br />
EXTERNAL GROWTH: A DYNAMIC ACQUISITION STRATEGY<br />
A series of acquisitions over the last 40 years has enabled <strong>Groupe</strong> SEB to<br />
diversify its activities <strong>and</strong> exp<strong>and</strong> internationally.<br />
CREATION OF THE GROUP<br />
In 1968, SEB acquired Tefal, a company specialized in nonstick cookware;<br />
in 1972, it took over the Lyon-based company Calor, a maker of irons, hair<br />
dryers, small washing machines <strong>and</strong> portable radiators. This established<br />
SEB as a leading operator in Small Household Equipment in France. In 1973,<br />
it decided to form a group structure under a lead holding company, SEB S.A.,<br />
which would be listed on the Paris Stock Exchange in 1975.<br />
GLOBAL STATUS<br />
The 1988 acquisition of Rowenta, whose German <strong>and</strong> French factories made<br />
irons, electric coffee makers, toasters <strong>and</strong> vacuum cleaners, was a crucial<br />
step in the Group’s international expansion. In 1997-1998, the takeover of<br />
Arno, Brazil’s market leader in small electrical appliances, established the<br />
Group in South America. Arno was a specialist in the manufacture <strong>and</strong> sale<br />
of food-preparation appliances (mixers/blenders), non-automatic washing<br />
machines <strong>and</strong> fans. At the same time, the Group acquired Volmo, a leading<br />
producer of small electrical appliances in Colombia <strong>and</strong> Venezuela, with its<br />
own product range in food-preparation appliances (mixers/blenders), fans<br />
<strong>and</strong> irons.<br />
September 2001 saw Moulinex, the Group’s main rival in France, file<br />
for bankruptcy. <strong>Groupe</strong> SEB’s offer of a partial takeover of the assets of<br />
Moulinex <strong>and</strong> its subsidiary Krups was accepted by the Nanterre Commercial<br />
Court in October 2001. The integration of that portion of Moulinex-Krups<br />
confirmed the global stature of <strong>Groupe</strong> SEB through a stronger presence<br />
in certain product categories <strong>and</strong> the addition of two international br<strong>and</strong>s.<br />
After much legal debate at the European Commission <strong>and</strong> in France, the<br />
final authorizations for the takeover were obtained in 2005.<br />
REINFORCEMENT OF COOKWARE OPERATIONS<br />
Meanwhile, in the summer of 2004 the Group took the opportunity to<br />
strengthen its base in the United States with the acquisition of All-Clad,<br />
a premium-range cookware specialist whose product offer was an ideal<br />
complement to the fairly broad T-fal br<strong>and</strong> on the US market. In May<br />
<strong>and</strong> June 2005, the Group once again enhanced its offer with two more<br />
takeovers: Lagostina in Italy <strong>and</strong> Panex in Brazil. Lagostina, Italy’s leader in<br />
top-range stainless steel cookware (saucepans, frying pans <strong>and</strong> pressure<br />
cookers) has a prestige br<strong>and</strong> image that affords the Group access to new<br />
markets. Meanwhile, Panex, with its four br<strong>and</strong>s at the top of ranges which<br />
extend over several market segments, helped us to penetrate the Brazilian<br />
market with an extensive cookware offer <strong>and</strong> instantly occupy a front-rank<br />
position. The acquisition of Panex further bolstered our strong presence in<br />
the country in small electrical appliances with the Arno br<strong>and</strong>.<br />
In August 2006, the Group embarked on a new phase of consolidation in its<br />
cookware business with the acquisition of selected assets of the American<br />
company Mirro WearEver. More present in entry-level products, these allow a<br />
more focused repositioning on mid-range T-fal articles <strong>and</strong> the introduction of<br />
new dynamics. The Group accordingly became leader of the North American<br />
market in cookware with a complete offering covering all market segments,<br />
up to All-Clad premium products.<br />
In the same year, the Group initiated a process to buy a majority stake<br />
in Supor, China’s domestic market leader in cookware <strong>and</strong> number 3 in<br />
small electric cooking appliances. As Supor is listed on the Shenzhen<br />
Stock Exchange <strong>and</strong> as this kind of transaction was without a precedent<br />
in China, the deal required various authorizations from China’s Trade<br />
Ministry (MOFCOM) <strong>and</strong> the country’s securities regulator (CSRC).<br />
Having acquired an initial 30% stake in Supor’s capital on 31 August<br />
2007, the Group raised this to a 52.74% controlling stake in Supor on<br />
21 December 2007 following a successful public share purchase offer.<br />
Further to exercises of stock-options by some Supor executives, <strong>Groupe</strong><br />
SEB currently holds 51.31% of Supor’s capital. Acquiring controlling interests<br />
in Supor is a major strategic step forward because it allows the Group to tap<br />
into the huge potential of the Chinese market.<br />
4 FINANCIAL REPORT AND REGISTRATION DOCUMENT <strong>2010</strong> GROUPE SEB
1<br />
GROUPE SEB IN <strong>2010</strong><br />
MILESTONES IN THE HISTORY OF THE GROUP<br />
ORGANIC GROWTH: INNOVATION AND INTERNATIONAL EXPANSION<br />
New product development <strong>and</strong> the conquest of new markets are two<br />
key pillars of our strategy. Innovation is critical to the vitality of the Small<br />
Household Equipment sector <strong>and</strong> it gives the Group the head start it requires<br />
to stay ahead of competition <strong>and</strong> acquire solid positions on markets.<br />
At the same time, the geographic expansion offers new opportunities, with<br />
amongst other things, a better international balance of our trading activity<br />
<strong>and</strong> enhanced exposure to the strong potential of emerging markets, which<br />
constitute growth drivers for the future.<br />
A STRONG INNOVATION POLICY<br />
Both SEB <strong>and</strong> Moulinex, ever since they were founded, have set out to offer<br />
innovative products that contribute to the daily well-being of consumers.<br />
Emblematic products such as the <strong>Seb</strong> pressure cooker <strong>and</strong> the Moulinex<br />
purée h<strong>and</strong>press paved the way for the first electrical appliances in the 50s<br />
<strong>and</strong> 60s: irons, coffee grinders, odourless fryers, <strong>and</strong> the Charlotte <strong>and</strong><br />
Marie multipurpose appliances… The 70s <strong>and</strong> 80s marked the arrival of<br />
more sophisticated functions with the introduction of electronics-enhanced<br />
new products: bathroom scales, programmable coffee machines, etc.<br />
This era also saw the emergence of new lifestyles, reflected in the launch<br />
of convivial products such as the raclette grill <strong>and</strong> home espresso coffee<br />
maker. In the decade up to 2000, both <strong>Groupe</strong> SEB <strong>and</strong> Moulinex brought<br />
new simplicity to the world of small household equipment: pressure cookers<br />
with simplified closing mechanisms, removable h<strong>and</strong>les for frying pans <strong>and</strong><br />
saucepans, compact vacuum cleaners with triangular-shaped heads, coffee<br />
makers incorporating grinder-dosers, frying pans with a visual heat indicator,<br />
<strong>and</strong> food processors designed for easy storage…<br />
The 2000s marked a new acceleration in the product offer renewal process<br />
through:<br />
its fi rst partnerships developed by the Group from 2006 with leading<br />
food-industry operators gave it access to new product categories such<br />
as pod coffee makers <strong>and</strong> draught beer tapping machines:<br />
the introduction of several innovative concepts, answers to new consumer<br />
expectations (nutrition <strong>and</strong> health, home-made, ease, wellbeing, etc.),<br />
often accompanied by major commercial success: the Actifry “oil free”<br />
fryer, the Silence Force vacuum cleaner which combines power with low<br />
sound level, steam cookers, bread makers, knock-down, washable silent<br />
fans, anti-mosquito devices, etc.;<br />
the introduction of new functional features in linen care, such as a<br />
self-cleaning iron soleplate <strong>and</strong> an anti-scaling system for steam<br />
generators, etc.<br />
HEADING FOR NEW MARKETS<br />
In the 1970s, <strong>Groupe</strong> SEB turned its attention to international growth.<br />
Building on its “cookware” expertise, it began by penetrating the Japanese<br />
<strong>and</strong> American markets with its nonstick Tefal frying pans <strong>and</strong> saucepans.<br />
In 1992 <strong>and</strong> 1993, it took advantage of the opening of Eastern Europe,<br />
by creating retail distribution operations in central European countries<br />
<strong>and</strong> by gaining greater access to the Russian market. From 1994 to 2000,<br />
it focused on building up its commercial operations worldwide <strong>and</strong>, where<br />
appropriate, its industrial presence by setting up factories in South America,<br />
China <strong>and</strong> elsewhere. Over the years, the Group exp<strong>and</strong>ed its activities to all<br />
the continents <strong>and</strong> built its international manufacturing bases. It continued<br />
exp<strong>and</strong>ing in Asia with marketing subsidiaries created in Thail<strong>and</strong> <strong>and</strong><br />
Taiwan in 2003, <strong>and</strong> in Singapore <strong>and</strong> Malaysia in 2004. It then reinforced<br />
its presence in South America by opening a subsidiary in Peru. In 2005,<br />
the Group created a subsidiary in Switzerl<strong>and</strong> to manage its operations in<br />
that country directly. Meanwhile, to support emerging markets in Northern,<br />
Central <strong>and</strong> Eastern Europe, the Group strengthened its presence in these<br />
zones by setting up subsidiaries in Romania in 2005, in Ukraine <strong>and</strong> Slovenia<br />
in 2006 <strong>and</strong> in Latvia in 2007. This drive continued in Bulgaria in 2008, while<br />
in South-East Asia, Supor opened a new factory in Vietnam. At the same<br />
time, the Group created Lojas in Brazil, a company that comprises the ownbr<strong>and</strong><br />
stores opened in Brazil to have a direct sales approach <strong>and</strong> create<br />
an additional sales outlet.<br />
The strength of <strong>Groupe</strong> SEB lies in its ability to blend innovation – a key<br />
factor of success – with international operations that bring it closer to its<br />
retail clients <strong>and</strong> customers. These are the two pillars upon which the Group<br />
continues to build its development.<br />
1<br />
GROUPE SEB<br />
FINANCIAL REPORT AND REGISTRATION DOCUMENT <strong>2010</strong><br />
5
1 BUSINESS<br />
GROUPE SEB IN <strong>2010</strong><br />
SECTORS<br />
BUSINESS SECTORS<br />
As a global leader in small household equipment, <strong>Groupe</strong> SEB deploys<br />
its strategy via a portfolio of diversified <strong>and</strong> complementary br<strong>and</strong>s<br />
in multi-region or local markets. <strong>Groupe</strong> SEB st<strong>and</strong>s out from its main<br />
rivals by being present in both the small electrical appliance sector (which<br />
accounts for 70% of its sales) – estimated to be worth €27.5 billion – <strong>and</strong><br />
cookware (a sector worth around €6.5 billion).<br />
Overall, the Small Household Equipment sector has been growing at a steady<br />
rate of about 4% every year, characterized by:<br />
sustained dem<strong>and</strong> in the majority of mature markets – where although the<br />
equipment rate is already high, it is heterogeneous in terms of product<br />
families – driven by strong reactivity to innovation (new products <strong>and</strong><br />
concepts) <strong>and</strong> by the need to upgrade the range in search of more statusrelated<br />
products;<br />
an average sale price close to €55 for a small electrical appliance in<br />
developed countries, being accessible for most consumers <strong>and</strong> requiring<br />
little or no use of credit;<br />
shorter product use cycles in addition to an increasing average equipment<br />
rate in certain categories which are driving these renewal markets;<br />
steady <strong>and</strong> increasingly unavoidable increase in industrial partnerships<br />
between manufacturers of small electrical appliances <strong>and</strong> actors of various<br />
mass consumer goods, especially through joining forces to propose new<br />
offerings <strong>and</strong> services. Development of the single-portion coffee concept<br />
is a significant example;<br />
market fundamentals hardened in the United States <strong>and</strong> the UK, where<br />
for several years retail has imposed its low price policy <strong>and</strong> levelled the<br />
field of a major part of supply towards entry level, with the result of little<br />
or no innovation <strong>and</strong> a race towards size for manufacturers/suppliers;<br />
the emergence of new consumer trends worldwide: more western in Asian<br />
or South-American countries, more ethnic in western countries, back to<br />
“home-made” <strong>and</strong> control over food in Europe, heightened environmental<br />
awareness, etc.;<br />
strong knowledge of dem<strong>and</strong> in emerging markets, markets in equipment<br />
phase fuelled by galloping urbanisation <strong>and</strong> the development of the<br />
real estate market, booming middle class access to consumption,<br />
development of modern retail distribution, etc.<br />
BREAKDOWN OF THE SMALL HOUSEHOLD EQUIPMENT<br />
MARKET, BY PRODUCT FAMILY<br />
Home care 23%<br />
Linen care 5%<br />
Food preparation 7%<br />
Beverage preparation 9%<br />
Personal care 10%<br />
Home comfort 12%<br />
Electric cooking 15%<br />
Cookware 19%<br />
Sources Estin-<strong>Groupe</strong> SEB, <strong>2010</strong> addressable market estimates.<br />
From a geographical viewpoint, the global market of Small Household<br />
Equipment does not present any real homogeneity because it is fragmented<br />
into numerous national/regional markets. They are fuelled by a complex<br />
<strong>and</strong> multiple retail distribution which varies depending on regional<br />
consumption habits, the maturity of markets, targets or product ranges:<br />
hyper/supermarkets, specialist retailers, department stores, traditional<br />
points of sale, high-end boutiques, etc. with rapid <strong>and</strong> recent development<br />
of alternative distribution channels – internet, factory shops, own-br<strong>and</strong><br />
stores, discounters, etc.<br />
For more than a decade now, a growing part of the production of small<br />
electrical appliances has been relocated to countries with low production<br />
costs, especially in China, due to the availability of low-cost labour.<br />
For certain products, stemming mostly from assembly processes (toasters,<br />
coffee fi lters, kettles, hair dryers, etc.), nearly all global manufacturing is<br />
based in China. In fact, the small size of these products makes it easy<br />
for them to be shipped over long distances at very reasonable costs <strong>and</strong><br />
therefore to be competitive in their destination markets. This phenomenon<br />
is more evident on entry level or low value-added products.<br />
6 FINANCIAL REPORT AND REGISTRATION DOCUMENT <strong>2010</strong> GROUPE SEB
1<br />
GROUPE SEB IN <strong>2010</strong><br />
BUSINESS SECTORS<br />
SEPARATE AND COMPLEMENTARY BUSINESS MODELS<br />
To respond to broad dem<strong>and</strong> ranging from first utility products to<br />
sophisticated solutions, a combination of three complementary approaches<br />
is used:<br />
an offering of basic, plain, low-priced products comprised almost entirely<br />
of finished articles procured in countries with low-cost production factors<br />
<strong>and</strong> which are used for rapid renewal of product ranges or promotional<br />
offers. The research process is then non-existent, development is short <strong>and</strong><br />
simplified, marketing <strong>and</strong> sales budgets are cut to a minimum (promotions<br />
for example). These entry-level products are mostly sold without being<br />
br<strong>and</strong>ed or under a retailer br<strong>and</strong>. In moderate growth, they represent a<br />
still modest portion of the small electrical appliance market because they<br />
concern a limited portion of the existing product offer;<br />
the development of good-quality mid-range products. The idea is<br />
to propose a full range for consumers to differentiate <strong>and</strong> renew their<br />
equipment: breakthrough products, innovative functions <strong>and</strong> unique<br />
benefits, resulting from a robust innovation approach, advanced high-tech<br />
performance, easy to use <strong>and</strong> clean, user friendly, time saving, design,<br />
h<strong>and</strong>y storage, <strong>and</strong> many more tangible features for consumers. For retail<br />
distribution, the approach translates into point-of-sale promotions <strong>and</strong><br />
store shelf layouts with the support of a steady marketing <strong>and</strong> advertising<br />
policy <strong>and</strong> an established customer service. This segment still represents<br />
the strongest part of the market, <strong>and</strong> the shrinkage factor in favour of<br />
higher-end <strong>and</strong> entry level products (hour-glass effect) has now stabilised;<br />
focus on the high-end market segment with carefully designed products<br />
which meet strict criteria of quality, results or appearance. These articles,<br />
leveraged by premium br<strong>and</strong>s, are aimed at dem<strong>and</strong>ing consumers<br />
<strong>and</strong>/or experts, looking for status symbols or high-value service. Thanks<br />
to a recent boom, these ranges are now marketed by dedicated sales<br />
teams who build genuine partnerships with selective distributors in order<br />
to exploit <strong>and</strong> optimise the huge development potential of these products<br />
in the long term. The segment is still sensitive to the economic situation,<br />
as demonstrated by the 2008-2009 crisis.<br />
These three market approach models are used together in nearly all mature<br />
markets <strong>and</strong> are beginning to appear in certain emerging markets.<br />
1<br />
MULTIPLE FORMS OF COMPETITION<br />
The Small Household Equipment market is very fragmented globally, both<br />
in small electrical appliances <strong>and</strong> in cookware. In practice, changes in the<br />
sector over the last ten years – with in particular, the increased relocation of<br />
production to countries with low production costs – have greatly changed<br />
the deal in the approach to markets, more local today than really global.<br />
For small electrical appliances, the industry’s ten biggest operators account<br />
for between €1 to €3.6 billion in sales <strong>and</strong> represent over 40% of the global<br />
market. Therefore, the Group has numerous <strong>and</strong> various competitors<br />
worldwide, but few of them have a global spectrum:<br />
Philips is certainly the fi rst rival through its small electrical appliances<br />
<strong>and</strong> its worldwide presence; other industry giants with extensive<br />
offering <strong>and</strong> global coverage include DeLonghi (DeLonghi, Kenwood…),<br />
Procter & Gamble (Braun, Oral-B), Bosch-Siemens, <strong>and</strong> Conair (Babyliss,<br />
Cuisinart…);<br />
other players are primarily present in their domestic market or a few<br />
reference markets: Magimix, Taurus, Imetec or Severin, specifi cally in<br />
various European countries; Spectrum Br<strong>and</strong>s (Black & Decker, George<br />
Foreman, Russell Hobbs, Remington…) <strong>and</strong> Jarden (Sunbeam, Mr Coffee,<br />
Oster…) in North America for example; Mallory, Mondial or again<br />
Britania, amongst others in South America; Zelmer in central Europe;<br />
Panasonic (also including the National br<strong>and</strong>) or Tiger in Japan; Midea,<br />
Joyoung or Airmate in China…;<br />
numerous high-end specialists concentrating on one or two product<br />
segments: Dyson, Vorwerk, Jura, Laurastar, etc.<br />
At the same time, another form of competition with “non-br<strong>and</strong>ed”<br />
products <strong>and</strong> retailer br<strong>and</strong>s proposes a predominantly entry-level range,<br />
which is aggressively priced as a result of one-off contracts with Chinese<br />
subcontractors.<br />
The market dynamism remains basically driven by large European groups<br />
such as <strong>Groupe</strong> SEB: Philips, Bosch Siemens or DeLonghi who develop new<br />
products <strong>and</strong> concepts, open new categories <strong>and</strong> set up in new territories.<br />
By doing this, they are winning market share, enjoying economies of scale<br />
<strong>and</strong> improving their competitiveness in terms of production, R&D <strong>and</strong><br />
retail distribution. Meanwhile, national players have grown stronger in the<br />
last years, boosting specifi c targeted offerings tailored to the markets.<br />
Furthermore, we observe the development of local competitors in booming<br />
Asian emerging markets.<br />
For certain cookware articles, the situation is even more fragmented since<br />
<strong>Groupe</strong> SEB is the only really global player. Some competitors deploy<br />
an international strategy but which is more limited geographically, or<br />
more restricted in terms of product offer. Significant international players<br />
include the US group Meyer (Silverstone, Farberware, Prestige, Anolon,<br />
Circulon br<strong>and</strong>s, etc.), the German br<strong>and</strong>s WMF (WMF, Silit, Kaiser…)<br />
<strong>and</strong> Fissler <strong>and</strong> the French Le Creuset. In addition to this structured<br />
competition, there is still a host of local players such as Staub/Zwilling in<br />
Europe, Tramontina in Brazil, ASD in China, Maspion in Indonesia, etc. plus<br />
retailer br<strong>and</strong>s which in many countries represent the Group’s only direct<br />
competition.<br />
GROUPE SEB<br />
FINANCIAL REPORT AND REGISTRATION DOCUMENT <strong>2010</strong><br />
7
1 GROUP<br />
GROUPE SEB IN <strong>2010</strong><br />
STRATEGY<br />
GROUP STRATEGY<br />
A LONG TERM STRATEGY<br />
<strong>Groupe</strong> SEB implements a long-term strategy focused on creating value<br />
through two major approaches:<br />
promote growth by:<br />
leveraging the strength <strong>and</strong> complementarity of its br<strong>and</strong>s. Thanks to its<br />
large portfolio of global (6: All-Clad, Krups, Lagostina, Moulinex,<br />
Rowenta <strong>and</strong> Tefal) <strong>and</strong> regional/local br<strong>and</strong>s (14 (1) : such as Calor<br />
<strong>and</strong> <strong>Seb</strong> in France, Arno, Panex <strong>and</strong> Samurai, among others in South<br />
America, T-fal in the US, Supor in China, etc.), the Group has an<br />
unrivalled international expansion as well as a coverage of all market<br />
segments, from entry-level to premium products,<br />
aggressively implementing an innovative product policy differentiated<br />
by br<strong>and</strong>, so as to st<strong>and</strong> out from the competition in each country,<br />
organising point-of-sale promotions <strong>and</strong> asserting itself as a key market<br />
player, in both retail distribution <strong>and</strong> final consumption. This is how the<br />
Group creates value for its retailer clients <strong>and</strong> consumers, defends the<br />
quality of its offering <strong>and</strong> contributes to improving <strong>and</strong> upgrading the<br />
market <strong>and</strong> reaffirming its product leadership,<br />
translating into a clear <strong>and</strong> well-segmented approach by retail<br />
distribution channel <strong>and</strong> by br<strong>and</strong> <strong>and</strong> reinforcing its presence in all<br />
existing channels in the country, regardless of their format, to ensure<br />
the most extensive coverage possible of markets <strong>and</strong> taking account of<br />
specific local features. The goal is to develop a long-term constructive<br />
relationship with distributors on the basis of the most extensive product<br />
offer on the market <strong>and</strong> with strong br<strong>and</strong>s, vectors of growth <strong>and</strong><br />
profitability for each of the parties. Furthermore, the Group develops<br />
a network of own stores under the “Home & Cook” label, in order to<br />
complete its sales arsenal in areas that are barely covered by modern or<br />
traditional channels. At the same time, it has jumped into the booming<br />
business of e-commerce,<br />
continuing its unique international expansion, in both mature markets<br />
as well as emerging markets, <strong>and</strong> targeting local leadership, or in any<br />
case, the signifi cant improvement of its competitive position in the<br />
market. This geographical development involves continued organic<br />
growth – through new commercial operations in certain countries – <strong>and</strong><br />
an external growth policy via new acquisitions. The principle underlying<br />
this basic approach is to develop as a priority in structurally growing<br />
markets;<br />
maintain its competitiveness over time thanks to:<br />
the permanent <strong>and</strong> responsible adaptation of its industrial facilities as<br />
well as its organisation <strong>and</strong> structures (administrative, logistics, etc.),<br />
in order to be able to rely on some of the best st<strong>and</strong>ards in the world<br />
<strong>and</strong> preserve the head start forged over the years. Beyond the required<br />
industrial flexibility, the systematic implementation of best practices,<br />
shorter product times to market, plans to improve the effectiveness<br />
of structures, the very upstream integration of a dem<strong>and</strong>ing quality<br />
process or the optimisation of the supply chain are all recurring focus<br />
points for the Group,<br />
rigorous daily management – through strict control over all operating<br />
costs, reduction of purchase costs – whether industrial, linked to<br />
sourced products or outside production, in the context of an extended<br />
scope year after year – <strong>and</strong> keeping working capital requirements under<br />
control.<br />
These two fundamental approaches are closely linked since one of the major<br />
pillars for improving the Group’s profitability is the growth of sales linked to<br />
innovation. The capacity to launch new concepts <strong>and</strong> products, through<br />
differentiation <strong>and</strong> resulting improvement in the product mix, justifies high<br />
sales prices <strong>and</strong> generates better margins. This enhanced profitability allows<br />
the Group to invest again in R&D, marketing <strong>and</strong> advertising, with a boosting<br />
effect on turnover, thereby creating a virtuous circle.<br />
(1) 16 in March 2011 (Imusa <strong>and</strong> Umco) with the acquisition of Imusa in Colombia.<br />
8 FINANCIAL REPORT AND REGISTRATION DOCUMENT <strong>2010</strong> GROUPE SEB
1<br />
GROUPE SEB IN <strong>2010</strong><br />
INDUSTRIAL STRATEGY<br />
INDUSTRIAL STRATEGY<br />
The Group’s industrial strategy aims to continuously improve competitive<br />
performance <strong>and</strong> quality over the long term. The French <strong>and</strong> international<br />
production plan is deployed according to three major lines:<br />
Europe-based manufacturing for products when economies of scale<br />
are feasible <strong>and</strong> where the Group is a market leader, protecting its own<br />
product concepts using specifi c technologies for products (enabling a<br />
better product mix <strong>and</strong> justifying higher prices) or for processes (allowing<br />
a decrease in the cost price);<br />
use of its own plants outside Europe for economic mass-production where<br />
the Group wishes to retain control of its specific technologies in products<br />
<strong>and</strong> processes – these same factories also make products destined for<br />
local markets;<br />
sourcing of certain basic everyday products or articles in which the Group<br />
cannot exploit economies of scale.<br />
In Europe, the Group’s competitiveness involves expertise <strong>and</strong> technology<br />
centres. Product expertise centres bring together the specifi c expertise<br />
for a core activity or product category in research <strong>and</strong> development,<br />
industrialization <strong>and</strong> production. Technological centres reinforce product<br />
centres in key cross-disciplinary technologies such as materials, plastics,<br />
heating elements or electronics. Also present in industrial sites, project<br />
platforms comprise marketing, research <strong>and</strong> sourcing teams in charge of<br />
creating product offers.<br />
The Group’s industrial facility included a total of 24 industrial sites in<br />
<strong>2010</strong> (1) which produce 70% of products sold worldwide. The other 30%<br />
are outsourced, in particular to China. More specifically, the <strong>2010</strong> breakdown<br />
of production was as follows:<br />
LOCATION OF SALES PRODUCTION<br />
Europe 40%<br />
In <strong>2010</strong>, contrary to 2009, the operations of the Group’s European plants<br />
benefited from low inventories in retail distribution <strong>and</strong> the good performance<br />
<strong>and</strong>/or recovery of consumption in numerous countries, with a very<br />
favourable impact on volumes. Barring a few exceptions, the plants were<br />
in a rather good, or even very good position, in relation to absorption of<br />
costs <strong>and</strong> targeted <strong>and</strong> specifi c actions were carried out in less loaded<br />
sites (production transfers, in particular).<br />
To ensure <strong>and</strong> optimise the competitiveness of its industrial capacity,<br />
<strong>Groupe</strong> SEB constantly upgrades its plants, taking account of the economic<br />
reality of markets: adjustment of volumes, refocusing of production <strong>and</strong>/<br />
or reduction of operating costs if necessary, greater use of sourcing<br />
according to needs, in addition to manufacturing capacity upgrades to meet<br />
increasingly strong dem<strong>and</strong> as is currently the case in China. For example,<br />
the extension of buildings on the Wuhan (Supor) site dedicated to cookware<br />
will allow the Group to double production capacity in 2011; the upgrade<br />
process of the new Shaoxing plant, specialised in small electrical appliances,<br />
was signifi cantly accelerated to meet booming dem<strong>and</strong> in the Chinese<br />
market. At the same time, the Group decided to reintegrate in a number of<br />
Chinese plants part of the production that had been outsourced to Chinese<br />
subcontractors (kettles, in particular). Productivity plans are first deployed<br />
throughout plants in China in order to gradually reach Group st<strong>and</strong>ards.<br />
Ultimately, the combination of sustained industrial operations <strong>and</strong> the<br />
productivity actions implemented led to genuine improvement in the Group’s<br />
industrial performance in <strong>2010</strong>.<br />
The Group has also introduced a global Supply Chain Management system<br />
intended to rationalize stocks of fi nished products, optimize the quality<br />
of these stocks <strong>and</strong> implement a process to improve customer service.<br />
The actions undertaken resulted in significant improvements of all ratios in<br />
the last three years with, in particular, a clear improvement in the inventories<br />
of low turnover products, major reduction in supply chain costs (transports<br />
<strong>and</strong> warehouses) <strong>and</strong> major progress in sales forecasts.<br />
1<br />
Sourced 30%<br />
China 20%<br />
South America 8%<br />
USA 2%<br />
(1) 26 in March 2011 (2 Imusa sites).<br />
GROUPE SEB<br />
FINANCIAL REPORT AND REGISTRATION DOCUMENT <strong>2010</strong><br />
9
1 INDUSTRIAL<br />
GROUPE SEB IN <strong>2010</strong><br />
STRATEGY<br />
RESEARCH & DEVELOPMENT<br />
In a highly competitive market, the Group is investing in innovation.<br />
When applied to technologies <strong>and</strong> to process, innovation creates competitive<br />
advantages. When applied to products, it provides genuine added-value<br />
to consumers (unique concepts, new functional features, differentiated<br />
approach to design <strong>and</strong> marketing, etc.), <strong>and</strong> helps the Group to st<strong>and</strong> out<br />
effectively, strengthen its positions <strong>and</strong> conquer new markets. The Group<br />
also implements an active research <strong>and</strong> development policy (1) consistent<br />
with an approach based on the creation of product offers that involves teams<br />
from research & development, industry, procurement, logistics <strong>and</strong> strategic<br />
marketing, design <strong>and</strong> quality. To this end, in 2009, <strong>Groupe</strong> SEB consolidated<br />
its research, marketing <strong>and</strong> sourcing teams for food preparation, beverage<br />
preparation <strong>and</strong> electric cooking into one “Kitchen Electrics” centre. The aim<br />
was to consolidate all the resources required within one entity <strong>and</strong> to share<br />
best practices between the teams, in order to create a decisive competitive<br />
advantage in these sectors of trading activity. After a transition phase, the<br />
actual implementation of direct collaborations between teams helped to<br />
identify <strong>and</strong> start deploying synergies capable of generating promising future<br />
developments. This collective <strong>and</strong> collaborative approach is also expressed<br />
through the Innovation Days, which bring together <strong>Groupe</strong> SEB experts<br />
worldwide from R&D, strategic marketing, design, etc. These two days are<br />
intended to strengthen the Group’s “innovation community” (625 people)<br />
<strong>and</strong> promote cross-disciplinary sharing of knowledge <strong>and</strong> experience in<br />
development as well as progress made on major works <strong>and</strong> projects. For<br />
innovation to be a sustainable advantage, it must be part of a constant<br />
fl ow <strong>and</strong> must be protected. To this end, <strong>Groupe</strong> SEB pursues an active<br />
industrial property policy by filing numerous patents every year. In France,<br />
the Group has been one of the top 20 patent filers for several years now. To<br />
this end, <strong>2010</strong> was a fairly busy year with 110 registered patents, 273 Soleau<br />
envelopes established <strong>and</strong> is in line with the Group’s culture of protecting<br />
its inventions.<br />
R&D investment amounted to €73 million in <strong>2010</strong>, including Research Tax<br />
Credits (€5 million) <strong>and</strong> capitalized R&D costs (€8 million). The R&D teams<br />
have been significantly strengthened over the last years.<br />
PARTNERSHIPS<br />
The Group enters into partnerships to develop new concepts, elaborate<br />
new solutions <strong>and</strong> boost its sales. It works closely with companies engaged<br />
in complementary trading activities which help provide quality services to<br />
consumers. That is mainly the case with food industry majors such as<br />
Nestlé for Nespresso <strong>and</strong> Dolce Gusto. The Group also works with top<br />
chefs throughout the world to develop culinary products, or with prestigious<br />
br<strong>and</strong>s such as Elite for personal care. Representing around 9% of sales,<br />
these partnerships are major growth drivers for the Group.<br />
At the same time, the Group enjoys partnerships with universities or research<br />
institutes, working together on major projects which enable it to widen<br />
its fi eld of activities <strong>and</strong> benefi t from additional tools <strong>and</strong> skills. Notable<br />
examples include in particular, projects concerning health <strong>and</strong> nutrition with<br />
Nutrition-Santé-Longévité, Vitagora or Q@limed.<br />
PURCHASING<br />
Purchasing covers requirements for materials (metals, plastics, paper/<br />
cardboard packaging, etc.) <strong>and</strong> components (parts, sub-systems, etc.)<br />
for industry, non-production purchasing (transport <strong>and</strong> logistics, services,<br />
information systems, travel, etc.) <strong>and</strong> purchases of sourced finished<br />
products. Purchases are increasingly managed at Group level, to allow<br />
optimum negotiation conditions, not only in terms of pricing, but also in<br />
terms of quality, on-time delivery, etc. For several years now, production<br />
purchases have benefited from a centralised organisation tailored to each<br />
project <strong>and</strong> each contract. In <strong>2010</strong>, for production purchases, the Group had<br />
a panel of 330 suppliers representing 86% of global purchasing.<br />
Non-production purchases currently follow the same process aimed at<br />
better qualifying certified suppliers <strong>and</strong> building an across-the-board Group<br />
purchasing methodology with an panel of approved certified suppliers (600 at<br />
year end <strong>2010</strong>). To this end, the team was significantly reinforced, increasing<br />
from 15 to 24 people with the aim of covering a much wider spectrum of<br />
expenditures <strong>and</strong> a broader international scope.<br />
For purchases of sourced finished products, in <strong>2010</strong> the Group introduced<br />
a Group Finished Products Purchasing department, created a Finished<br />
Products Purchasing function in operations <strong>and</strong> strengthened its dedicated<br />
teams within its SEB Asia subsidiary in Hong Kong. This reorganization<br />
has already helped to strengthen purchasing quality processes for finished<br />
products by guaranteeing technical <strong>and</strong> methodological assistance for<br />
Group teams with suppliers. At the same time, it demonstrates our desire<br />
to integrate suppliers upstream in the product development process in order<br />
to foster greater fluidity in creating products. Through this approach, the<br />
Group seeks to obtain a more concentrated panel of approved fi nished<br />
product suppliers, which, at year end <strong>2010</strong>, comprised 52 companies from<br />
a list of 100.The Group’s panels of suppliers consist of carefully selected<br />
<strong>and</strong> tested companies in terms of both performance (lead times, quality,<br />
cost, etc.) <strong>and</strong> societal <strong>and</strong> environmental responsibilities (environmental<br />
impact, compliance with Human Rights, etc.).<br />
(1) Detailed information concerning research <strong>and</strong> development is provided in Note 14 in the Notes to the <strong>Financial</strong> Statements.<br />
10 FINANCIAL REPORT AND REGISTRATION DOCUMENT <strong>2010</strong> GROUPE SEB
1<br />
GROUPE SEB IN <strong>2010</strong><br />
MANAGEMENT REPORT ON <strong>2010</strong><br />
MANAGEMENT REPORT ON <strong>2010</strong><br />
Information on risk management, social performance <strong>and</strong> the environment is presented in the following sections.<br />
1<br />
<strong>2010</strong> HIGHLIGHTS<br />
GENERAL ENVIRONMENT<br />
After 2009, with its host of negative factors, <strong>Groupe</strong> SEB enjoyed a<br />
much more favourable environment for its business in <strong>2010</strong>, with a good<br />
consumption level maintained throughout Western European countries <strong>and</strong><br />
recovering dem<strong>and</strong> in the number of emerging markets severely affected<br />
by the 2009 crisis. Nevertheless, the situation is highly uncertain in some<br />
countries – especially in Europe – where economies have become very<br />
fragile <strong>and</strong> are currently going through austerity measures that are potentially<br />
bad for consumption. In this buoyant context, despite a few glitches, the<br />
Small Household Equipment sector confirmed its strength, driven by good<br />
consumer dem<strong>and</strong> in the majority of mature markets <strong>and</strong> by the significant<br />
recovery of most developing markets. However, the crisis has left traces in<br />
the buying behaviour of consumers in these countries which was manifested<br />
through a greater tendency towards low-cost products <strong>and</strong> special offers.<br />
Meanwhile, the monetary environment has remained volatile, but compared<br />
to the atypical 2009, where virtually all currencies collapsed against the euro,<br />
ultimately, the general trend for the financial year was the appreciation of<br />
those very currencies against the euro. However, there was a great deal of<br />
tension on commodities <strong>and</strong> on the price of oil, which increased significantly.<br />
With respect to retail distribution, the financial difficulties encountered in<br />
2009 by many retail banners due to the downturn in consumption <strong>and</strong> the<br />
credit crunch abated over the year. This gradual normalisation of the situation<br />
has helped to restore credit insurance levels more in tune with the “pre-crisis”<br />
levels, depending on the country. The <strong>2010</strong> financial year unfolded without<br />
any accidents <strong>and</strong> without customer defaults, but in a context of cautious<br />
re-stocking rather than real reconstitution of inventories.<br />
CURRENCIES<br />
After two financial years marked by a negative currency effect on<br />
sales (-€69 million in 2008 <strong>and</strong> -€63 million in 2009), <strong>2010</strong> marks a genuine<br />
break with an impact of exchange rates of +€171 million on turnover, primarily<br />
recorded in the second half. In fact, practically all the Group’s operating<br />
currencies contributed to this positive effect, but four of them were decisive:<br />
the real, yuan, dollar <strong>and</strong> rouble. These four alone account for nearly 65% of<br />
the total impact. The remaining 35% comprise 20 or more currencies which<br />
had a more modest impact.<br />
All our major operating currencies, based on average exchange rates,<br />
appreciated against the euro in <strong>2010</strong>:<br />
dollar: +5.1% over the year due to a weakening early in the year, followed<br />
by a second half where it firmed up;<br />
yuan: +6.1% over the year, down in the first quarter <strong>and</strong> up later, as for<br />
the dollar;<br />
real: +18.8% over the year, with a slowdown in appreciation in the<br />
fourth quarter;<br />
rouble: +9.6% over the year, with a more modest fourth quarter;<br />
the yen, won, Turkish lira, zloty, Mexican peso all appreciated significantly<br />
against the euro, between 8 <strong>and</strong> 16%.<br />
The persistent volatility is likely to disrupt the Group’s very international<br />
trading activity whose priority remains the preservation of local profitability.<br />
RAW MATERIALS<br />
The Group’s business is exposed to fluctuations in the price of certain raw<br />
materials, including metals such as aluminium, nickel (used in stainless steel)<br />
<strong>and</strong> copper. The latter peaked in 2007 <strong>and</strong> early 2008, before turning around<br />
sharply with a trough in late 2008, early 2009. Since then, we have seen a<br />
gradual, then more significant but steady increase in the price of metals.<br />
Rallying markets, especially Chinese domestic dem<strong>and</strong>, caused strong<br />
tensions on commodities, aggravated by the systematic failure to reopen<br />
production capacities which had been temporarily shut down during the<br />
crisis. The combination of these two phenomena resulted in tense markets,<br />
frequent inventory shortages <strong>and</strong> increasing prices.<br />
For <strong>2010</strong> as a whole, aluminium prices shot up by 30% with an average<br />
price of USD 2,173 per tonne. In practice, the Group mostly buys aluminium<br />
for which all the price components – metal LME price, access bonus <strong>and</strong><br />
value added – increased considerably in <strong>2010</strong>. Nickel prices jumped by<br />
43% reaching an average price of USD 21,000 per tonne in <strong>2010</strong>, versus<br />
USD 14,700 per tonne in 2009. Copper continued to be characterized by<br />
major volatility but, despite temporary contraction in Spring <strong>2010</strong>, remained<br />
generally in a signifi cant infl ationary spiral with, fi nally, an average <strong>2010</strong><br />
price of USD 7,500 a tonne, up by 47% compared to 2009. This very sharp,<br />
upward trend on metals (which continued in <strong>2010</strong> with copper, reaching<br />
record highs early in the year) in the end had limited impact on business <strong>and</strong><br />
on our performance in <strong>2010</strong>, a fact particularly due to the Group’s hedging<br />
policy for part of its metal requirements.<br />
GROUPE SEB<br />
FINANCIAL REPORT AND REGISTRATION DOCUMENT <strong>2010</strong><br />
11
1 MANAGEMENT<br />
GROUPE SEB IN <strong>2010</strong><br />
REPORT ON <strong>2010</strong><br />
Recovering dem<strong>and</strong> worldwide also impacted prices of plastics, especially<br />
since the second half of <strong>2010</strong> with an increase of between 5% <strong>and</strong> 15%,<br />
depending on the categories. As the Group sourced most of its plastic parts<br />
already formed, the impact of the increase was diluted in <strong>2010</strong>.<br />
The Brent price increase in <strong>2010</strong> only had a limited impact on our shipping<br />
<strong>and</strong> road transports where the increase can be mostly explained by a return<br />
to pre-crisis conditions linked to the economic recovery.<br />
ACQUISITION IN SOUTH AMERICA<br />
On 15 July <strong>2010</strong>, <strong>Groupe</strong> SEB issued a press release to announce its ongoing<br />
talks with the major shareholders of the Colombian company Imusa, with<br />
the aim of acquiring a majority stake. After obtaining the green light from<br />
the Colombian competition authorities in early December, it confirmed on<br />
21 December <strong>2010</strong> that it had signed an acquisition contract with the said<br />
shareholders on 17 December.<br />
Created in 1934, Imusa is specialised in Small Household Equipment.<br />
It manufactures cookware (representing 2/3 of its sales) <strong>and</strong> food <strong>and</strong><br />
household plastic products. A major player in the Colombian market,<br />
Imusa has developed a strong presence in all national retail distribution<br />
networks <strong>and</strong> has opened several of its own retail outlets. At the same time,<br />
it has internationalised its trading activity, with exports today to the United<br />
States – where it mostly targets the Hispanic population – <strong>and</strong> to other<br />
Latin American countries (Ecuador, Peru, Venezuela, Panama, Puerto Rico,<br />
<strong>and</strong> Salvador, etc.). Its area of influence covers a total population of nearly<br />
120 million consumers.<br />
Imusa operates 2 industrial sites <strong>and</strong> the company employs approximately<br />
900 people.<br />
Imusa’s turnover for <strong>2010</strong> was approximately €90 million, up by nearly 40%<br />
compared with 2009. 60% of sales were generated in the domestic market<br />
<strong>and</strong> 40% from exports.<br />
<strong>Groupe</strong> SEB managed to finalize the company’s acquisition on 28 February<br />
2011. As Imusa is listed on the Bogota Stock Exchange – although with a<br />
weak float (around 6% of capital) <strong>and</strong> barely mobile –, a squeeze-out offer<br />
was successfully launched <strong>and</strong>, on 31 March 2011, <strong>Groupe</strong> SEB had an<br />
interest of 99% in the company’s equity.<br />
ALLOCATION OF FREE SUPOR SHARES<br />
On 27 May <strong>2010</strong>, at the same time as the payment of a dividend of 0.20 yuan<br />
per share, Supor allocated free shares on the basis of 3 for 10. The operation<br />
resulted in an increase in the number of shares comprising the capital of<br />
the Chinese company from 444 million to 577 million shares. The closing<br />
price for the Supor share was 23.69 yuans on 26 May <strong>and</strong> 18.06 yuans on<br />
27 May <strong>2010</strong>.<br />
OPERATIONS OF THE GROUPE SEB FOUNDATION<br />
Created in 2007, the <strong>Groupe</strong> SEB Foundation’s vocation is to combat<br />
exclusion. It supports projects to help people in diffi culty reintegrate into<br />
society, with three focuses: employment, housing <strong>and</strong> education/training.<br />
With an initial budget of €3 million in 5 years, it is involved in large-scale<br />
projects in France as a priority, but also abroad. Furthermore, it organises<br />
volunteer <strong>and</strong> corporate skill sponsorship initiatives with the participation<br />
of the Group’s employees.<br />
The long-term partnerships that it has initiated since the very beginning have<br />
been renewed, still with a priority focus on reintegration: through access to<br />
employment with “Fédération Envie” or “Fondation de la 2 e chance”, through<br />
housing with “Habitat <strong>and</strong> Humanisme”. Significant new partnerships were<br />
subsequently entered into: “Fondation d’Auteuil”, devoted to helping children<br />
in distress with host <strong>and</strong> training structures, UNESCO for the education of<br />
street children in Burundi, the “Don en Nature” agency, a ground-breaking<br />
structure in the field of corporate product sponsorship.<br />
In <strong>2010</strong>, the <strong>Groupe</strong> SEB Foundation supported 48 highly different projects<br />
(39 in 2009) in the context of an available support budget which amounted<br />
to €452,000 euros in cash <strong>and</strong> €500,000 euros in product donations.<br />
At the same time, through its Foundation, the Group also carried out<br />
humanitarian actions to support people affected by natural disasters through:<br />
assistance for the people of Haiti through SOS Villages d’Enfants <strong>and</strong><br />
H<strong>and</strong>icap International (already partners of the Foundation), complemented<br />
by a donation from the American subsidiary (products <strong>and</strong> cash to the Red<br />
Cross); the total amount involved amounted to €330,000;<br />
250 product kits for the victims of the Xinthia storm in the La Rochelle<br />
region in France.<br />
Within the same perspective of insertion <strong>and</strong> providing help to the most<br />
underprivileged, 15 new large-scale projects were presented to the<br />
Foundation’s Operational Committee. They are targeted at vulnerable<br />
populations such as ex-convicts, overextended or disabled people.<br />
A key stage in the Foundation’s development, the First Volunteers’ Day, took<br />
place on 14 September <strong>2010</strong>. 80 participants from all over France were able<br />
to discuss their commitment to the Foundation’s projects, thereby laying the<br />
foundations of a genuine internal culture of employees who are focused on<br />
the Group’s values.<br />
REWARDED PERFORMANCES<br />
In <strong>2010</strong>, <strong>Groupe</strong> SEB received numerous distinctions throughout the year,<br />
in very different fields:<br />
the Group’s innovation capacity was rewarded firstly with the “Best<br />
Innovator” special jury prize awarded by AT Kearney in partnership<br />
with the economic daily newspaper, Les Échos, <strong>and</strong> secondly, with the<br />
“Hermès de l’Innovation” prize awarded at the 3 rd national meeting of<br />
Innovation Directors for its capacity to combine technological advances<br />
with improvements in the quality of life for consumers (May <strong>2010</strong>);<br />
under the high patronage of the French Secretary of State to SMEs <strong>and</strong><br />
the Minister for Higher Education <strong>and</strong> Research, the Group received the<br />
Best Enterprise Award for the relevance of its international expansion<br />
policy on a large product portfolio (June <strong>2010</strong>);<br />
<strong>Groupe</strong> SEB was elected “International supplier of <strong>2010</strong>” in its<br />
category at the annual get-together of suppliers organised by Euronics<br />
International (consortium of independent retailers located in 29 European<br />
countries) in Hamburg (June <strong>2010</strong>);<br />
the Group’s communication received several awards in <strong>2010</strong>: the Group<br />
received the Information <strong>and</strong> Communication Quality <strong>and</strong> Transparency<br />
Award at the 7th edition of the AGEFI corporate governance Gr<strong>and</strong><br />
Prix (September <strong>2010</strong>) <strong>and</strong> obtained the silver trophy – having<br />
received gold in 2009 – at the Investor Relations Forum in December.<br />
These distinctions reward the quality <strong>and</strong> transparency of the Group’s<br />
financial communication, as well as management availability <strong>and</strong><br />
responsiveness. Still in the field of communication, in October <strong>Groupe</strong><br />
SEB was awarded the Dauphin d’Argent Prize for the best corporate film<br />
at the first Cannes Corporate Media <strong>and</strong> TV Awards, for its corporate film<br />
released in May;<br />
12 FINANCIAL REPORT AND REGISTRATION DOCUMENT <strong>2010</strong> GROUPE SEB
1<br />
GROUPE SEB IN <strong>2010</strong><br />
MANAGEMENT REPORT ON <strong>2010</strong><br />
the Group received another award when the Information Systems<br />
department was awarded the Club 01DSI special prize for implementing<br />
a methodology for integrating acquired companies. In addition,<br />
the DFCG (French national association for CFOs <strong>and</strong> Management<br />
Controllers), in partnership with Les Échos, also praised the Group’s<br />
<strong>Financial</strong> department, with a special mention for risk management,<br />
productivity <strong>and</strong> performance control;<br />
COMMENTS ON <strong>2010</strong> SALES<br />
lastly, <strong>Groupe</strong> SEB obtained silver in the <strong>2010</strong> Gr<strong>and</strong> Prix des Actions<br />
compiled by the “Mieux vivre votre Argent” magazine (after bronze in 2009)<br />
for its stock market performance (where it obtained the best score) as well<br />
as its corporate, societal, environmental <strong>and</strong> shareholding responsibility.<br />
The stock market record of the SEB share was also praised by the BFM<br />
Award for Best Stock Market Performance in the context of the 6th edition<br />
of the BFM Awards, organised by BFM economic radio.<br />
1<br />
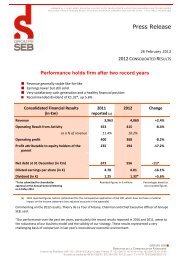
Changes as %<br />
(in € millions)<br />
Sales 2009 Sales <strong>2010</strong> Current exchange rates Constant exchange rates<br />
France 685 712 3.9 3.9<br />
Other Western European countries 728 787 8.1 7.5<br />
North America 349 404 15.9 7.5<br />
South America 262 346 32.2 12.4<br />
Asia / Pacific 600 764 27.4 18.9<br />
Central Europe, Russia <strong>and</strong> other countries 552 639 15.7 9.4<br />
TOTAL 3,176 3,652 15.0 9.6<br />
% based on exact figures, not rounded off.<br />
In a context of solid dem<strong>and</strong> for Small Household Equipment, growth in<br />
most mature markets <strong>and</strong> rapid recovery in nearly all emerging markets,<br />
in <strong>2010</strong> <strong>Groupe</strong> SEB achieved robust <strong>and</strong> very linear sales from quarter to<br />
quarter. Although it benefited from the undem<strong>and</strong>ing time in 2009 until the<br />
end of September, the same did not apply in the fourth quarter, for which it<br />
nevertheless recorded very sturdy growth in turnover.<br />
QUARTERLY CURVE OF <strong>2010</strong> ORGANIC GROWTH<br />
+ 10.9%<br />
Q1<br />
+ 8.1%<br />
Q2<br />
Year + 9.6%<br />
+ 11.8%<br />
Q3<br />
+ 8.2%<br />
Q4<br />
As a %<br />
The monetary environment remained highly volatile, but the appreciation<br />
of nearly all currencies against the euro (real, rouble, yuan, dollar, etc.),<br />
especially in the second half, had a very positive impact on sales, reaching<br />
€171 million.<br />
12<br />
10<br />
8<br />
6<br />
4<br />
In light of this more favourable monetary context, the Group selectively<br />
readjusted its prices downwards in certain countries where prices had<br />
been raised in 2009 to offset currency depreciation. The purpose of these<br />
tariff adjustments was to preserve market dynamism <strong>and</strong> the Group’s<br />
competitiveness.<br />
Accordingly, <strong>Groupe</strong> SEB’s turnover climbed 15% at current exchange rates<br />
<strong>and</strong> 9.6% at constant exchange rates. This robust growth was driven by an<br />
extended <strong>and</strong> widely-renewed product offer as well as enhanced marketing<br />
<strong>and</strong> advertising support.<br />
SALES PERFORMANCE OF PRODUCTS<br />
In <strong>2010</strong>, the Group launched some 250 new products <strong>and</strong> models which<br />
have frequently served as engines for the entire range. The market remained<br />
buoyant <strong>and</strong>, except for Personal Care, was stable in comparison with 2009;<br />
all trading activities significantly contributed to increasing turnover.<br />
Strong contributors to Group organic growth included:<br />
Home comfort, although still a small category in terms of sales, posted a<br />
very robust trading performance driven by particularly favourable climatic<br />
conditions for fan sales in South America (Brazil <strong>and</strong> Colombia, mostly)<br />
<strong>and</strong> by the commercial successes of the latest models introduced in the<br />
markets, especially the Turbo Silencio;<br />
GROUPE SEB<br />
FINANCIAL REPORT AND REGISTRATION DOCUMENT <strong>2010</strong><br />
13
1 MANAGEMENT<br />
GROUPE SEB IN <strong>2010</strong><br />
REPORT ON <strong>2010</strong><br />
Home care confirmed its vibrancy in <strong>2010</strong> with renewed robust growth<br />
thanks to the redesign of the range 3 years ago which helped to strengthen<br />
its positions in European markets (Spain, France <strong>and</strong> Italy for example)<br />
<strong>and</strong> the continued international expansion of the Air Force upright vacuum<br />
cleaner <strong>and</strong> bagless models;<br />
Electric cooking reported vibrant growth compared to 2009 with<br />
nevertheless very uneven trading activity in the various product<br />
families. The growth of Actifry sales continued, driven by the successful<br />
international expansion, with special mention for Canada, Netherl<strong>and</strong>s,<br />
Turkey <strong>and</strong> Central Europe. Barbecues <strong>and</strong> planchas, s<strong>and</strong>wich <strong>and</strong><br />
waffle-makers as well as rice cookers all had a positive impact on sales,<br />
while sales declined for ovens, toasters <strong>and</strong> bread makers;<br />
Food preparation which, after a lacklustre 2009 affected by the decline<br />
of the Russian market in particular, reported excellent performance on<br />
virtually all products. While Fresh Express continues to leave its mark,<br />
mincers, meat mincers, blenders, mixers, large food processers benefited<br />
from the recovery of markets in all countries. The successful relaunch<br />
of yoghurt makers should also be noted, in a currently buoyant niche of<br />
healthy homemade desserts;<br />
Beverage preparation rallied sharply in <strong>2010</strong>, with growth mainly driven<br />
by single-portion coffee thanks to the confirmed success stories of<br />
Nespresso <strong>and</strong> Dolce Gusto, which renews its brilliant performances<br />
in European markets through the launch of new models (Piccolo <strong>and</strong><br />
Fontana) <strong>and</strong> continues its international expansion (Brazil, Argentina,<br />
Russia, etc.). Kettle sales were also boosted by the rally of the Russian<br />
market <strong>and</strong> a still robust trading activity in Japan, but were affected by<br />
fiercer <strong>and</strong> more aggressive competition in other markets;<br />
Linen care was driven by steam generators, which in <strong>2010</strong> served as<br />
growth vectors for trading activity in Western Europe while the growth of<br />
iron sales, although still positive, was strongly mixed depending on the<br />
country. It was on the right track in Russia, Mexico <strong>and</strong> Brazil but it shrank<br />
in some European countries (to the advantage of steam generators) <strong>and</strong><br />
in Turkey;<br />
Cookware reported solid growth for mid-range products <strong>and</strong> recovered<br />
signifi cantly for premium range products such as All-Clad in the US,<br />
boosted again after a difficult 2009 by the success of the new D5 range.<br />
However, activity was not uniform overall <strong>and</strong> it remained low in Central<br />
Europe in particular. Furthermore, it is sensitive to whether or not loyalty<br />
programmes with certain distributors are renewed;<br />
The resilience of the Personal care trading activity in <strong>2010</strong> was due<br />
to a significant recovery in hairstyling appliances (hair dryers, hair<br />
straighteners, etc.) for which the progress <strong>and</strong> advances made in certain<br />
countries more than offset the downturns experienced in others, especially<br />
in Europe. Meanwhile, weighing, depilation <strong>and</strong> baby-care equipment<br />
declined.<br />
GEOGRAPHICAL PERFORMANCE<br />
Breakdown of <strong>2010</strong> trading activity by geographical<br />
zone<br />
In France, the Small Household Equipment market continued performing<br />
well <strong>and</strong> remained at the cutting edge of innovation. The sector remains<br />
driven by affordable prices (average price of €50 to €55 for small electrical<br />
appliances), basic trends such as “home-made” or refocusing on the<br />
home, the impact of televised cooking shows, renewal of the offering <strong>and</strong><br />
marketing <strong>and</strong> advertising support. Nearly all product families contributed to<br />
the market’s progress. In a very active competitive environment, especially<br />
in small electrical appliances, the sector benefited from a sustained product<br />
performance to which once again <strong>Groupe</strong> SEB contributed signifi cantly<br />
through the launch of multiple new products. After a robust start to the<br />
year, quarterly growth stabilized at around 3%, including growth in the<br />
fourth quarter, even though the 2009 basis for comparison was dem<strong>and</strong>ing.<br />
The most significant contributors to the increase are still cookware, steam<br />
generators, single-portion coffee (Nespresso <strong>and</strong> Dolce Gusto machines),<br />
Fresh Express small food preparation equipment, Silence Force <strong>and</strong> Air Force<br />
vacuum cleaners, barbecues <strong>and</strong> planchas together with Délice yoghurt<br />
makers. Advertising investments deployed before Christmas certainly helped<br />
to boost trading activity over the last weeks of <strong>2010</strong>.<br />
In the other Western European countries, the fi rm dem<strong>and</strong> <strong>and</strong> good<br />
performance of the Small Household Equipment market generated solid<br />
growth in sales, heightened in the second half. Business grew in all countries<br />
except for Greece, but remained mixed depending on the market. In a<br />
degraded economic climate, which further deteriorated at the end of the<br />
year, the Group reported excellent performance in Spain, where it reinforced<br />
its leadership in electrical products <strong>and</strong> in cookware. However, it stagnated<br />
in the fourth quarter, which was much tighter. In Portugal, in a sluggish<br />
market, sales fi rmed up quarter on quarter with the gain of new market<br />
shares in particular. In Germany <strong>and</strong> Austria, it confirmed the good results<br />
of the previous months in a rather buoyant consumption context which was<br />
also increasingly price-oriented. Sales growth was driven by the success<br />
of single-portion coffee (Nespresso <strong>and</strong> Dolce Gusto), steam generators<br />
<strong>and</strong> cookware. In Italy, the market benefited from strong vitality, with<br />
strengthening of all product categories except breadmakers. Thanks to the<br />
introduction of new products <strong>and</strong> robust advertising support, the Group<br />
strengthened its positions in this market. In the UK, after losing ground<br />
for several years, the small electrical appliance market has taken off with<br />
value growth <strong>and</strong> the Group leveraged this turnaround with several flagship<br />
products (Actifry, Dolce Gusto, Nespresso, cookware, etc.). The Netherl<strong>and</strong>s<br />
<strong>and</strong> Sc<strong>and</strong>inavia reported brisk business, a big change from the downturn<br />
in difficult 2009.<br />
In North America, just like 2009, <strong>2010</strong> was mixed depending on the<br />
quarters, countries <strong>and</strong> br<strong>and</strong>s. Around the end of the year, sluggish <strong>and</strong><br />
highly promotional markets reflected the limited confidence of households<br />
<strong>and</strong> lacklustre consumption. After a strong third quarter, the Group’s sales<br />
stagnated in the last 3 months. In the United States, the Group displayed<br />
sustained growth in cookware, thanks in particular to the confirmed success<br />
of T-fal, the successful relaunch of Emeril – which has been bolstered by a<br />
restructured offering – <strong>and</strong> the recovery initiated by All-Clad in the premium<br />
segment thanks in particular to the resounding success of its new D5 range.<br />
Although the situation is significantly better compared to the very difficult<br />
2009, it remains contrasted depending on the distributor. In electrical<br />
appliances, after a slow start up, business relating to Rowenta picked up<br />
in the second half with product listings reinitiated with certain clients <strong>and</strong><br />
loyalty operations entered into with others. The result is stable turnover<br />
for the year. Krups, on the other h<strong>and</strong>, has stayed in a negative spiral with<br />
significantly shrinking sales <strong>and</strong> little or no favourable outlook in the short<br />
term. In Canada, the second half was able to make up for the bad start to the<br />
year, thanks to the excellent performance of Actifry <strong>and</strong> Dolce Gusto. Sales of<br />
cookware have fallen significantly, penalized by the lack of promotions. In<br />
Mexico, the strong progression, driven by cookware <strong>and</strong>, to a lesser extent,<br />
by irons, is compounded by a loyalty operation with a distributor.<br />
In South America, <strong>2010</strong> was marked by the return to a more buoyant<br />
economic context, which resulted in a consumption pattern more in line<br />
14 FINANCIAL REPORT AND REGISTRATION DOCUMENT <strong>2010</strong> GROUPE SEB
1<br />
GROUPE SEB IN <strong>2010</strong><br />
MANAGEMENT REPORT ON <strong>2010</strong><br />
with the pre-crisis level. The Group’s situation eased in all the countries of<br />
the zone except in Venezuela, which is in full recession. In Brazil, beyond<br />
the favourable economic climate, the enormous growth of the middle class,<br />
known as “C”, reinforced by access to the consumption of about 40 million<br />
people primarily located in the Nordeste, generated a very positive dynamic<br />
on dem<strong>and</strong>. Taking advantage of aggressive product plans <strong>and</strong> a reorganized<br />
sales force, <strong>Groupe</strong> SEB reported a very good year in Brazil: solid business<br />
recovery <strong>and</strong> the recapture of cookware market shares; reinforcement of<br />
leadership in small electrical appliances thanks in particular to the success<br />
of fans, the renewal of the entire range of blenders, the upgrading of<br />
Dolce-Gusto or the Respect hair straightener, marketed among others<br />
through the booming “beauty shops” outlets; the massive expansion of<br />
the Group’s own retail outlets, which, at the end of <strong>2010</strong>, amounted to<br />
22 in the country, versus 4 at the end of 2009. In Colombia, the Group’s<br />
second largest market in South America, business was very positive for the<br />
majority of the product families <strong>and</strong> was further boosted by the opening of<br />
10 new shops in <strong>2010</strong>. In the other countries, <strong>and</strong> especially in Argentina <strong>and</strong><br />
Chile, the Group reported excellent performance on the basis of an extended<br />
product offer <strong>and</strong> the development of its own retail outlets (3 openings in<br />
Argentina <strong>and</strong> 6 in Chile).<br />
In Asia <strong>and</strong> Pacific, the strong business growth throughout the year was<br />
sharply driven by the vibrant Chinese market, which represents the Group’s<br />
second largest market in size. Supor actively contributed to this dynamic<br />
performance with a 30% increase in domestic sales in <strong>2010</strong> despite a<br />
more modest increase in the fourth quarter due to the difficulties in 2009.<br />
In the field of cookware, which made up a third of its sales in China, Supor<br />
strengthened its leadership, despite fierce competition, thanks to the<br />
success of its latest models of woks, frying pans, saucepans <strong>and</strong> steam<br />
cookers, Thermospot <strong>and</strong> the Ingenio concept (removable h<strong>and</strong>les), but also<br />
thanks to significant progress in several key accounts. In small electrical<br />
appliances (two thirds of its sales), Supor reported strong growth in all its<br />
product families <strong>and</strong> created development drivers through its entry into new<br />
segments (kettles, blenders, etc.). At the same time, Supor continued to<br />
develop its “Supor Lifestores” on the Chinese territory <strong>and</strong>, at the end of the<br />
year, had 804 of its own retail outlets (+272 outlets compared to end 2009).<br />
In Japan, in a dismal economic context, shrinking purchasing power led<br />
to a contraction in consumption; the Small Household Equipment market<br />
stayed on an uptrend, but with a more significant price orientation. Sales<br />
in <strong>2010</strong> remained steady but the slowdown in growth observed in the third<br />
quarter was confirmed <strong>and</strong> emphasized in the last months. In Korea, we rely<br />
on a sturdy business in cookware <strong>and</strong> the opening of new electrical product<br />
categories (food preparation, personal care, etc.) to continue moving forward.<br />
Lastly, in Australia, consumption remained slack <strong>and</strong> the Group suffered.<br />
The end of the year was slightly more positive <strong>and</strong> allowed a partial offsetting<br />
of the delay accumulated in the first half.<br />
In Central Europe, Russia <strong>and</strong> other countries (Turkey, <strong>and</strong> Middle-East<br />
countries, Africa, etc.), the return to growth in <strong>2010</strong> – confirmed from quarter<br />
to quarter – occurred in a context of more competitive <strong>and</strong> promotional<br />
markets than before. The zone is heterogeneous <strong>and</strong> situations remain<br />
mixed depending on the country. In Russia, dem<strong>and</strong> recovered <strong>and</strong> the<br />
Group was able to redeploy its sales, although it has not returned to its<br />
“pre-crisis” levels. Retailers, more focused than previously, maintained a<br />
cautious stocks policy <strong>and</strong> gave preference to quick turnover products.<br />
The Group renewed its successes in ironing, kettles, meat mincers <strong>and</strong><br />
personal care, supported by advertising <strong>and</strong> marketing investments which<br />
turned out to be very lucrative. In Ukraine, in a more favourable environment,<br />
the Group confirmed its leadership <strong>and</strong> left the No. 2 lagging far behind as<br />
it dominated the market with its small electrical appliances such as kettles,<br />
breadmakers, hair straighteners <strong>and</strong> the launch of Dolce Gusto. In Turkey,<br />
the Group accumulated some delay in the fi rst half compared to the fast<br />
take-off of the market, but it began to correct the situation in the second<br />
half of the year, regaining positions in small electrical appliances thanks to<br />
an enhanced mix, <strong>and</strong> in spite of strong <strong>and</strong> active local competition. Lastly,<br />
in Central Europe, the recovery is taking much longer <strong>and</strong> consumption<br />
is still weak. Against this background, our sales nevertheless improved at<br />
the end of the year, especially in Pol<strong>and</strong>, offsetting the bad first half, with<br />
more vibrant trading activity in electric products (drawn by Actifry, vacuum<br />
cleaners, Dolce Gusto, steam generators, hair straighteners, etc.) but a clear<br />
contraction in cookware.<br />
1<br />
COMMENTS ON <strong>2010</strong> RESULTS<br />
INCOME STATEMENT<br />
At €438,000, <strong>Groupe</strong> SEB’s <strong>2010</strong> operating margin increased by 23.2%<br />
compared to 2009, accounting for 12% of sales (11.2% in 2009 <strong>and</strong> 10.6%<br />
in 2008). This positive change is linked to a set of factors, whose positive<br />
effects were ultimately mixed:<br />
the improvement in the economic situation as well as the proper<br />
performance or recovery of markets led to a sharp rise in sales volumes<br />
with a very positive impact on the trading activity of the Group’s plants<br />
<strong>and</strong> on the absorption of production costs. The phenomenon is all the<br />
more significant given that the production capacities of the sites had been<br />
under-utilized in 2009 <strong>and</strong> this led to sub-absorption of manufacturing<br />
costs. Taken together, the increase in sales <strong>and</strong> its impact on the utilisation<br />
of industrial capacities led to a volume effect on the operating margin of<br />
over €150 million;<br />
the slightly-shrinking price-mix effect due to price reductions <strong>and</strong> targeted<br />
promotional operations in certain countries where there had been<br />
substantial increases in 2009. These price reductions were intended to<br />
preserve the dynamism of the Group’s market. The product mix is still<br />
good thanks to the quality of the Group’s sales, despite a strong history<br />
<strong>and</strong> tighter markets;<br />
foreign currencies made a positive contribution of up to €32 million<br />
to the operating margin, while their impact was hugely negative in<br />
2009 (-€87 million). This effect is due to the nearly widespread appreciation<br />
of the Group’s operating currencies (real, rouble, yuan, yen, pound sterling,<br />
Turkish lira, won, zloty, etc.) against the euro, for which the positive impact<br />
on the translation of the operating margin into euros significantly exceeded<br />
the negative impact of the dollar’s reinforcement on procurement <strong>and</strong><br />
purchasing conditions;<br />
the unfavourable differences on purchases, linked in particular to the<br />
inflation of raw material costs, were generally limited since the additional<br />
cost amounted to €19 million, a significant portion of which was linked to<br />
the effect of aluminium price hikes on purchases of Supor, which has no<br />
hedging instruments. In <strong>2010</strong>, the Group thus succeeded in containing<br />
increases on commodities as well as on components or finished products,<br />
but is anticipating a greater impact in 2011;<br />
GROUPE SEB<br />
FINANCIAL REPORT AND REGISTRATION DOCUMENT <strong>2010</strong><br />
15
1 MANAGEMENT<br />
GROUPE SEB IN <strong>2010</strong><br />
REPORT ON <strong>2010</strong><br />
a very significant increase in intervention costs, which, conversely to 2009,<br />
mostly stems from the massive intensification of advertising investments<br />
in buoyant <strong>and</strong> receptive markets. Accordingly, the Group devoted<br />
€143 million to its advertising campaigns in <strong>2010</strong>, versus €95 million in<br />
2009. The acceleration occurred mostly in the last quarter (€74 million<br />
invested against €50 million in the last 3 months of 2009). At the same<br />
time, the Group also bolstered its commercial resources <strong>and</strong> its product<br />
design costs, with the aim of boosting innovation <strong>and</strong> the product offer.<br />
Although overheads exp<strong>and</strong>ed due to the strengthening of certain<br />
structures, especially at Supor, the progress reported in ASS helped to<br />
significantly reduce related costs <strong>and</strong> the ongoing optimization of inventory<br />
management generated a significant improvement in warehousing costs;<br />
furthermore, it should be noted that the Group remained highly focused on<br />
research <strong>and</strong> development with a total investment of €73 million (including<br />
industry property costs), versus €64 million in 2009, of which €60 million<br />
was actually reported in the income statement (research tax credit of<br />
€5 million <strong>and</strong> capitalized research costs of €8 million).<br />
Operating profit climbed from €248 million in 2009 (7.8% of sales) to<br />
€349 million in <strong>2010</strong> (9.6% of sales). This 41% increase, greater than the<br />
operating margin, is linked to “Other income <strong>and</strong> charges”, which is much<br />
better than in 2009. It reached -€38.5 million (versus -€74 million in 2009),<br />
<strong>and</strong> mainly includes:<br />
approximately €5 million linked to adjustment of provisions for restructuring<br />
charges in France – due to the pension reform legislation – <strong>and</strong> ongoing<br />
litigations;<br />
provisions for charges linked to the reorganisation of the sales force in<br />
Brazil;<br />
various other low-value provisions which are broadly distributed worldwide;<br />
asset impairments amounting to some €15 million euros prudentially<br />
allocated to the goodwill of All-Clad, whose trading activity, despite<br />
the adjustment carried out in <strong>2010</strong>, has not yet returned to the levels<br />
anticipated during the acquisition. This impairment does not shed doubt<br />
on the value of the All-Clad br<strong>and</strong>, which has retained its power <strong>and</strong><br />
medium-term potential.<br />
At the same time, at €50 million, bonuses <strong>and</strong> profi t sharing have risen<br />
significantly compared to €33.5 million in 2009. This increase is primarily<br />
linked to improved profitability in France.<br />
Net financial expense amounted to -€16 million, considerably lower<br />
compared to the -€27 million of 2009. This sharp improvement can be<br />
explained by a major reduction in interest expense (-€12 million versus<br />
-€23 million in 2009) as a result of the €277 million reduction in annual<br />
average debt. The other financial expenses are stable overall despite higher<br />
foreign exchange losses.<br />
At €220 million, net profit Group share increased by nearly 51% on the<br />
€146 million achieved in 2009. This is calculated after taxes of €89.5 million,<br />
representing a rate of 26.9%, slightly higher than the 2009 rate. It also includes<br />
minority shareholder interests for Supor, which amounts to €23 million to be<br />
deducted (€17 million in 2009).<br />
BALANCE SHEET<br />
Consolidated equity amounted to €1,571 million at 31 December <strong>2010</strong> –<br />
compared to €1,220 million at the end of 2009 – including a contribution<br />
of Supor’s minority shareholder interests for €173 million. This €351 million<br />
increase in equity (+29%) can be mostly explained by:<br />
€112 million from translation adjustments (appreciation effects of the yuan,<br />
real <strong>and</strong> dollar, especially on the valuation of the share in the net position<br />
of subsidiaries in the country concerned);<br />
for €244 million in recorded profit, less dividends paid in <strong>2010</strong> for the 2009<br />
financial year (€56 million).<br />
This additional equity is understood to be net of SEB treasury stock, the<br />
amount of which decreased in <strong>2010</strong> after the exercise of stock options in<br />
an extremely favourable market context. At the end of <strong>2010</strong>, SEB S.A. had<br />
1,980,698 treasury shares, versus 3,149,443 the previous year.<br />
Furthermore, net debt as at 31 December <strong>2010</strong> amounted to €131 million<br />
versus €243 million at year end 2009. This reduction of €112 million of<br />
debt reflects a new generation of cash, after an exceptional 2009. Working<br />
capital requirements reached €875 million (24% of sales) at the end of <strong>2010</strong>,<br />
versus €695 million at 31 December 2009 (21.9% of sales). This change<br />
is primarily due to an increase in stocks, especially around the end of the<br />
year: anticipation of a good first quarter 2011 for the Group <strong>and</strong> the Chinese<br />
New Year for Supor, purchase of Supor’s aluminium to freeze prices <strong>and</strong><br />
compile stocks of Moulinex products prior to relaunching the br<strong>and</strong> in Europe<br />
early January 2011. Furthermore, cash outfl ows linked to restructuring<br />
operations amounted to €30 million (€25 million in 2009), while cash inflows<br />
linked to treasury stock sales totalled €33 million (€10 million in 2009) <strong>and</strong><br />
the Group made no new acquisitions.<br />
Based on a debt of €131 million, the debt ratio was 0.08 at 31 December<br />
<strong>2010</strong> <strong>and</strong> marked a new consolidation of the Group’s financial position, which<br />
was already healthy with gearing of 0.20 at the end of 2009. The net debt/<br />
EBITDA ratio also increased signifi cantly, moving from 0.65 at year end<br />
2009 to 0.29 at year end <strong>2010</strong>, thereby demonstrating the continuation of<br />
rapid deleveraging <strong>and</strong> the Group’s enhanced capacity to pay back its debt.<br />
<strong>2010</strong> investments totalled €140 million, versus €109 million in 2009, showing<br />
a net recovery after a cautious 2009 due to the deteriorated economic<br />
climate. As in previous years, this investment was principally in tangible<br />
assets (approx. 80%) with almost equivalent distribution between moulds <strong>and</strong><br />
tools for new products on one h<strong>and</strong> <strong>and</strong> production equipment (installation<br />
of new assembly lines, injection presses, etc.) <strong>and</strong>/or the renovation of<br />
buildings on the other h<strong>and</strong>. The remaining 20% covered mostly capitalized<br />
development costs <strong>and</strong> production-related computer software.<br />
16 FINANCIAL REPORT AND REGISTRATION DOCUMENT <strong>2010</strong> GROUPE SEB
1<br />
GROUPE SEB IN <strong>2010</strong><br />
MANAGEMENT REPORT ON <strong>2010</strong><br />
GEOGRAPHICAL BREAKDOWN OF <strong>2010</strong> SALES<br />
CASH FLOW AND INVESTMENT<br />
France 19% / 22%*<br />
€ million<br />
500<br />
458<br />
240<br />
Asia / Pacific 21% / 19%*<br />
400<br />
368<br />
398<br />
210<br />
Central Europe,<br />
Russia <strong>and</strong> other countries 18% / 17%*<br />
300<br />
200<br />
140<br />
180<br />
150<br />
120<br />
1<br />
South America 9% / 8%*<br />
100<br />
116<br />
109<br />
90<br />
North America 11% / 11%*<br />
Other EU Western European countries 22% / 23%*<br />
0<br />
2008<br />
2009<br />
<strong>2010</strong><br />
60<br />
* 2009 figures.<br />
Capital expenditure<br />
Cash flow<br />
TRADING RESULTS/SALES<br />
NET DEBT AND DEBT RATIO<br />
As a %<br />
12<br />
10<br />
8<br />
10.6<br />
8.6<br />
11.2<br />
7.8<br />
12<br />
9.6<br />
€ million<br />
700<br />
600<br />
500<br />
400<br />
649<br />
0.6<br />
1.0<br />
0.8<br />
0.6<br />
300<br />
243<br />
0.4<br />
6<br />
4.5<br />
4.6<br />
6.0<br />
200<br />
100<br />
0.2<br />
131<br />
0.2<br />
4<br />
2008<br />
2009<br />
<strong>2010</strong><br />
0<br />
2008<br />
2009<br />
0.1<br />
<strong>2010</strong><br />
0,0 0.0<br />
Operating margin/sales<br />
EBIT/sales<br />
Net income/loss (Group share)/sales<br />
Gearing<br />
Net debt at 31/12<br />
GROUPE SEB<br />
FINANCIAL REPORT AND REGISTRATION DOCUMENT <strong>2010</strong><br />
17
1 OUTLOOK<br />
GROUPE SEB IN <strong>2010</strong><br />
FOR 2011<br />
OUTLOOK FOR 2011<br />
Thanks to the Group’s swift responsiveness <strong>and</strong> the capacity to adapt rapidly<br />
to the new deal on markets, it did not merely weather the storm in 2009,<br />
but emerged stronger from it. In <strong>2010</strong>, in a global context of recovery or<br />
strong market performance, the Group has been able to achieve record high<br />
performance levels by harnessing all its assets.<br />
The momentum of <strong>2010</strong> <strong>and</strong> the results achieved gave us the confidence<br />
required to face 2011, on the basis of a fairly solid consumption level in<br />
Europe, a slight improvement in the economic situation in North America, a<br />
confirmed recovery of dem<strong>and</strong> in the Central Europe-Russia-Turkey-other<br />
countries zone, <strong>and</strong> the continued strong momentum in South America <strong>and</strong><br />
Asia Pacific. However, the Group anticipates persistently volatile currencies<br />
as well as continued hikes in raw material prices with an expected impact<br />
on the cost price of manufactured products <strong>and</strong> purchases of sourced<br />
products. Targeted price adjustments <strong>and</strong> improvement of the product-mix<br />
through the launch of new products will constitute our immediate responses<br />
to this inflation.<br />
Against this background, the Group aims for 2011 to improve its competitive<br />
positions on the markets, achieve sales growth <strong>and</strong> a higher operating margin<br />
<strong>and</strong> continue to generate cash. The international nature of our business, our<br />
product dynamics, the power of our br<strong>and</strong>s as well as a diversifi ed retail<br />
distribution tailored to our markets will continue to constitute key factors<br />
for our future growth. The continuation of our balanced industrial strategy<br />
which is close to our markets, our strict management of working capital<br />
requirements <strong>and</strong> costs should contribute to maintaining our good results<br />
<strong>and</strong> our financial balance.<br />
The Group is capable of responding swiftly to any cyclical event that may<br />
occur such as the socio-political unrests in certain parts of the world earlier<br />
this year or natural disasters <strong>and</strong> their consequences, such as the recent<br />
unfortunate events in Japan.<br />
Furthermore, the early months of 2011 were characterized by signifi cant<br />
new advances:<br />
the relaunch of Moulinex in the 9 European countries which the European<br />
Commission took from us in 2002, represents a tremendous opportunity<br />
to regain a foothold on these markets where the br<strong>and</strong> still has a strong<br />
reputation;<br />
the acquisition of Imusa, fi nalized on 28 February with the success of<br />
the Public Purchase Offering <strong>and</strong> the company’s squeeze-out from listing,<br />
is a tangible manifestation of our development in Latin America <strong>and</strong> opens<br />
up new markets for us;<br />
the plan to strengthen our equity interest in Supor, up to an additional<br />
20% of the capital, is intended to consolidate the long-term investment<br />
that we made in 2007 <strong>and</strong> ensure Supor’s continued development in a<br />
solid <strong>and</strong> stable shareholding configuration.<br />
18 FINANCIAL REPORT AND REGISTRATION DOCUMENT <strong>2010</strong> GROUPE SEB
1<br />
GROUPE SEB IN <strong>2010</strong><br />
RISK MANAGEMENT<br />
RISK MANAGEMENT<br />
<strong>Groupe</strong> SEB pursues a policy of active, prudent management of the risks<br />
inherent in its business, the purpose of which is to defend the Group’s<br />
assets <strong>and</strong>/or interests of its stakeholders: shareholders, employees, clients,<br />
consumers, suppliers, etc., without forgetting environmental aspects.<br />
This approach is based on a detailed mapping <strong>and</strong> analysis of the main<br />
risks faced by the Company, which makes it possible to rank them on the<br />
basis of their potential impact on the Group’s operations <strong>and</strong> performance,<br />
<strong>and</strong> on the probability of such risks occurring. A comprehensive review of<br />
these risks is carried out regularly with the Group Executive Committee <strong>and</strong><br />
the Audit Committee.<br />
1<br />
RISKS INHERENT TO OPERATIONS<br />
COUNTRY-SPECIFIC AND ECONOMIC<br />
SITUATION RISKS<br />
The international nature of the Group’s business exposes it to currency<br />
risk (covered in Note 26.2.1 to the Consolidated <strong>Financial</strong> Statements)<br />
but also risks of political instability, economic, monetary or labour risks,<br />
especially in Asia, the Middle East <strong>and</strong> South America. In addition to<br />
these risks, certain countries have under-developed legal systems or<br />
those which offer little in the way of intellectual property protection, import<br />
taxes (e.g. Turkey for certain small electrical products), restrictive measures,<br />
exchange controls, etc. These factors may disturb or even penalize the<br />
Group’s business or financial situation. Nonetheless, this big international<br />
presence also offers protection through wide geographical coverage <strong>and</strong><br />
risk diversification.<br />
Alongside this, Group sales inevitably depend on the economic climate <strong>and</strong><br />
whether consumption holds up or not, which, in turn, is related to consumer<br />
purchasing power <strong>and</strong> the financial health of our retail distribution network.<br />
In this respect, the end of 2008 <strong>and</strong> the entire 2009 were complex, with the<br />
Group having to deal with various situations in various countries: serious<br />
recession <strong>and</strong> collapse of dem<strong>and</strong> (Russia, USA, UK, etc.); serious recession<br />
but resistance in small electrical appliances <strong>and</strong> high performance by<br />
the Group (Spain, Greece, Japan, etc.); a moderate crisis <strong>and</strong> sustained<br />
consumption (France, Germany, Brazil), etc. In consideration of the very<br />
nature of the business (focus on the home) <strong>and</strong> the limited investment<br />
represented by small domestic equipment, the small electrical appliance<br />
sector held up better than others <strong>and</strong>, in several markets, the Group’s<br />
results were even totally opposite to the economic situation: this was the<br />
case for Spain, Japan, etc. <strong>2010</strong> unfolded in a generally more buoyant<br />
environment, without any major glitches, but recovery was not the same in<br />
all zones. Central Europe joined the crisis quite late <strong>and</strong> only showed signs<br />
of a recovery towards the end of the year, while after months of sustained<br />
dem<strong>and</strong>, business in Spain, on the contrary, shrank in the last quarter.<br />
RISKS RELATING TO SOLD PRODUCTS<br />
Risks of warranty or liability claims<br />
<strong>Groupe</strong> SEB makes consumer safety an absolute priority. In this respect,<br />
it affords maximum attention to safety precautions in terms of raw materials,<br />
components <strong>and</strong> finished products. It is exposed to a risk of warranty<br />
or liability claims from its clients <strong>and</strong> consumers; these risks have been<br />
reasonably provided for. In particular, the impact of the change to a 2-year<br />
guarantee for small electrical appliances in the European Union has been<br />
integrated into these provisions. Additionally, to protect itself against cases<br />
of defective products causing damage, the Group has taken out civil liability<br />
insurance (see Insurance section).<br />
Recovering <strong>and</strong> recycling end-of-life products<br />
European directive 2002/96/EC on Waste Electrical <strong>and</strong> Electronic<br />
Equipment (WEEE) requires manufacturers to factor in the reprocessing or<br />
recycling of end-of-life products, which then leads to financial challenges.<br />
Transposed since end 2005 into the legislation of a large majority of European<br />
countries, it requires the collection <strong>and</strong> treatment of electrical <strong>and</strong> electronic<br />
appliances at the end of their lives.<br />
In European countries concerned by this Directive, <strong>Groupe</strong> SEB decided<br />
to participate in eco-organizations which will h<strong>and</strong>le the recycling of “new”<br />
<strong>and</strong> “historical” waste on behalf of manufacturers. The obligation to collect<br />
<strong>and</strong> process WEEE is pro rata to the equipment put on the market during<br />
the year of collection, <strong>and</strong> is payable in advance. In consequence, there is<br />
no need to accrue provisions for this at the time the electrical products are<br />
released on the market.<br />
RISKS RELATING TO BRAND ASSETS<br />
<strong>Groupe</strong> SEB has built its business on a powerful portfolio of br<strong>and</strong>s, some of<br />
which are treated as assets in its balance sheet. For <strong>Groupe</strong> SEB, the total<br />
book value of its br<strong>and</strong>s at 31 December <strong>2010</strong> amounted to €321 million,<br />
<strong>and</strong> concerned mainly Rowenta, All-Clad, Lagostina <strong>and</strong> Supor.<br />
Moreover, as <strong>Groupe</strong> SEB regularly engages in external growth operations,<br />
goodwill is shown in the consolidated financial statements at the end of <strong>2010</strong><br />
for an amount of €409 million, most of this having been recognised at the<br />
time of the All-Clad <strong>and</strong> Supor acquisitions.<br />
Under IFRS accounting st<strong>and</strong>ards, the value of br<strong>and</strong>s <strong>and</strong> goodwill must<br />
be reviewed annually to check that the value entered in the balance sheet is<br />
consistent with the actual performance of the br<strong>and</strong>s <strong>and</strong> the subsidiaries in<br />
their own markets. Any significant disparities, notably with regard to expected<br />
cash fl ow, a br<strong>and</strong>’s commercial under-performance, or increased costs<br />
incurred by the subsidiaries concerned, could require an adjustment in the<br />
balance sheet which may involve a partial or total recognition of impairment<br />
GROUPE SEB<br />
FINANCIAL REPORT AND REGISTRATION DOCUMENT <strong>2010</strong><br />
19
1 RISK<br />
GROUPE SEB IN <strong>2010</strong><br />
MANAGEMENT<br />
of the asset’s value. The economic crisis in 2009 had a high impact on<br />
the trading activity <strong>and</strong> profitability of All-Clad in the USA, as the high-end<br />
segment suffered greatly from a pullback in consumption <strong>and</strong> a drop in visits<br />
to premium retail distribution outlets. In 2009, this under-performance led<br />
the Group to recognize impairment losses for its All-Clad assets (goodwill) to<br />
ensure prudence against the extent of the crisis period. The partial recovery<br />
of operations in <strong>2010</strong> does not however, mean that All-Clad’s situation is back<br />
to normal, since its performance levels have still not returned to the required<br />
levels under the initial business plan. That is why the Group has decided<br />
to proceed to an additional recognition of impairment for the goodwill of<br />
All-Clad in <strong>2010</strong> in order to take account of the residual difference between<br />
actual performance <strong>and</strong> forecasts. These one-off adjustments linked to a<br />
very specific economic situation have no effect on the value of the br<strong>and</strong>,<br />
of which the reputation, power <strong>and</strong> potential remain intact.<br />
Furthermore, with a view to creating value for its br<strong>and</strong>s, the Group is<br />
investing in R&D in order to maintain its offering with innovative, groundbreaking<br />
products, as well as in advertising <strong>and</strong> marketing with the purpose<br />
of improving the visibility of its br<strong>and</strong>s, boosting its sales <strong>and</strong> strengthening<br />
its competitive positions in the field.<br />
Supplementary information is provided in Note 10 to the Consolidated<br />
<strong>Financial</strong> Statements.<br />
CLIENT RISKS<br />
The variety <strong>and</strong> the number of the Group’s retail distribution networks limit<br />
risk <strong>and</strong> the probability of major impact on a consolidated level. On a country<br />
level however, a client bankruptcy (especially a major client) may have<br />
significant consequences on the trading activity of the subsidiary in question.<br />
The financial <strong>and</strong> economic climate in 2008 <strong>and</strong> 2009 amplified this risk, in<br />
particular due to the fall-off in consumption in many countries <strong>and</strong> the credit<br />
crunch, which strongly affected certain retail chains. Over these two years,<br />
the Group had to cope with the closure of Linens ’N’ Things in the USA<br />
<strong>and</strong> Canada (385 stores in all), the discontinuation of Karstadt in Germany<br />
<strong>and</strong> financial difficulties for Comercial Mexicana in Mexico <strong>and</strong> again the<br />
acquisition of Eldorado, the Russian specialist by the PPF Czech bank.<br />
<strong>2010</strong> brought a healthier financial situation for retailers <strong>and</strong> no new defaults<br />
were observed over the period. However, the crisis left traces <strong>and</strong> retailers<br />
maintain a cautious stock policy <strong>and</strong> have not massively restocked with<br />
the recovery.<br />
Whatever the case, the Group implements a cautious policy towards its<br />
retailing clients, based on the subscription of client coverage insurance.<br />
Due to the crisis <strong>and</strong> the increase in claim rates, client coverage has been<br />
drastically reduced – by COFACE in this case – in 2009, especially in certain<br />
countries that suffered greatly from the harsh economic climate. In light of<br />
this situation, <strong>and</strong> with a view to the long-term management of its retailers, in<br />
certain cases <strong>Groupe</strong> SEB allowed client receivables to exceed the covered<br />
amounts <strong>and</strong> increased the non-insured portion (previously insignifi cant)<br />
on one h<strong>and</strong> <strong>and</strong> the amount of provisions for risks of non-recovery of<br />
receivables on the other h<strong>and</strong>. Nonetheless, these risks are taken under<br />
strict supervision at Group level: strengthening of the “Credit management”<br />
function <strong>and</strong> systematic validation by two members of the Executive<br />
Committee of any non-covered risk greater than €0.5 million. The risk of a<br />
major impact subsequent to potentially inadequate results should therefore<br />
be limited. In <strong>2010</strong> on the other h<strong>and</strong>, the coverage rate rose sharply <strong>and</strong> in<br />
fact, no significant claim was made.<br />
RISKS RELATING TO COMPETITION<br />
In recent years, the competitive climate has become more severe in both<br />
mature <strong>and</strong> emerging markets, although the issues we face differ in both.<br />
Given that mature markets are already well equipped, they are driven more by<br />
supply than by dem<strong>and</strong> <strong>and</strong> are clearly structured into 3 segments, the entry<br />
level with plain, st<strong>and</strong>ardized products, mid range, the largest in size <strong>and</strong><br />
where momentum is key, <strong>and</strong> premium, dedicated to exceptional products<br />
(in terms of technology, design or status). Competition is particularly fierce<br />
in these markets: major established br<strong>and</strong>s, whether national, regional or<br />
international, compete alongside entry-level, low-cost no-br<strong>and</strong> products<br />
<strong>and</strong> distributor br<strong>and</strong>s, which are growing stronger, taking advantage of<br />
the diffi cult times. In addition, retail distributors often <strong>and</strong> increasingly,<br />
play a catalyst role in competition. <strong>Groupe</strong> SEB is long-established <strong>and</strong><br />
occupies strong front-rank positions in mature markets thanks in particular<br />
to its powerful br<strong>and</strong> portfolio <strong>and</strong> extensive offer which allows it to cover<br />
all segments.<br />
Emerging markets are still in an equipment phase. The development of a<br />
middle class with higher purchasing power generally fosters rapid growth<br />
in dem<strong>and</strong> for higher-value product ranges. This phenomenon is supported<br />
by the increasing implantation of modern retail distribution circuits in these<br />
markets. Aware from the start that these countries had high potential <strong>and</strong><br />
that their consumers sought status through products, top br<strong>and</strong>s built up<br />
strong positions – in particular <strong>Groupe</strong> SEB, which is a leader in many of<br />
these countries today. These markets have a pyramid structure, with a broad<br />
though shallow base in entry-level products, a substantial mid-range section,<br />
<strong>and</strong> a niche high-end segment. Competition is fi ercer, rapidly joining the<br />
st<strong>and</strong>ards of mature markets.<br />
It is essential to gain market share in this highly competitive climate. This can<br />
be achieved by br<strong>and</strong> reputation <strong>and</strong> the relevance of the product offer,<br />
spurred by innovation alongside strong advertising <strong>and</strong> marketing support.<br />
The 2008-2009 economic crisis simply amplified competition between<br />
market players, with in certain cases, an accentuated price war to boot.<br />
A capacity to develop <strong>and</strong> launch genuinely differentiating, added-value<br />
innovations at the right time is therefore fundamental. An entire product family<br />
can be affected both brutally <strong>and</strong> for longer periods by the introduction of a<br />
new concept requested by consumers, with a significant impact on results:<br />
highly positive for the breakout product in question, highly negative for its<br />
competitor(s). <strong>Groupe</strong> SEB therefore strives to limit the risk of competition<br />
by boosting its R&D efforts in order to stay ahead <strong>and</strong> lead the market (this<br />
area has seen growing budget allocations over the last three years in both<br />
skills <strong>and</strong> investment).<br />
INDUSTRIAL RISKS<br />
As in all industrial processes, <strong>Groupe</strong> SEB is exposed to events of varying<br />
origins (natural catastrophes, fi re, technical failures, contamination, etc.)<br />
that can affect or interrupt the operations of a plant or even endanger the<br />
safety of its production resources, with major consequences for people<br />
<strong>and</strong> equipment. It has therefore always implemented an active industrial<br />
risk prevention approach through regular audits, investment in maintenance<br />
<strong>and</strong> optimization of certain processes in order to limit the probability of<br />
occurrence of such risks.<br />
20 FINANCIAL REPORT AND REGISTRATION DOCUMENT <strong>2010</strong> GROUPE SEB
1<br />
GROUPE SEB IN <strong>2010</strong><br />
RISK MANAGEMENT<br />
In practice, European <strong>and</strong> American sites are in general not, or only slightly,<br />
exposed to major natural risks (tornadoes, floods, earthquakes, etc.).<br />
However, due to the globalisation of the Group’s business, it may have<br />
operations in exposed zones, especially in earthquake prone regions. In<br />
addition, the industrial operations themselves do not generate any particular<br />
risks. Besides metal stamping (pressure cookers, frying pans <strong>and</strong> saucepans),<br />
surface treatments (nonstick) <strong>and</strong> the production of certain components that<br />
occupy less than 10% of total industrial resources, most of <strong>Groupe</strong> SEB’s<br />
production involves assembly operations. The most sensitive processes are<br />
closely monitored. In assembly processes, the most likely risks are minor<br />
bodily injuries or injuries due to h<strong>and</strong>ling, as well as musculoskeletal disorders<br />
for which the Group takes all precautions (training in ergonomics, sponsors<br />
<strong>and</strong> Steering Committee on each site, etc.) to minimize their occurrence.<br />
Concerning the Chinese company Supor, integrated since 1 January 2008,<br />
a detailed audit carried out in 2008 enabled us to measure potential areas<br />
for improvement in terms of safety (personnel, manufacturing or storage<br />
processes, etc.) on production sites in China. Although no major breaches<br />
were pinpointed in terms of industrial risk management, it nevertheless failed<br />
to meet the Group’s st<strong>and</strong>ards. The action plans carried out in the last three<br />
years have already helped to generally reduce the gap with the Group’s<br />
required level, but residual discrepancies <strong>and</strong> improvement efforts still exist.<br />
In parallel <strong>and</strong> conscious of environmental issues, the Group has for a long<br />
time prioritized safeguarding the environment through its eco-production<br />
policy, which involves ISO 14001 certification of its industrial sites. At year<br />
end <strong>2010</strong>, 78% (75% at year end 2009) of all the Group’s industrial <strong>and</strong><br />
logistics entities worldwide had obtained this certification.<br />
COMMODITY RISKS<br />
<strong>Groupe</strong> SEB’s operations involve the use of several major raw materials in its<br />
industrial processes: aluminium (for cookware), nickel (for certain steel alloys),<br />
copper (mainly wire for motors <strong>and</strong> electric cables), plastic (a key material in<br />
small electrical appliances) <strong>and</strong> paper or cardboard for printed documents<br />
<strong>and</strong> packaging. These materials weigh variably on the Group’s purchasing<br />
budget, Supor included: In <strong>2010</strong>, aluminium represented approximately 12%<br />
of direct manufacturing purchases, steels 7% <strong>and</strong> plastics 19%.<br />
<strong>Groupe</strong> SEB is therefore exposed to risks concerning the availability of raw<br />
materials <strong>and</strong> fl uctuations in their prices insofar that it could suffer from<br />
a shortage <strong>and</strong>/or have to pass any price increases – whether partially or<br />
totally – on to its retail prices. This would have a potential impact on the<br />
level of trading activity, profitability <strong>and</strong> cash flow. Since 2007, the trend is<br />
one of high price volatility for raw materials <strong>and</strong> metal prices in particular.<br />
The phenomenon did not change in <strong>2010</strong> with a scissor effect between a low<br />
point at the end of 2008 <strong>and</strong> a rebound, initially progressive in 2009, then<br />
more abrupt in <strong>2010</strong>. The average prices in <strong>2010</strong> were almost systematically<br />
greater than those of 2009 for aluminium, nickel, copper, plastics, etc. This<br />
inflationary trend has sharply intensified <strong>and</strong> accelerated in recent months.<br />
To face this intrinsic exposure related to its industrial operations, <strong>Groupe</strong><br />
SEB deploys a partial hedging policy on a rolling 12-month basis intended<br />
to protect it against the effects of abrupt variations in metal prices <strong>and</strong> to<br />
enable it to forecast or limit any price hikes that it may have to pass on to<br />
its clients. This policy is not for speculative purposes but, for any given year<br />
<strong>and</strong> in relation to actual market prices, may produce:<br />
positive results when raw material prices are rising;<br />
negative results when the same prices are dropping.<br />
The hedging <strong>and</strong> sensitivity of commodity risks are dealt with in Note 26.2.3<br />
to the Consolidated <strong>Financial</strong> Statements.<br />
RISKS CONCERNING INFORMATION SYSTEMS<br />
The Group continues to deploy coherent IT systems in all its subsidiaries to<br />
ensure better management <strong>and</strong> client service <strong>and</strong> to minimize the inherent<br />
risks in obsolete local systems. It concentrates its IT budget on a limited<br />
number of software packages used selectively throughout the Group,<br />
depending on the size of each subsidiary (SAP R/3 for larger entities, or those<br />
participating in clusters, <strong>and</strong> SAP Business One for more compact entities).<br />
This increased dependency on Group-wide information systems generates<br />
risks concerning the integrity <strong>and</strong> confidentiality of data <strong>and</strong> possible<br />
interruption of IT services. A failure might lead to loss of data, errors or delays<br />
that could impede the proper functioning of the Company <strong>and</strong> affect its<br />
results. Thorough testing prior to the deployment of new systems <strong>and</strong> a strict<br />
information system security policy (monitored by a Steering Committee) are<br />
put in place to ensure that systems are fully reliable, secure <strong>and</strong> accessible.<br />
Regular investments are made to improve the Business Continuity Plan in<br />
case of a major disaster on the primary IT processing centre. Anti-hacking<br />
audits are carried out each year to identify any security loopholes in the<br />
Group’s network. Lastly, the management rules for access rights to systems<br />
are audited <strong>and</strong> then updated on a regular basis.<br />
LABOUR RELATIONS RISKS<br />
<strong>Groupe</strong> SEB is constantly adapting its structures, particularly its industrial<br />
base, to ensure that it remains competitive. Despite a responsible approach<br />
to restructuring, plant closures remain a serious <strong>and</strong> disagreeable task<br />
which can affect the quality of relations between management, employees<br />
<strong>and</strong> labour unions, <strong>and</strong> which could have repercussions on the Group’s<br />
operations, performance <strong>and</strong> results.<br />
Over the past few years, <strong>Groupe</strong> SEB has carried out several industrial<br />
restructuring plans in France <strong>and</strong> elsewhere, featuring site closures <strong>and</strong><br />
downsizing which led to job losses. These operations have had a disruptive<br />
effect on the Group’s trading activity, but it has endeavoured to complete<br />
them fully in keeping with our ethical values. The Group has put in place<br />
substantial <strong>and</strong> often costly resources to ensure a solution for every employee<br />
concerned: measures such as internal mobility, help with personal projects,<br />
assistance with external re-employment, age-related measures, or long-term<br />
training schemes meant that the vast majority of employees succeeded in<br />
finding a solution. In most cases, the Group has also managed to ensure the<br />
reindustrialization of the employment zones involved by helping to identify<br />
new operators <strong>and</strong> support the set-up of business activities to create jobs<br />
at the sites concerned.<br />
The Group gives high priority to the quality of ongoing dialogue with<br />
employee representatives to solve difficult labour issues responsibly <strong>and</strong> in<br />
the best possible conditions for everyone.<br />
1<br />
GROUPE SEB<br />
FINANCIAL REPORT AND REGISTRATION DOCUMENT <strong>2010</strong><br />
21
1 RISK<br />
GROUPE SEB IN <strong>2010</strong><br />
MANAGEMENT<br />
RISKS RELATING TO ACQUISITIONS<br />
Over the last 40 years, while pursuing its leadership strategy, <strong>Groupe</strong> SEB<br />
has alternated its development through organic growth <strong>and</strong> acquisitions.<br />
Today, it continues to play a key active role in consolidating the stillfragmented<br />
Small Household Equipment sector.<br />
External growth requires an ability to induct new acquisitions effectively <strong>and</strong><br />
generate synergies. With its many acquisitions over the years, <strong>Groupe</strong> SEB<br />
has built up experience in integrating newly acquired companies. Having<br />
integrated Moulinex-Krups in 2001-2002, it acquired All-Clad in the United<br />
States in 2004, Panex in Brazil <strong>and</strong> Lagostina in Italy in 2005 <strong>and</strong> Mirro<br />
WearEver in the United States in 2006. It went on to take majority control of<br />
the Chinese company Supor at the end of 2007. This latest operation st<strong>and</strong>s<br />
out through the major challenges it presents: separation through distance<br />
<strong>and</strong> culture, language barrier, more complex integration, coordination of<br />
communications between two listed companies, harnessing synergies, etc.<br />
All these integration <strong>and</strong> synergy creation efforts are coordinated by a Special<br />
Steering Committee <strong>and</strong> have so far made highly satisfactory progress in<br />
line with expectations.<br />
Nonetheless, success is never guaranteed from the outset <strong>and</strong> may depend<br />
on external factors, even with every effort <strong>and</strong> the allocation of resources<br />
to the integration process. Regular monitoring of progress on projects <strong>and</strong><br />
synergies implemented by an Integration Committee is a way of limiting<br />
the risk of failure <strong>and</strong> allows us to retarget our actions in the event of<br />
delays. <strong>Groupe</strong> SEB implements this approach consistently to optimize the<br />
integration of recently acquired companies.<br />
DEPENDENCY RISKS<br />
DEPENDENCE ON SUPPLIERS<br />
As part of its policy of bulk buying, <strong>Groupe</strong> SEB has drawn up an approved<br />
panel of suppliers for production (330 in <strong>2010</strong> versus 320 in 2009) who<br />
accounted for approximately 90% of all its European plant manufacturing<br />
supplies <strong>and</strong> 85% of its worldwide needs last year. Excluding sourcing,<br />
the top 50 suppliers accounted for 50% of direct production purchases in<br />
value (41% in 2009). With respect to purchases of finished products, <strong>Groupe</strong><br />
SEB has drawn up a panel of 52 suppliers who account for 73% of total<br />
purchases; the top 26 suppliers alone account for 80% of the total value<br />
of these purchases.<br />
On the basis of <strong>2010</strong> figures, the top three production suppliers account<br />
for about 3% each of the total amount of purchases; the top 3 suppliers of<br />
finished products account for 30% of the total (the first alone accounts for<br />
approximately 20% but the next two 5% each). Beyond the weight of the<br />
first, the low numbers of the immediate in line show that the Group’s policy<br />
of optimizing purchasing procedures (in particular procuring from a smaller<br />
number of suppliers) did not result in concentration of risks. The Group is<br />
effectively dependent on external suppliers, where a late service or delivery<br />
or even bankruptcy could be highly prejudicial to its trading activity; it is<br />
therefore especially vigilant in spreading its risk base <strong>and</strong> limiting its reliance.<br />
Its priority is to ensure continuity of production in optimum economic<br />
conditions in the event of a supply failure, through the use of substitute<br />
products, for example.<br />
DEPENDENCE ON CLIENTS<br />
chains over the past few years (<strong>and</strong> which is ongoing, i.e. the agreements<br />
signed between CBD/Ponto Frio <strong>and</strong> Casas Bahia in Brazil in December 2009)<br />
has altered relations for suppliers:<br />
fewer clients;<br />
altered negotiating power, the trend being to tighten<br />
conditions (requirements concerning suppliers, financial conditions,<br />
logistics or other services);<br />
greater risk in the event of business failure.<br />
In <strong>2010</strong>, despite rising concentration, the share of the top ten clients in the<br />
Group’s turnover did not increase; on the contrary, it dropped since our<br />
top 10 retailers accounted for approximately 29% of consolidated sales in<br />
<strong>2010</strong> (versus 33% in 2009), with specifically Metro, the number 1 client, which<br />
accounted for nearly 5.5% of total turnover (6% in 2009), <strong>and</strong> Carrefour –<br />
the Group’s number 2 client – close to 5% of the Group’s sales (nearly<br />
6% in 2009). This drop first reflects our policy to diversify retail distribution<br />
channels, mainly by capitalizing on the strong momentum of specialized<br />
outlets <strong>and</strong> on the importance in many countries of neighbourhood stores. It<br />
also reflects the increasing popularity of e-business (Amazon or C-discount<br />
for instance), which reports the highest growth in our line of business.<br />
This phenomenon is not cyclical but structural; it represents a fundamental<br />
trend, which is attracting consumers who are more sensitive to br<strong>and</strong>s, all<br />
the more so due to the secure forms of payment on websites.<br />
Whatever the case, the Group’s international presence <strong>and</strong> the wide diversity<br />
of the retail distribution channels it uses around the world help to guarantee<br />
some level of dilution of customer risk.<br />
The retailer is <strong>Groupe</strong> SEB’s direct client, <strong>and</strong> the consumer is its fi nal<br />
customer. The recent concentration of major international retail distribution<br />
22 FINANCIAL REPORT AND REGISTRATION DOCUMENT <strong>2010</strong> GROUPE SEB
1<br />
GROUPE SEB IN <strong>2010</strong><br />
RISK MANAGEMENT<br />
LEGAL RISKS<br />
RISKS RELATING TO INDUSTRIAL PROPERTY<br />
<strong>Groupe</strong> SEB sells its products throughout the world, based on a portfolio of<br />
internationally or regionally well-known br<strong>and</strong>s <strong>and</strong> on innovation. It must<br />
therefore constantly defend these br<strong>and</strong>s <strong>and</strong> protect its business assets<br />
by filing patents <strong>and</strong> registering trademarks <strong>and</strong> designs. These measures<br />
are not always suffi cient on a global scale, as some countries offer less<br />
protection than the Group’s traditional markets in Europe <strong>and</strong> North America.<br />
As a result, sales are often “appropriated” by copied <strong>and</strong> counterfeited<br />
products <strong>and</strong> this can have a significant effect on growth <strong>and</strong> profitability.<br />
This obliges the Group to defend its rights by being actively vigilant in the<br />
most critical zones (China <strong>and</strong> the Middle East), by having these products<br />
seized <strong>and</strong> destroyed by the local authorities, or by taking legal action.<br />
Such measures inevitably come at a cost, in addition to the loss of earnings<br />
as a result of counterfeiting. For this reason, the Group works pre-emptively<br />
in collaboration with customs authorities to limit the impact of these practices<br />
on its business.<br />
In <strong>2010</strong>, the Group’s investment in industrial property remained at an almost<br />
constant level, but with different allocations to each action.<br />
1<br />
FINANCIAL MARKET RISKS<br />
FINANCING RISK AND LIQUIDITY RISK<br />
<strong>Groupe</strong> SEB’s business is based on a short-term cycle <strong>and</strong> does not dem<strong>and</strong><br />
heavy capital investment.<br />
Financing risk <strong>and</strong> liquidity risk is managed centrally by the Finance <strong>and</strong><br />
Treasury department. The Group’s financing policy is to ensure the liquidity<br />
needed to fi nance its assets, working capital requirements <strong>and</strong> business<br />
development on a sound financial basis. This is structured around diversified<br />
short <strong>and</strong> medium-term financing sources, a blend of commercial papers,<br />
syndicated loans, private Schuldshein-type investments, without restriction<br />
on their use. <strong>Groupe</strong> SEB also has permanent access to unused confirmed<br />
medium-term credit lines with leading banks. In this way, the Group’s<br />
financing is assured over the long-term.<br />
Details of the maturity dates of the instruments used <strong>and</strong> the fi nancing<br />
sources available are provided in Notes 24, 25 <strong>and</strong> 26 to the Consolidated<br />
Accounts.<br />
INTEREST-RATE RISK AND CURRENCY RISK<br />
The Group sells its products in more than 150 countries. With a substantial<br />
proportion of our manufacturing still based in Europe (40% of products<br />
sold), the Group’s business is strongly export-oriented. Exchange rate<br />
swings thus affect our ability to be competitive, so that these must be<br />
effectively managed from a long-term perspective. To limit the direct impact<br />
of currency fluctuations, <strong>Groupe</strong> SEB strives to balance incoming flows (such<br />
as sales revenue) <strong>and</strong> outgoing flows (such as costs) in each currency <strong>and</strong><br />
especially in terms of procurement, by diversifying sources geographically.<br />
However, this cannot fully redress imbalances, as the Group’s dollar position<br />
is short-term, while for several other currencies it is long-term. To limit this<br />
risk, the Group also uses financial instruments to hedge transaction risks.<br />
Since year end 2008, the Group’s trading activity has been strongly disrupted<br />
by volatile exchange rates. Given the swings between the sharp collapse<br />
of several currencies (rouble, Korean won, Turkish lira, Mexican peso…)<br />
against the euro in 2009 <strong>and</strong> the rallying of these same currencies in <strong>2010</strong>,<br />
the Group is forced to constantly adapt its pricing policy: increasing sale<br />
prices to preserve the local profitability of commercial subsidiaries where<br />
the relevant currency depreciates against the euro <strong>and</strong> adjusting prices<br />
downwards to preserve market momentum <strong>and</strong> competitiveness where<br />
foreign currency/euro exchange rates improve. The effects on the Group’s<br />
turnover are therefore very different from one year to another; for example,<br />
the exchange rate effects had a negative impact of €63 million on sales in<br />
2009, while in <strong>2010</strong> it had a positive impact of +€171 million. The effects<br />
also impacted income albeit less dramatically.<br />
Group financing uses mostly variable-rate loans in currencies that correspond<br />
to its needs (mainly the euro <strong>and</strong> the US dollar). Hedging operations<br />
covering part of the Company’s debt – the longest-term extending to 2015 –<br />
make it possible for the Group to protect itself against the likelihood of<br />
interest-rate rises.<br />
Details of interest rate <strong>and</strong> exchange rate risks are given in Notes 26.2.1 <strong>and</strong><br />
26.2.2 to the Consolidated <strong>Financial</strong> Statements.<br />
RISKS RELATING TO SHARES<br />
At 31 December <strong>2010</strong>, <strong>Groupe</strong> SEB held 1,980,698 of its treasury stock<br />
for a total value of €61.7 million. This treasury stock is deducted from<br />
shareholders’ equity at acquisition cost.<br />
On the basis of the closing price of the SEB share at 31 December<br />
<strong>2010</strong> (€77.73), the market value of treasury stock was €154 million (this market<br />
value has no impact on the Group’s consolidated fi nancial statements).<br />
An increase or decrease of 10% in the value of the SEB share would therefore<br />
lead to a variation of €15.4 million in the market value of the treasury stock.<br />
This variation has no impact on the consolidated income statement or<br />
shareholders’ equity.<br />
Stock markets rallied after collectively collapsing worldwide in late 2008<br />
<strong>and</strong> early 2009 with the SEB share plunging to an all-time low of €16.44<br />
on 21 January 2009. The SEB share largely outperformed benchmarks in<br />
2009 <strong>and</strong> <strong>2010</strong>, with an annual price hike of 85% in 2009 <strong>and</strong> 96% in <strong>2010</strong>.<br />
Further information on share risks is given in Note 26.2.4 to the Consolidated<br />
<strong>Financial</strong> Statements. This data also takes account of risk on the Supor share<br />
which is quoted on the Shenzhen stock market.<br />
GROUPE SEB<br />
FINANCIAL REPORT AND REGISTRATION DOCUMENT <strong>2010</strong><br />
23
1 RISK<br />
GROUPE SEB IN <strong>2010</strong><br />
MANAGEMENT<br />
SENSITIVITY ANALYSIS<br />
<strong>Groupe</strong> SEB conducted a sensitivity analysis of data published in <strong>2010</strong> to<br />
assess the impact of euro-dollar parity variations on its operating margin<br />
<strong>and</strong> the effect of interest-rate variations on profit before tax.<br />
Concerning the euro-dollar exchange rate, as a regular buyer of dollars or<br />
in “dollar zones” (raw materials, products sourced in Asia, etc.), <strong>Groupe</strong><br />
SEB has held a short-term position in this currency for several years.<br />
The sensitivity analysis shows that a 1% variation in the euro-dollar exchange<br />
rate would have an impact of about €3 million on the Group’s operating<br />
margin. However, other important operating currencies for the Group could<br />
also have a significant impact on operating margin. These include the yen,<br />
the rouble, the pound sterling, the Turkish lira, the Korean won, the Polish<br />
zloty, the Brazilian real <strong>and</strong> the Mexican peso. The massive depreciation of<br />
the majority of the currencies mentioned above in late 2008, early 2009 <strong>and</strong><br />
the fact that they remained at low levels afterwards, had a highly negative<br />
impact on the 2009 operating margin, despite the progressively favourable<br />
effect of a falling dollar on purchases. The effect was totally reversed in <strong>2010</strong>.<br />
This sensitivity analysis does not take into account the impact of currency<br />
exchange fluctuations on the competitive capacity of our European industrial<br />
facilities, which still represent a large share of the Group’s production: a<br />
strong euro in relation to most other currencies, notably the US dollar, makes<br />
European manufacturing more expensive than production in dollar zones,<br />
<strong>and</strong> thus acts as a curb on exports. Inversely, a stronger dollar could be<br />
a source of better competitiveness for our European production sources.<br />
With regard to interest rates, the analysis shows that the impact of a variation<br />
of 100 base points in short-term interest rates on profit before tax would be<br />
€2 million (€4 million in 2009).<br />
Notes 26.2.1, 26.2.2 <strong>and</strong> 26.2.3 to the Consolidated <strong>Financial</strong> Statements<br />
provide additional information on the Group’s sensitivity to currency<br />
fluctuations, variations in interest rates <strong>and</strong> raw materials prices.<br />
INSURANCE<br />
GROUP GENERAL INSURANCE COVER<br />
<strong>Groupe</strong> SEB’s policy concerning insurance cover is to protect its assets<br />
against risks which could affect the Group. This transfer of risk to our insurers<br />
is nonetheless accompanied by risk protection <strong>and</strong> prevention measures.<br />
INTEGRATED WORLDWIDE COVER<br />
The Group has established a worldwide insurance plan with major international<br />
insurers to protect itself against major risks, which include damage to<br />
property <strong>and</strong> loss of earnings, civil liability, client <strong>and</strong> transport risks.<br />
Damage to assets <strong>and</strong> loss of earnings<br />
Cover for risk of damage to property <strong>and</strong> consequent loss of earnings due<br />
to the customary risks (fire, explosion, etc.), amounts to €250 million per<br />
claim for factories <strong>and</strong> warehouses.<br />
This cover ceiling was calculated on the basis of the maximum possible risk,<br />
in consultation with the insurers <strong>and</strong> their assessors. This valuation assumes<br />
total destruction, in a single year, of one of the Group’s main production<br />
sites. Lower thresholds are fi xed for other categories of more specifi c or<br />
localized risk, such as the risk of earthquake in certain zones where the<br />
Group operates abroad.<br />
This insurance cover takes into consideration additional risk protection<br />
measures at Group sites, which are regularly visited by specialist risk<br />
prevention assessors from the insurance companies concerned.<br />
Civil liability<br />
All the Group’s subsidiaries are included in a worldwide civil liability insurance<br />
scheme that covers liability relating to their operations, their responsibilities<br />
in relation to their manufactured products <strong>and</strong> the cost of product recalls.<br />
Cover amounts are based on reasonable estimates of the risks incurred by<br />
the Group in view of its business.<br />
The Group also guarantees the civil liability of its management under a<br />
specific insurance policy.<br />
ENVIRONMENT<br />
A multi-risk environmental insurance policy covers environmental risks.<br />
Cover applies to:<br />
accidental <strong>and</strong> gradual pollution;<br />
damage to biodiversity;<br />
depollution costs.<br />
Transport<br />
The Group’s transport insurance covers damage to transported merch<strong>and</strong>ise<br />
for all types of transport: sea, road/rail or air transport anywhere in the world.<br />
This insurance covers transport risks up to an amount of €6 million per loss<br />
occurrence.<br />
Client risk<br />
The Group’s subsidiaries subscribe to credit risk insurance to cover their<br />
risk on client receivables.<br />
LOCAL INSURANCE POLICIES<br />
More specific insurance policies are subscribed to locally by each of the<br />
Group’s companies, as appropriate.<br />
24 FINANCIAL REPORT AND REGISTRATION DOCUMENT <strong>2010</strong> GROUPE SEB
1<br />
GROUPE SEB IN <strong>2010</strong><br />
RISK MANAGEMENT<br />
EXCEPTIONAL EVENTS AND LITIGATION<br />
There were no exceptional events or litigation proceedings other than those<br />
referred to in Note 29.1 to the Consolidated <strong>Financial</strong> Statements.<br />
There were no other governmental, legal or arbitration procedures, including<br />
any of which the Group has knowledge <strong>and</strong> which are suspended or<br />
threatened, likely to or to have been likely to have a significant effect on the<br />
financial situation or the profitability of the Group over the last 12 months<br />
other than those reflected in the accounts or mentioned in the notes.<br />
1<br />
GROUPE SEB<br />
FINANCIAL REPORT AND REGISTRATION DOCUMENT <strong>2010</strong><br />
25
1 SOCIAL<br />
GROUPE SEB IN <strong>2010</strong><br />
PERFORMANCE INDICATORS<br />
SOCIAL PERFORMANCE INDICATORS<br />
The <strong>Groupe</strong> SEB human resources policy is based on major factors such as<br />
the respect of Human Rights, the development of skills, health <strong>and</strong> safety<br />
in the workplace, dialogue with labour organizations, diversity <strong>and</strong> equal<br />
opportunities.<br />
All data provided below concern our worldwide operations, except for<br />
information clearly identified, which does not include Supor.<br />
Data concerning this Chinese subsidiary will be included progressively, as<br />
<strong>and</strong> when it is integrated into the various Group processes.<br />
Highlights in <strong>2010</strong> include an increase in the number of managers in the<br />
Group, especially for women (+10.7%, excluding Supor).<br />
PAYROLL AND CHARGES<br />
(Worldwide)<br />
<strong>2010</strong> 2009 2008<br />
(in € millions)<br />
World France World France World France<br />
Payroll (a) 429.3 215.8 381.2 210.8 384.1 210.3<br />
Payroll taxes (b) 112.6 62.3 104.0 59.8 105.0 63.6<br />
Pension provisions 39.3 33.8 37.8 33.8 34.9 29.2<br />
(a) Excludes bonuses <strong>and</strong> profit sharing – includes provisions for paid vacation, excluding individual benefits.<br />
(b) Includes provisions for payroll taxes on paid vacation.<br />
BREAKDOWN OF EMPLOYEES BY GEOGRAPHICAL ZONE<br />
(Worldwide)<br />
(number of individuals) <strong>2010</strong> 2009 2008<br />
France 5,820 5,944 6,267<br />
Other Western European countries 1,416 1,405 1,506<br />
North America 726 649 670<br />
South America 2,268 2,026 2,156<br />
Asia/Pacific 12,101 9,976 7,571<br />
Central Europe, CIS <strong>and</strong> other countries 727 663 709<br />
TOTAL 23,058 20,663 18,879<br />
The change in the number of employees can be primarily explained by the increase in the Asia <strong>and</strong> Pacifi c workforce, especially in China <strong>and</strong> in Vietnam, in<br />
connection with the increase in operations in these geographical regions.<br />
26 FINANCIAL REPORT AND REGISTRATION DOCUMENT <strong>2010</strong> GROUPE SEB
1<br />
GROUPE SEB IN <strong>2010</strong><br />
SOCIAL PERFORMANCE INDICATORS<br />
BREAKDOWN OF EMPLOYEES BY CATEGORY<br />
(Worldwide)<br />
(as a %) <strong>2010</strong> 2009 2008<br />
Direct manual labour 49.9 48.7 44.6<br />
Admin & office staff 40.5 41.3 44.4<br />
Managers 9.6 10.0 11.0<br />
1<br />
TOTAL 100 100 100<br />
Following the consolidation of Supor, the percentage of manual workers<br />
has gone up to nearly 50%. Excluding Supor, the percentage of direct<br />
manual labour dropped from 35.4% in 2009 to 34.5% in <strong>2010</strong> while<br />
that of managers increased: 16.41% in 2009 versus 17.15% in <strong>2010</strong>.<br />
The percentage of female managers also increased from 5.3% in 2009 to<br />
5.7% in <strong>2010</strong> (excluding Supor).<br />
BREAKDOWN OF CHANGES IN STAFFING<br />
(Worldwide excluding Supor)<br />
(number of individuals) <strong>2010</strong> 2009 2008<br />
RECRUITMENT (a) 2,136 1,289 1,921<br />
Fixed-term contracts 829 614 630<br />
Permanent contracts 1,307 675 1,291<br />
DEPARTURES (a) 1,795 1,974 2,505<br />
Economic redundancies 91 388 300<br />
Terminations for other reasons 238 216 429<br />
AVERAGE RATE OF STAFF TURNOVER (b) (%) 4.51 3.6 4.7<br />
(a) Excluding internal transfers.<br />
(b) Number of resignations of permanent contract employees/Average number of permanent employees in <strong>2010</strong>.<br />
Increased trading activity generated an increase in recruitment (+65.7% between 2009 <strong>and</strong> <strong>2010</strong>).<br />
BREAKDOWN OF EMPLOYEES BY TYPE OF CONTRACT<br />
(Worldwide)<br />
(as a %) <strong>2010</strong> 2009 2008<br />
PERMANENT CONTRACTS 50.4 56.1 63.0<br />
Full-time 91.7 91.8 92.5<br />
Part-time 8.3 8.2 7.5<br />
FIXED-TERM OR OTHER SHORT-TERM CONTRACTS 49 43.3 36.3<br />
Full-time 99.3 99.3 97.3<br />
Part-time 0.7 0.7 2.7<br />
APPRENTICESHIP 0.6 0.6 0.7<br />
TOTAL 100 100 100<br />
The integration of Supor <strong>and</strong> the rise in its employee population have<br />
generated an increase in fi xed-term or other short-term contracts, very<br />
common in China <strong>and</strong> particularly in manual labour.<br />
Excluding Supor, the percentage of employees with permanent contracts<br />
has been stable over the last three years <strong>and</strong> exceeds 92%.<br />
GROUPE SEB<br />
FINANCIAL REPORT AND REGISTRATION DOCUMENT <strong>2010</strong><br />
27
1 SOCIAL<br />
GROUPE SEB IN <strong>2010</strong><br />
PERFORMANCE INDICATORS<br />
PERSONS WITH DISABILITIES<br />
(Worldwide)<br />
<strong>2010</strong> 2009 2008<br />
World France World France World France<br />
Number of employees<br />
with disabilities 435 273 447 290 526 335<br />
% of employees with disabilities (a) 1.88 4.66 2.16 4.88 2.79 5.35<br />
(a) Ratio between the number of employees with disabilities <strong>and</strong> total employee population as at 31 December <strong>2010</strong>, excluding temp employees <strong>and</strong> ESAT (Établissement et Service<br />
d’Aide par le Travail) sheltered employees.<br />
The rise in employee population in China, where the number of identified<br />
people with physical disabilities is relatively low (0.21%), has a sharp impact<br />
on the percentage of employees with disabilities in the Group. The fall in<br />
this rate can also be explained by a decrease in labour in France, especially<br />
following the closure of several sites since 2008. Excluding Supor, the<br />
percentage of employees with disabilities was 3.38%.<br />
ABSENTEEISM<br />
(Worldwide excluding Supor)<br />
<strong>2010</strong> 2009 2008<br />
World France World France World France<br />
Absenteeism rate (a) 3.23 4.09 4.11 4.98 4.26 5.40<br />
(a) Ratio between the number of absence days <strong>and</strong> the number of theoretical presence days.<br />
BREAKDOWN BY GENDER AND CATEGORY<br />
(Worldwide)<br />
(as a %) <strong>2010</strong> 2009 2008<br />
MALE<br />
Direct manual labour 29.4 28.6 25.4<br />
Admin & office staff 23.3 24.0 25.6<br />
Managers 6.5 6.9 7.6<br />
TOTAL 59.2 59.5 58.6<br />
FEMALE<br />
Direct manual labour 20.4 20.1 19.3<br />
Admin & office staff 17.3 17.3 18.8<br />
Managers 3.1 3.1 3.3<br />
TOTAL 40.8 40.5 41.4<br />
Since the integration of Supor in 2008, the percentage of direct manual labour has continued to increase.<br />
Excluding Supor, the percentage of managers has increased (+7.3%), especially for women: in <strong>2010</strong>, 33% of the Group’s managers were women, compared<br />
to 32% in 2009.<br />
28 FINANCIAL REPORT AND REGISTRATION DOCUMENT <strong>2010</strong> GROUPE SEB
1<br />
GROUPE SEB IN <strong>2010</strong><br />
SOCIAL PERFORMANCE INDICATORS<br />
COLLECTIVE AGREEMENTS<br />
(Worldwide)<br />
France<br />
Other Western<br />
European countries Central Europe North America South America Asia & Pacific Total<br />
<strong>2010</strong> 23 38 6 3 6 14 90<br />
2009 44 34 3 0 10 5 96<br />
A total of 90 collective agreements were signed in <strong>2010</strong>, 74% of which were international. The reduction in the number of agreements in France can be<br />
explained by the signature of consolidated agreements at Group level <strong>and</strong> not solely by the legal entity.<br />
1<br />
EXTERNAL LABOUR<br />
(Worldwide)<br />
Temporary staff at 31 December <strong>2010</strong> was equivalent to 567 full-time posts in France (2009: 481 posts) <strong>and</strong> 3,119 posts worldwide (2009: 2,434 posts).<br />
NB: In China, this type of contract does not exist.<br />
PAID OVERTIME<br />
(Worldwide)<br />
<strong>2010</strong>: In France, 49,969 hours, or 27 full time-equivalent (FTE) (2009:<br />
45,869 hours or 25 FTE).<br />
<strong>2010</strong>: worldwide excluding Supor, 420,028 hours, or 205 FTE (2009:<br />
273,076 hours or 135 FTE).<br />
<strong>2010</strong>: 5,429,380 hours for Supor, the Chinese subsidiary, or 2,610 FTE (2009:<br />
4,069,516 hours or 1,981 FTE). These figures are linked to the local context,<br />
with in particular, an increase in trading activity <strong>and</strong> tensions on the<br />
recruitment of labour in Eastern China in <strong>2010</strong>.<br />
WORKPLACE SAFETY: FREQUENCY AND SEVERITY<br />
(Worldwide excluding Supor)<br />
<strong>2010</strong> 2009 2008<br />
WORLDWIDE (EXCLUDING SUPOR)<br />
Number of workplace accidents with subsequent absence 149 169 182<br />
Number of days lost 6,742 6,841 9,281<br />
Frequency rate (a) 7.40 8.46 8.31<br />
Severity rate (b) 0.34 0.34 0.42<br />
FRANCE<br />
Number of workplace accidents with subsequent absence 105 118 110<br />
Number of days lost 5,864 5,772 6,803<br />
Frequency rate (a) 12.49 13.66 12.25<br />
Severity rate (b) 0.70 0.67 0.75<br />
(a) Number of workplace accidents with absence per million hours worked.<br />
(b) Number of days lost per thous<strong>and</strong> hours worked.<br />
The latter has been updated to reflect the reclassification of 2008 <strong>and</strong> 2009 data.<br />
The number of workplace accidents has decreased at most of the Group’s<br />
sites <strong>and</strong> the frequency rate is down worldwide. Severity rate is stable.<br />
As Supor’s data has not been consolidated for 2008 <strong>and</strong> 2009, it is not<br />
included in the table. For <strong>2010</strong>, worldwide including Supor, we obtain a<br />
frequency rate of 5.83 <strong>and</strong> a severity rate of 0.19.<br />
GROUPE SEB<br />
FINANCIAL REPORT AND REGISTRATION DOCUMENT <strong>2010</strong><br />
29
1 SOCIAL<br />
GROUPE SEB IN <strong>2010</strong><br />
PERFORMANCE INDICATORS<br />
TRAINING (STAFF AND TRAINING HOURS)<br />
(France)<br />
<strong>2010</strong> 2009 2008<br />
Number of training hours (a) 124,648 127,027 148,907<br />
Number of staff trained 3,679 3,946 4,346<br />
Of which women 1,436 1,656 1,865<br />
Of which men 2,243 2,290 2,481<br />
Number of employees trained in environmental protection 391 794 1,139<br />
Number of employees trained in workplace safety 2,213 2,039 2,615<br />
(a) Based on the number of employees trained multiplied by the number of training hours (including environment <strong>and</strong> safety training).<br />
The reduction in the number of training hours in France can be explained by<br />
the organization of more targeted training.<br />
Worldwide, excluding Supor, the Group’s employees received 225,029 hours<br />
of training (+17.4%) in <strong>2010</strong>.<br />
TRAINING BUDGET (a)<br />
(Worldwide excluding Supor)<br />
(as % of payroll) <strong>2010</strong> 2009 2008<br />
France 2.68 2.53 2.65<br />
Other Western European countries 1.00 0.49 1.78<br />
North America 0.90 0.52 1.16<br />
South America 1.58 1.16 2.12<br />
Asia/Pacific 2.06 1.29 2.36<br />
Central Europe, CIS <strong>and</strong> other countries 1.88 1.50 2.63<br />
TOTAL 2.08 1.85 2.38<br />
(a) Teaching cost + expenses, excluding wages for trainees <strong>and</strong> indirect labour.<br />
The uncertainty of the economic climate in 2009 had led to the restructuring of training expenditure. In <strong>2010</strong>, training gained momentum in all geographical regions.<br />
GROUPE SEB ACADEMY TRAINING<br />
(Worldwide excluding Supor)<br />
<strong>2010</strong> 2009 2008<br />
Number of trainees 1,540 1,456 2,226<br />
Number of training sessions 160 107 201<br />
Number of training hours (a) 36,700 19,186 33,777<br />
(a) Based on the number of people trained multiplied by the number of training hours per session.<br />
30 FINANCIAL REPORT AND REGISTRATION DOCUMENT <strong>2010</strong> GROUPE SEB
1<br />
GROUPE SEB IN <strong>2010</strong><br />
SOCIAL PERFORMANCE INDICATORS<br />
BONUSES AND PROFIT SHARING<br />
(Worldwide)<br />
(in € thous<strong>and</strong>s) <strong>2010</strong> 2009 2008<br />
Provision for bonuses 16,886 15,500 14,787<br />
Provision for profit-sharing 15,310 22,059 18,574<br />
TOTAL 32,196 37,559 33,361<br />
1<br />
Amounts paid in the year indicated in respect of the previous trading year.<br />
In 2011, the amount paid in bonuses <strong>and</strong> profit sharing will amount to €47.5 million.<br />
GROUPE SEB<br />
FINANCIAL REPORT AND REGISTRATION DOCUMENT <strong>2010</strong><br />
31
1 ENVIRONMENT<br />
GROUPE SEB IN <strong>2010</strong><br />
PERFORMANCE INDICATORS<br />
ENVIRONMENT PERFORMANCE<br />
INDICATORS<br />
<strong>Groupe</strong> SEB has worked for many years to improve the environmental<br />
performance of its factories <strong>and</strong> logistics platforms. The worldwide<br />
Environment Management System put in place in 2003 aims in particular<br />
to reduce waste <strong>and</strong> greenhouse gas emissions <strong>and</strong> limit the consumption<br />
of water <strong>and</strong> energy.<br />
The latest entities to join the Group progressively adopt an environmental<br />
certification approach that respects <strong>Groupe</strong> SEB st<strong>and</strong>ards. Today, 78% of<br />
the Group’s industrial <strong>and</strong> logistics entities are ISO 14001 certified, including<br />
head office (by convention), <strong>and</strong> Supor.<br />
Apart from its own production units, <strong>Groupe</strong> SEB ensures that its suppliers<br />
are also actively seeking environmental certification.<br />
ENERGY CONSUMPTION<br />
(Worldwide excluding Supor <strong>and</strong> All-Clad)<br />
<strong>2010</strong> 2009 2008<br />
World France World France World France<br />
Total consumption of gas<br />
(in GWh) 173.8 165.4 157.8 144.3 178.3 164.3<br />
Total consumption of electricity<br />
(in GWh) 159.1 107.2 148.4 99.1 168.6 115.5<br />
Total consumption of water<br />
(in thous<strong>and</strong>s of cubic meters) 1,002.1 846.9 1,026.0 859.4 1,178.4 968.7<br />
Direct energy consumption,<br />
broken down by primary<br />
source (gas + electricity)<br />
(in GWh) 332.9 272.6 306.2 243.4 346.9 279.8<br />
The increase in direct energy consumption (+8.7%) can be explained by the<br />
increase in production (+13.6%). However, the ratio of energy consumption<br />
to the quantity of manufactured finished products has fallen: gas = 1.92 kWh/<br />
FP (-3%); electricity = 1.76 kWh/FP (-6%); water = 11.09 litres/FP (-14%).<br />
GREENHOUSE GAS EMISSIONS<br />
PRODUCTION<br />
(Worldwide excluding Supor <strong>and</strong> All-Clad)<br />
(in tonnes of CO 2) <strong>2010</strong> 2009 2008<br />
Greenhouse gas emissions 34,318 30,320 33,961<br />
Following the 13.6% rise in the Group’s production, greenhouse gas<br />
emissions from industrial <strong>and</strong> logistics sites have gone up in absolute value<br />
compared to 2009, but have dropped by manufactured finished product:<br />
379.6 g in <strong>2010</strong> versus 381.2 g in 2009.<br />
32 FINANCIAL REPORT AND REGISTRATION DOCUMENT <strong>2010</strong> GROUPE SEB
1<br />
GROUPE SEB IN <strong>2010</strong><br />
ENVIRONMENT PERFORMANCE INDICATORS<br />
LOGISTICS<br />
(Worldwide)<br />
(in tonnes of CO 2) <strong>2010</strong> 2009<br />
Average value of CO 2 emissions 265,000 305,000<br />
Minimum estimate of CO 2 emissions 200,000 210,000<br />
Maximum estimate of CO 2 emissions 330,000 400,000<br />
A second carbon footprint for transport was calculated in <strong>2010</strong>.<br />
The calculation method was fine-tuned <strong>and</strong> the scope extended (worldwide,<br />
including Supor). This new assessment gives an estimate of an average<br />
of 265,000 tonnes of carbon missions linked to the transport of products,<br />
materials <strong>and</strong> components in <strong>2010</strong>. On a like-for-like basis, the recalculated<br />
emissions for 2009 represent an average of around 305,000 tonnes.<br />
Due to the complexity of the calculation, a portion of the emissions is still<br />
based on extrapolations. The minimum <strong>and</strong> maximum data expressed<br />
therefore represent an estimate range.<br />
1<br />
WASTE<br />
(Worldwide excluding Supor <strong>and</strong> All-Clad)<br />
<strong>2010</strong> 2009 2008<br />
World France World France World France<br />
Ordinary Industrial<br />
Waste (OIW) (tonnes) 12,828 8,532 11,110 7,682 12,357 8,874<br />
OIW recycled<br />
excluding metals (%) 81 82 79 82 80 83<br />
Special Industrial Waste (SIW)<br />
100% treated (tonnes) 2,121 1,472 1,476 943 1,555 960<br />
Water treatment plant sludge<br />
disposed of in class II<br />
l<strong>and</strong>fills (tonnes) 4,020 3,962 4,265* 4,169 5,708* 5,583<br />
* Updated to reflect data reclassification on certain international sites.<br />
Ordinary (or non hazardous) industrial waste has increased in France <strong>and</strong><br />
worldwide, due to the increase in production. Special industrial waste has<br />
also risen, especially in France, following the inclusion of asbestos waste<br />
removal from a site.<br />
ISO CERTIFICATION<br />
(Worldwide)<br />
(as a %) <strong>2010</strong> 2009 2008<br />
Entities holding ISO 14001 certification (a) 78 75 75<br />
(a) Based on industrial <strong>and</strong> logistics entities at the end of the year concerned (including Group head office).<br />
The Panex (Brazil) site was ISO 14001 certified at year end <strong>2010</strong>.<br />
The sites of Supor have been included since 2008 in the ISO 14001<br />
certification scope.<br />
NB: In this table, the three Supor sites holding environmental certification<br />
awarded by a Chinese organization are not considered as ISO 14001-certified<br />
under <strong>Groupe</strong> SEB terms. An action plan is underway to ensure that these<br />
sites progressively evolve to reach <strong>Groupe</strong> SEB st<strong>and</strong>ards.<br />
GROUPE SEB<br />
FINANCIAL REPORT AND REGISTRATION DOCUMENT <strong>2010</strong><br />
33
1 ENVIRONMENT<br />
GROUPE SEB IN <strong>2010</strong><br />
PERFORMANCE INDICATORS<br />
34 FINANCIAL REPORT AND REGISTRATION DOCUMENT <strong>2010</strong> GROUPE SEB
CORPORATE GOVERNANCE<br />
2<br />
CORPORATE<br />
GOVERNANCE<br />
BOARD OF DIRECTORS 36<br />
Chairman & CEO 36<br />
Board members 36<br />
Founder family connection 41<br />
Absence of convictions for fraud, involvement<br />
in bankruptcy or official public sanction 41<br />
Absence of potential conflict of interest 41<br />
Service contracts 41<br />
ORGANIZATION AND OPERATION<br />
OF THE BOARD OF DIRECTORS 42<br />
Operation of the Board of Directors 42<br />
Board of Directors’ Meetings 42<br />
Attendance fees 43<br />
Board of Directors’ Committees 43<br />
Evaluation of the Board of Directors 44<br />
Directors’ Charter <strong>and</strong> Internal Regulations<br />
of the Board of Directors 44<br />
Keeping Board members informed 44<br />
GROUP MANAGEMENT BODIES 45<br />
Group Executive Committee 45<br />
Continental General Management (structure) 45<br />
Strategic Business Areas (SBAs) management<br />
structure 45<br />
Other general managements 45<br />
Remuneration of management<br />
(Group Executive Committee) 46<br />
Remuneration of the Chief Executive Officer 46<br />
Share transactions carried out by<br />
members of SEB management during <strong>2010</strong><br />
(Article L. 621-18-2 of the French Monetary<br />
<strong>and</strong> <strong>Financial</strong> Code) 50<br />
CHAIRMAN’S REPORT<br />
ON INTERNAL CONTROL 51<br />
Group internal control environment 51<br />
Internal control participants 52<br />
Accounting <strong>and</strong> financial information procedures 54<br />
STATUTORY AUDITORS’ REPORT<br />
ON INTERNAL CONTROL 56<br />
Information on the internal control procedures<br />
relating to the preparation <strong>and</strong> processing<br />
of accounting <strong>and</strong> financial information 56<br />
Other disclosures 56<br />
STATUTORY AUDITORS 57<br />
Statutory auditors 57<br />
Substitute Statutory auditors 57<br />
Fees paid to Statutory auditors 58<br />
2<br />
GROUPE SEB<br />
FINANCIAL REPORT AND REGISTRATION DOCUMENT <strong>2010</strong><br />
35
2 BOARD<br />
CORPORATE GOVERNANCE<br />
OF DIRECTORS<br />
BOARD OF DIRECTORS<br />
FOUNDING CHAIRMEN<br />
Frédéric Lescure †<br />
Henri Lescure †<br />
HONORARY CHAIRMAN<br />
Emmanuel Lescure<br />
CHAIRMAN & CEO<br />
THIERRY DE LA TOUR D’ARTAISE<br />
First appointment: 1999 – Expiration of term: 2012.<br />
Aged 56.<br />
CEO of SEB S.A. since 2000.<br />
Entered <strong>Groupe</strong> SEB in 1994 when he joined Calor, of which he became<br />
Chairman <strong>and</strong> was appointed Deputy Chairman of SEB S.A. in 1999.<br />
Number of SEB shares held: 119,479 shares.<br />
Other current m<strong>and</strong>ates <strong>and</strong> functions:<br />
Board member of Club Méditerranée S.A., Plastic Omnium <strong>and</strong> Legr<strong>and</strong>,<br />
Permanent representative of Sofinaction, on the Board of Lyonnaise de Banque,<br />
M<strong>and</strong>ates in <strong>Groupe</strong> SEB companies: Chairman of SEB Internationale; Board<br />
member of Supor (China).<br />
Expired m<strong>and</strong>ates <strong>and</strong> functions held in the last five years (excluding <strong>Groupe</strong><br />
SEB companies):<br />
Board member of Siparex Associés.<br />
BOARD MEMBERS<br />
TRISTAN BOITEUX<br />
Member of the Founder Group, member of FÉDÉRACTIVE.<br />
First appointment: 2002 – Expiration of term: 2014.<br />
Aged 48.<br />
Having occupied various functions in Alcatel for 11 years, he has been<br />
with Gemalto since November 2000 where, before being appointed<br />
Product Manager, he held the post of Commercial Engineer.<br />
Number of SEB shares held: 102,625 (of which 99,610 bare-owner<br />
shares).<br />
Other current m<strong>and</strong>ates <strong>and</strong> functions:<br />
Member of the Advisory Board of FÉDÉRACTIVE,<br />
Member of the Management Board of the Mireille <strong>and</strong> Pierre L<strong>and</strong>rieu<br />
Foundation.<br />
Expired m<strong>and</strong>ates <strong>and</strong> functions held in the last five years:<br />
None<br />
DAMARYS BRAIDA<br />
Member of the Founder Group, member of VENELLE INVESTISSEMENT.<br />
First appointment: 2001 – Expiration of term: 2013.<br />
Aged 43.<br />
Ms Braida joined L’Oréal in 1991 as head of its Hair R&D Assets<br />
department, subsequently developing effectiveness tests <strong>and</strong>,<br />
from <strong>2010</strong>, directing the Luxury Division’s Colour Laboratories.<br />
Number of SEB shares held: 187,194 (of which 173,243 bare-owner<br />
shares).<br />
Other current m<strong>and</strong>ates <strong>and</strong> functions:<br />
Chairperson of VENELLE INVESTISSEMENT,<br />
Managing Director of VENELLE PLUS.<br />
Other m<strong>and</strong>ates <strong>and</strong> functions held in the last five years:<br />
Member of the Management Board of VENELLE INVESTISSEMENT.<br />
36 FINANCIAL REPORT AND REGISTRATION DOCUMENT <strong>2010</strong> GROUPE SEB
2<br />
CORPORATE GOVERNANCE<br />
BOARD OF DIRECTORS<br />
NORBERT DENTRESSANGLE<br />
Independent director.<br />
First appointment: 2002 – Expiration of term: 2014.<br />
Aged 56.<br />
In 1979, he founded the Norbert Dentressangle Group, specialised in<br />
transport <strong>and</strong> logistics – of which he was Chairman until 1998, <strong>and</strong><br />
is now chair of its Supervisory Board. Since its creation in 1988, he<br />
has also been Chairman of Financière Norbert Dentressangle (S.A.S.),<br />
a family holding company which, in addition to a majority stake in<br />
Norbert Dentressangle S.A., holds equity interests in real estate,<br />
industrial <strong>and</strong> business services companies.<br />
Number of SEB shares held: 4,950 shares.<br />
Other current m<strong>and</strong>ates <strong>and</strong> functions:<br />
Chairman of Financiere de Cuzieu (S.A.S.),<br />
Chairman of Financiere Norbert Dentressangle (S.A.S.),<br />
Chairman of the Supervisory Board of Norbert Dentressangle S.A.,<br />
Chairman of ND Investissements (S.A.S),<br />
Managing Director of Sofade (S.A.S),<br />
Co-manager of Versailles Richaud ND (SARL),<br />
Member of the Supervisory Board of HDL (S.C.A.),<br />
Member <strong>and</strong> Vice-Chairman of the Board of AXA,<br />
Board member of Sogebail.<br />
Other appointments <strong>and</strong> duties held in the last 5 years:<br />
Member of the Supervisory Board of FINAIXAM,<br />
Permanent representative of Financière Norbert Dentressangle, Board member<br />
of Financière Egnatia.<br />
2<br />
FÉDÉRACTIVE<br />
Member of the Founder Group.<br />
First appointment: 2005 (co-opted by the Board Meeting of<br />
16 December 2005) – Expiration of term: 2014.<br />
Shareholder investment company.<br />
FÉDÉRACTIVE is represented by its Chairman, Pascal Girardot.<br />
Pascal Girardot, aged 55, is a member of the French Institute of<br />
Actuaries. After 15 years in financial markets <strong>and</strong> financial engineering<br />
with the Caisse des Dépôts et Consignations as <strong>Financial</strong> Markets<br />
Manager, <strong>and</strong> with CPR as Risk Manager responsible for its New York<br />
operations, he has been, since 1997, Founder-Chairman of Certual,<br />
specialized in financial engineering.<br />
Former Chairman of the Obligatory St<strong>and</strong>ards committee consulted<br />
by the Treasury department.<br />
Number of SEB shares held by FÉDÉRACTIVE: 10,225,760 shares (of<br />
which 10,225,757 are nominee shares held as beneficiary).<br />
Other current m<strong>and</strong>ates <strong>and</strong> functions:<br />
Board member of Gaggione S.A., Babylone S.A., NewCore S.A. <strong>and</strong><br />
Tugak S.A.S.<br />
Expired m<strong>and</strong>ates <strong>and</strong> functions held by FÉDÉRACTIVE in the last five years:<br />
None.<br />
HUBERT FÈVRE<br />
Member of the Founder Group, member of FÉDÉRACTIVE.<br />
First appointment: 2003 – Expiration of term: 2011 (1) .<br />
Aged 46.<br />
Chartered accountant.<br />
Based in Geneva, he is <strong>Financial</strong> Officer for Pasche Bank.<br />
Previously, in London, he held financial positions with the following<br />
groups: Sonatrach Petroleum Corporation, VSNL International,<br />
Addax & Oryx <strong>and</strong> Finacor.<br />
Number of SEB shares held: 543,280 (of which 533,380 bare-owner<br />
shares).<br />
Other current m<strong>and</strong>ates <strong>and</strong> functions:<br />
Member of the Advisory Board of FÉDÉRACTIVE.<br />
Expired m<strong>and</strong>ates <strong>and</strong> functions held in the last five years:<br />
Member of the Management Board of VENELLE INVESTISSEMENT.<br />
(1) Motion for renewal submitted to the AGM on 17 May 2011.<br />
GROUPE SEB<br />
FINANCIAL REPORT AND REGISTRATION DOCUMENT <strong>2010</strong><br />
37
2 BOARD<br />
CORPORATE GOVERNANCE<br />
OF DIRECTORS<br />
SOCIÉTÉ FONCIÈRE, FINANCIÈRE ET DE PARTICIPATIONS – FFP<br />
First appointment: 2005 – Expiration of term: 2013.<br />
Foncière, Financière et de Participations – FFP, is a holding<br />
company listed on the Paris stock exchange, <strong>and</strong> majority-owned<br />
by the Peugeot family group.<br />
FFP is represented by Christian Peugeot.<br />
An HEC graduate, Christian Peugeot, aged 57, has spent his whole<br />
career with <strong>Groupe</strong> PSA. He is currently Central Director of Marketing<br />
for <strong>Groupe</strong> PSA.<br />
Number of SEB shares held by FFP: 2,521,522 shares.<br />
Other current m<strong>and</strong>ates <strong>and</strong> functions:<br />
Member of the Supervisory Board of IDI,<br />
Member of the Supervisory Board of Zodiac Aerospace,<br />
Member of the Supervisory Board of Onet,<br />
Chairman of Financière Guiraud, Manager of FFP-Les Grésillons,<br />
Managing Officer of Valmy-FFP.<br />
Other appointments <strong>and</strong> duties held by FFP in the last 5 years <strong>and</strong> now<br />
expired:<br />
Board member of Marco Polo Investments,<br />
Manager of Marne-FFP.<br />
JACQUES GAIRARD<br />
Member of the Founder Group, member of VENELLE INVESTISSEMENT.<br />
First appointment: 1976 – Expiration of term: 2011 (1) .<br />
Aged 71.<br />
Joined <strong>Groupe</strong> SEB in 1967. He was appointed Managing Director of<br />
SEB S.A. in 1976, Deputy Chairman in 1988, <strong>and</strong> Chairman <strong>and</strong> Chief<br />
Executive Officer from 1990 to 2000.<br />
Number of SEB shares held: 100,650 shares.<br />
Other current m<strong>and</strong>ates <strong>and</strong> functions:<br />
Member of the Supervisory Board of Soparind SCA,<br />
Board member of Maison Rouge contemporary art foundation,<br />
Member of the Management Board of VENELLE INVESTISSEMENT.<br />
Expired m<strong>and</strong>ates <strong>and</strong> functions held in the last five years:<br />
Member of the Supervisory Board of Siparex Associés,<br />
Member of the Supervisory Board of <strong>Groupe</strong> Norbert Dentressangle,<br />
Board member of Bongrain S.A.<br />
JEAN-NOËL LABROUE<br />
Independent director.<br />
First appointment: <strong>2010</strong> – Expiration of term: 2014.<br />
Aged 63.<br />
Has spent almost all his career in <strong>Groupe</strong> Darty, successively holding<br />
the positions of Chairman of the Board of <strong>Groupe</strong> Darty, Managing<br />
Director of Kingfisher Electricals UK <strong>and</strong> Managing Director of Kesa<br />
Electricals UK until 2009.<br />
Jean-Noël Labroue is an engineer by training, <strong>and</strong> holds a Master of<br />
Science degree from Northwestern University Chicago.<br />
Number of SEB shares held: 800 shares.<br />
Other current m<strong>and</strong>ates <strong>and</strong> functions:<br />
None.<br />
Expired m<strong>and</strong>ates <strong>and</strong> functions held in the last five years:<br />
Managing Director <strong>and</strong> Board member of Kesa Electricals Plc UK,<br />
Member of the Supervisory Board of Établissements Darty et Fils,<br />
Chief Executive Officer of Kesa France,<br />
Chairman of the Board of Directors of New V<strong>and</strong>en Borre <strong>and</strong> Kesa International Plc,<br />
Board member of Datart Investments S.A., Datart Megastore S.R.O. Datart<br />
International as, Kesa Holding Ltd, Kesa Electricals Plc, Kesa Sourcing Ltd,<br />
Kesa Spain Ltd, Kesa Turquey Ltd, Kesa Electricals Asia Ltd.<br />
PHILIPPE LENAIN<br />
Independent director.<br />
First appointment: 2000 – Expiration of term: 2012.<br />
Aged 74.<br />
Former Deputy Chairman, Managing Director <strong>and</strong> Board member<br />
of the Danone Group.<br />
Number of SEB shares held: 1,650 shares.<br />
Other current m<strong>and</strong>ates <strong>and</strong> functions:<br />
None.<br />
Expired m<strong>and</strong>ates <strong>and</strong> functions held in the last five years:<br />
Board member of Carlson Wagons Lits France, Nord Est <strong>and</strong> Eco-Emballages.<br />
(1) Motion for renewal submitted to the AGM on 17 May 2011.<br />
38 FINANCIAL REPORT AND REGISTRATION DOCUMENT <strong>2010</strong> GROUPE SEB
2<br />
CORPORATE GOVERNANCE<br />
BOARD OF DIRECTORS<br />
CÉDRIC LESCURE<br />
Member of the Founder Group, member of FÉDÉRACTIVE.<br />
First appointment: 1998.<br />
Expiration of term: 2011 (1) .<br />
Aged 43.<br />
Veterinary surgeon.<br />
Number of SEB shares held: 529,039 (of which 511,258 bare-owner<br />
shares).<br />
Other current m<strong>and</strong>ates <strong>and</strong> functions:<br />
Manager of Sarl Rallye Charmoy,<br />
Manager of Sarl Vetshop Création,<br />
Member of the Advisory Board of S.A.S. FÉDÉRACTIVE.<br />
Expired m<strong>and</strong>ates <strong>and</strong> functions held in the last five years:<br />
Manager of <strong>Groupe</strong> Forestier La Pépine.<br />
FRÉDÉRIC LESCURE<br />
Member of the Founder Group, member of FÉDÉRACTIVE.<br />
First appointment: 2005 – Expiration of term: 2013.<br />
Aged 50.<br />
A graduate of CESEM then Harvard University, Fréderic Lescure is<br />
Chairman of <strong>Groupe</strong> Méaban, specialized in surface treatment.<br />
Number of SEB shares held: 46,148 (of which 39,464 bare-owner<br />
shares).<br />
Other current m<strong>and</strong>ates <strong>and</strong> functions:<br />
Member of the Board of Magchem (Canada) <strong>and</strong> Dysol (Fort Worth, Texas),<br />
Chairman of Socomore GmbH (Germany), Socomore S.A. (Spain) <strong>and</strong> Socomore<br />
Ltd (Engl<strong>and</strong>), Socomore Shanghai Ltd (China), Socomore OOO (CIS) <strong>and</strong><br />
Socomore Ltd (Hong Kong) <strong>and</strong> of <strong>Groupe</strong>ment des Fédérations Industrielles<br />
Bretagne.<br />
Expired m<strong>and</strong>ates <strong>and</strong> functions held in the last five years:<br />
Board member of CBB Développement.<br />
2<br />
JEAN-DOMINIQUE SENARD<br />
Independent director.<br />
First appointment: 2009 – Expiration of term: 2013.<br />
Aged 58.<br />
Jean-Dominique Senard began his career in various posts of<br />
responsibility in finance <strong>and</strong> operations with <strong>Groupe</strong> Total,<br />
from September 1979 to September 1987, <strong>and</strong> then with Saint Gobain<br />
from 1987 to 1996.<br />
From September 1996 to March 2001, he was Chief <strong>Financial</strong> Officer<br />
<strong>and</strong> a member of the <strong>Groupe</strong> Péchiney Executive Committee. He later<br />
became head of Péchiney’s Primary Aluminium Division until 2004.<br />
As a member of Alcan’s Executive Committee, he was responsible for<br />
the integration of Péchiney, <strong>and</strong> served as Chairman of Péchiney S.A.<br />
Jean-Dominique Senard joined Michelin in March 2005 as Chief<br />
<strong>Financial</strong> Officer <strong>and</strong> a member of Michelin’s Executive Council.<br />
In May 2007, he became a Managing Partner of <strong>Groupe</strong> Michelin.<br />
Number of SEB shares held: 2,000 shares.<br />
Other current m<strong>and</strong>ates <strong>and</strong> functions:<br />
None.<br />
Expired m<strong>and</strong>ates <strong>and</strong> functions held in the last five years:<br />
None.<br />
(1) Motion for renewal submitted to the AGM on 17 May 2011.<br />
GROUPE SEB<br />
FINANCIAL REPORT AND REGISTRATION DOCUMENT <strong>2010</strong><br />
39
2 BOARD<br />
CORPORATE GOVERNANCE<br />
OF DIRECTORS<br />
VENELLE INVESTISSEMENT<br />
Member of the Founder Group.<br />
First appointment: 1998 – Expiration of term: 2012.<br />
VENELLE INVESTISSEMENT, a family shareholder company, is<br />
represented by Olivier Roclore.<br />
Following six years with CAD software company Cisigraph as Head<br />
of Legal <strong>and</strong> Tax Affairs, Olivier Roclore, aged 56, has been Head of<br />
<strong>Groupe</strong> Ortec’s Legal <strong>and</strong> Tax department since 1992.<br />
Number of SEB shares held by VENELLE INVESTISSEMENT:<br />
7,461,243 (of which 7,443,341 usufruct shares).<br />
Other current m<strong>and</strong>ates <strong>and</strong> functions:<br />
Chair of the Management Board of VENELLE INVESTISSEMENT,<br />
Member of the Management Committee of Generale de Dépollution S.A.S.<br />
Joint Managing Officer of Quincaillerie Industrielle Berroise SARL.<br />
Expired m<strong>and</strong>ates <strong>and</strong> functions held in the last five years:<br />
None.<br />
JÉRÔME WITTLIN<br />
Member of the Founder Group, member of VENELLE INVESTISSEMENT.<br />
First appointment: 2004 – Expiration of term: 2012.<br />
Aged 51.<br />
Jérôme Wittlin began his career with <strong>Groupe</strong> Crédit Lyonnais, notably<br />
as director of Clinvest (a subsidiary specialized in mergers <strong>and</strong><br />
acquisitions), <strong>and</strong> from 2004 was Executive Director of the Investment<br />
Banking department of Calyon, a financial <strong>and</strong> investment bank in<br />
the Crédit Agricole group.<br />
Until 2009, he was Executive Director of the Private Wealth<br />
Management Division of Goldman Sachs in France.<br />
Number of SEB shares held: 6,338 (of which 330 bare-owner shares).<br />
Other current m<strong>and</strong>ates <strong>and</strong> functions:<br />
Managing Director of VENELLE INVESTISSEMENT,<br />
Manager of Trois Rivières Holding,<br />
Board member of Trajectoire.<br />
Other m<strong>and</strong>ates <strong>and</strong> functions held in the last five years:<br />
Member of the Management Board of VENELLE INVESTISSEMENT.<br />
At 31 December <strong>2010</strong>, Board members held 43.75% of the Company’s share capital <strong>and</strong> 57.51% of its voting rights.<br />
Each Board member is required to hold a minimum number of shares in the SEB S.A. nominal share register equivalent to about two years of attendance fees.<br />
40 FINANCIAL REPORT AND REGISTRATION DOCUMENT <strong>2010</strong> GROUPE SEB
2<br />
CORPORATE GOVERNANCE<br />
BOARD OF DIRECTORS<br />
FOUNDER FAMILY CONNECTION<br />
All Board members belonging to the Founder Group are descendants,<br />
directly or by marriage, of Founder-Chairmen Frédéric Lescure <strong>and</strong><br />
Henri Lescure.<br />
There is no family connection between Board members <strong>and</strong> members<br />
of the Group Executive Committee, with the exception of Thierry de<br />
La Tour d’Artaise, who is a member of the Founder Group.<br />
ABSENCE OF CONVICTIONS OF FRAUD, INVOLVEMENT<br />
IN BANKRUPTCY OR OFFICIAL PUBLIC SANCTION<br />
To the Company’s knowledge:<br />
no member of the Board of Directors or Group Executive Committee has<br />
been convicted of fraud in the last five years;<br />
no member of the Board of Directors or Group Executive Committee has<br />
been the subject of a bankruptcy, strike-off notice or liquidation in the<br />
last five years;<br />
no member of the Board of Directors or Group Executive Committee<br />
has been the subject of any offi cial charge or sanction by statutory or<br />
regulatory authorities;<br />
no member of the Board of Directors or Group Executive Committee has<br />
been in the last five years subject to any court order or restriction from<br />
serving as a member of a Management Board, Board of Directors or<br />
Supervisory Board, or from being involved in the management or affairs<br />
of an issuer of securities.<br />
2<br />
ABSENCE OF POTENTIAL CONFLICT OF INTEREST<br />
As far as the Company is aware, there is no potential conflict between their duties with regard to SEB S.A., <strong>and</strong> the individual interests of any member of<br />
the Board or general management.<br />
SERVICE CONTRACTS<br />
No member of the Board of Directors or Group Executive Committee has any contractual service relationship with SEB S.A. or its subsidiaries, the terms of<br />
which would bestow advantages on the member.<br />
GROUPE SEB<br />
FINANCIAL REPORT AND REGISTRATION DOCUMENT <strong>2010</strong><br />
41
2 ORGANIZATION<br />
CORPORATE GOVERNANCE<br />
AND OPERATION OF THE BOARD OF DIRECTORS<br />
ORGANIZATION AND OPERATION<br />
OF THE BOARD OF DIRECTORS<br />
The activities of the Group’s governing <strong>and</strong> management bodies are<br />
compliant with corporate governance rules generally applied by French<br />
companies whose shares are traded on a regulated market.<br />
<strong>Groupe</strong> SEB complies with the AFEP-MEDEF Corporate Governance Code<br />
for listed companies, issued in December 2008.<br />
OPERATION OF THE BOARD OF DIRECTORS<br />
The Board of Directors is a collective body which represents all the<br />
shareholders <strong>and</strong> acts solely in the interests of the Company.<br />
On the proposal of the Chairman <strong>and</strong> Chief Executive Offi cer, the Board<br />
of Directors decides on Group strategy, capital expenditure <strong>and</strong> budgets,<br />
deliberates on the management structures of the Group <strong>and</strong> decides on<br />
acquisitions.<br />
The Board of Directors has made it an internal rule that, in view of their<br />
importance, decisions on the cancellation of shares or the possible use of<br />
General Meeting authorizations to increase capital should be subject to a<br />
qualified majority vote of 12/15ths of the members present or represented.<br />
The Board of Directors comprises 15 members:<br />
the Chairman,<br />
nine Board members representing the Founder Group: five Board<br />
members are proposed by FÉDÉRACTIVE <strong>and</strong> four by VENELLE<br />
INVESTISSEMENT,<br />
the company FFP,<br />
four independent directors.<br />
In light of the fact that the capital is controlled by two major shareholders, the<br />
Board of Directors has slightly less than one third of independent members,<br />
as recommended by the AFEP-MEDEF Corporate Governance Code.<br />
To be considered independent, a director must have no relationship with<br />
the Company, the Group or its management, which could compromise the<br />
impartiality of the director’s judgment (AFEP-MEDEF Code definition).<br />
After examining the Board member situation, the Board considered that<br />
Norbert Dentressangle, Jean-Noël Labroue, Philippe Lenain <strong>and</strong> Jean-<br />
Dominique Senard are independent directors as defined by the AFEP-MEDEF<br />
Code.<br />
Although FFP holds 5.05% of the capital, namely less than 10% of the<br />
capital (percentage from which the Board should start questioning the<br />
independence of Board members), the Board considered that at this level<br />
of investment, FFP could not be completely independent.<br />
The term of office of Board members is four years.<br />
Board membership is renewed by rotation, so that shareholders can have<br />
a more frequent influence on the makeup of the Board.<br />
In June 2002, the Board of Directors confirmed the unitary organization of<br />
the Company’s management authority. The Chairman, Thierry de La Tour<br />
d’Artaise, therefore assumes the function of Chief Executive Officer. This<br />
choice is based on reasons of efficiency.<br />
The Board of Directors did not restrict the authority of the Chief Executive<br />
Officer.<br />
BOARD OF DIRECTORS’ MEETINGS<br />
The Board of Directors met on seven occasions in <strong>2010</strong>. Average attendance<br />
was 89.5%.<br />
The Board of Directors has met on several occasions in recent years at<br />
<strong>Groupe</strong> SEB sites outside France – for example in Italy in 2006 <strong>and</strong> Portugal<br />
in 2008.<br />
These occasions enable Board members to meet personnel in the<br />
subsidiaries <strong>and</strong> better underst<strong>and</strong> local problems in their context.<br />
42 FINANCIAL REPORT AND REGISTRATION DOCUMENT <strong>2010</strong> GROUPE SEB
2<br />
CORPORATE GOVERNANCE<br />
ORGANIZATION AND OPERATION OF THE BOARD OF DIRECTORS<br />
ATTENDANCE FEES<br />
The maximum amount of attendance fees authorized by the 2007 Annual<br />
General Meeting is €420,000.<br />
Each Board member receives annual pay of €24,000.<br />
Members participating in the work of the Board Committees receive an<br />
additional €8,000 or, in the case of Committee Chairmen, €12,000.<br />
Due to the high attendance rate for Board <strong>and</strong> Committee Meetings, it was<br />
not considered necessary to introduce a variable portion of annual pay based<br />
on attendance.<br />
The total amount of attendance fees allocated to Board members in <strong>2010</strong><br />
amounted to €416,200.<br />
This represents attendance fees due for the period from 1 May 2009 to<br />
30 April <strong>2010</strong>, <strong>and</strong> paid in May <strong>2010</strong>.<br />
BOARD OF DIRECTORS’ COMMITTEES<br />
To assist it in specialist matters, the Board formed two committees in 1995,<br />
drawn from its members:<br />
Since 11 December 2009, the Audit Committee comprises four members:<br />
Philippe Lenain, Chairman, Norbert Dentressangle, Hubert Fèvre<br />
representing FÉDÉRACTIVE <strong>and</strong> Jérôme Wittlin representing VENELLE<br />
INVESTISSEMENT. Each member has financial or accounting skills.<br />
The Chairman of the committee is an independent director <strong>and</strong> has a<br />
deciding vote in the event of a split vote.<br />
This committee informs the Board on the identification, evaluation <strong>and</strong><br />
h<strong>and</strong>ling of the main financial risks to which the Group may be exposed.<br />
Its role is to ensure the conformity of financial reporting methods. It assists<br />
the Board with observations or recommendations <strong>and</strong> participates in the<br />
preparatory procedure for appointing Statutory auditors.<br />
The Audit Committee is held in the presence of the Statutory auditors,<br />
the Executive Vice-president, Finance, the Director of Internal Audit <strong>and</strong><br />
the Director of Accounts.<br />
The accounts review is accompanied by a presentation to the Statutory<br />
auditors stressing the salient points, not only of earnings but also of<br />
selected accounting options as well as a presentation describing exposure<br />
to risks <strong>and</strong> significant off-balance sheet commitments.<br />
Audit Committee activity<br />
The Audit Committee met on four occasions in <strong>2010</strong> with an attendance<br />
rate of 82%.<br />
In <strong>2010</strong>, the Audit Committee examined the following recurring items:<br />
the draft annual accounts as at 31/12/2009 <strong>and</strong> the draft half-year<br />
accounts as at 30/06/<strong>2010</strong>, prior to their submission to the Board of<br />
Directors,<br />
the Chairman’s report on internal control,<br />
the nature <strong>and</strong> results of the work done by the Statutory auditors along<br />
with their comments <strong>and</strong> recommendations on internal control,<br />
a review of the main findings of the internal audits carried out in <strong>2010</strong>,<br />
proposed internal audit schedules for 2011,<br />
a review <strong>and</strong> analysis of major risks.<br />
In <strong>2010</strong>, the Director of Audit made a general presentation to the Audit<br />
Committee on the various components of internal control <strong>and</strong> its organisation.<br />
Since 11 December 2009, the Nominations <strong>and</strong> Remuneration<br />
Committee comprises four members: Jean-Noël Labroue (since<br />
17 December <strong>2010</strong>, to replace Jean-Dominique Senard), Chairman,<br />
Philippe Lenain, Pascal Girardot representing FÉDÉRACTIVE <strong>and</strong> Olivier<br />
Roclore representing VENELLE INVESTISSEMENT.<br />
The Chairman of the committee is an independent director <strong>and</strong> has a<br />
deciding vote in the event of a split vote.<br />
The committee reports on its work to the Board of Directors <strong>and</strong> makes<br />
recommendations on the composition of the Board, on the terms of office<br />
of directors, <strong>and</strong> on the Group’s organization <strong>and</strong> structures; it also makes<br />
proposals to the Board concerning the executive offi cer remuneration<br />
policy, as well as the introduction of stock option plans <strong>and</strong> performance<br />
shares <strong>and</strong> their applicable terms <strong>and</strong> conditions.<br />
The Nominations <strong>and</strong> Remuneration Committee met on four occasions in<br />
<strong>2010</strong>, with a 100% attendance rate.<br />
Nominations <strong>and</strong> Remuneration Committee activity<br />
The Nominations <strong>and</strong> Remuneration Committee addressed the following<br />
matters in <strong>2010</strong>:<br />
review of a stock option <strong>and</strong> performance shares plan for certain<br />
members of Group management,<br />
examination of the 2009 bonus <strong>and</strong> <strong>2010</strong> fixed remuneration for the<br />
Chairman <strong>and</strong> other members of the Group Executive Committee,<br />
analysis of the make-up of the Board of Directors <strong>and</strong> of the Nominations<br />
<strong>and</strong> Remuneration Committee,<br />
examination of the Human Resources annual review which specifically<br />
pertains to movements that occurred in <strong>2010</strong>, succession plans of key<br />
positions, as well as major training projects.<br />
All issues addressed by the Audit Committee <strong>and</strong> the Nominations <strong>and</strong><br />
Remuneration Committee are noted in a report to the Board of Directors.<br />
The Group was unable to fully comply with the provisions of the AFEP-MEDEF<br />
Code which recommend two-thirds independent directors on the Audit<br />
Committee <strong>and</strong> a majority of independent directors on the Nominations<br />
<strong>and</strong> Remuneration Committee, due to the fact that it is controlled by two<br />
major shareholder groups.<br />
2<br />
GROUPE SEB<br />
FINANCIAL REPORT AND REGISTRATION DOCUMENT <strong>2010</strong><br />
43
2 ORGANIZATION<br />
CORPORATE GOVERNANCE<br />
AND OPERATION OF THE BOARD OF DIRECTORS<br />
EVALUATION OF THE BOARD OF DIRECTORS<br />
For the seventh time, the Board of Directors evaluated its operation in <strong>2010</strong>.<br />
The evaluation was based on a detailed questionnaire given to each Board<br />
member. This questionnaire was subdivided into seven sections:<br />
preparation of the Board;<br />
operation of the Board;<br />
committees;<br />
remuneration of Board members;<br />
makeup of the Board;<br />
keeping Board members informed;<br />
governance.<br />
The Board of Directors considered that overall, the Board’s operation was<br />
very satisfactory, as most of the improvements proposed during the previous<br />
evaluations had been implemented.<br />
Board members are particularly satisfi ed with the quality <strong>and</strong> quantity of<br />
information provided to them to carry out their task; they appreciate the<br />
introduction in 2006 of a special site for directors which featured an upload<br />
of all the documents they require.<br />
The suggestions made by the Board members include the wish to be able<br />
to meet not only the Executive Committee officers which has been the case<br />
for several years now but also the Directors of Support Functions.<br />
DIRECTORS’ CHARTER AND INTERNAL REGULATIONS<br />
OF THE BOARD OF DIRECTORS<br />
In 2003, the Board of Directors defi ned a Directors’ Charter <strong>and</strong> its Internal<br />
Rules, compiled in a single document.<br />
conflicts of interest, access to information, confidentiality, objective analysis,<br />
<strong>and</strong> vigilance with regard to the regulations governing privileged information.<br />
DIRECTORS’ CHARTER<br />
This Charter was drawn up to ensure that Board members have a clear<br />
underst<strong>and</strong>ing of their roles, rights <strong>and</strong> duties.<br />
The main points of the Charter cover: respect for <strong>and</strong> defence of the interests<br />
of the Company, regular attendance at meetings, attention to possible<br />
INTERNAL REGULATIONS<br />
The Internal Regulations cover the makeup <strong>and</strong> functioning of the Board,<br />
the role <strong>and</strong> mission of the Board <strong>and</strong> its committees <strong>and</strong> Board member<br />
remuneration policy.<br />
KEEPING BOARD MEMBERS INFORMED<br />
When a new member is appointed to the Board, he or she is given a dossier<br />
containing comprehensive information on the Group <strong>and</strong> its working context.<br />
This includes the Company bylaws, the Directors’ Charter <strong>and</strong> Internal<br />
Regulations, a draft agenda of each meeting of the Board <strong>and</strong> its committees,<br />
data on its factories <strong>and</strong> marketing facilities, human resources policy, a<br />
breakdown of employees by continent <strong>and</strong> by subsidiary company, br<strong>and</strong><br />
strategy, information on competition, <strong>and</strong> a review of our main clients.<br />
Also, each Board member periodically receives data concerning monthly<br />
sales fi gures <strong>and</strong> results, press reviews, minutes of the meetings of the<br />
Board of Directors <strong>and</strong> of the Audit <strong>and</strong> Nominations <strong>and</strong> Remuneration<br />
Committees, as well as the results of studies published by financial analysts<br />
concerning the Group.<br />
In 2006, a documentary database for SEB directors was made available<br />
via a secure link on the Internet. This database contains an upload of all<br />
the above documents <strong>and</strong> any other information that may be useful to the<br />
directors for completing their task.<br />
44 FINANCIAL REPORT AND REGISTRATION DOCUMENT <strong>2010</strong> GROUPE SEB
2<br />
CORPORATE GOVERNANCE<br />
GROUP MANAGEMENT BODIES<br />
GROUP MANAGEMENT BODIES<br />
GROUP EXECUTIVE COMMITTEE<br />
Thierry de La Tour d’Artaise<br />
Jean-Pierre Lac<br />
Stéphane Laflèche<br />
Bertr<strong>and</strong> Neuschw<strong>and</strong>er<br />
Harry Touret<br />
Frédéric Verwaerde<br />
Chairman & CEO<br />
Senior Executive Vice-president, Finance<br />
Senior Executive Vice-president, Industrial Operations<br />
Senior Executive Vice-president, Activities<br />
Senior Executive Vice-president, Human Resources<br />
Senior Executive Vice-president, Continental Structures<br />
2<br />
CONTINENTAL GENERAL MANAGEMENT<br />
Luc Gaudemard<br />
Volker Lixfeld<br />
Patrick Llobregat<br />
Gérard Salommez<br />
Fern<strong>and</strong>o Soares<br />
President, Western Europe<br />
President, North America<br />
President, Eastern Hemisphere<br />
President, France, Dom Tom <strong>and</strong> Belgium<br />
President, South America<br />
STRATEGIC BUSINESS AREAS (SBAS) MANAGEMENT<br />
Cyril Buxtorf<br />
Philippe Crevoisier<br />
Christian Ringuet<br />
President, Home care & Personal care<br />
President, Kitchen Electrics<br />
President, Cookware<br />
OTHER GENERAL MANAGERS<br />
Patrick Le Corre<br />
Jean-Christophe Simon<br />
President, Strategy<br />
President, Innovation<br />
The Group Executive Committee defines <strong>and</strong> implements overall Group<br />
strategy. It meets twice a month to defi ne consolidated goals, monitor<br />
strategic plans, decide on priorities <strong>and</strong> allocate the resources needed for<br />
Strategic Business Areas, Continental General Management <strong>and</strong> Other<br />
General Managers.<br />
The Group Management Board comprises the members of the Group<br />
Executive Committee, the Presidents of the Strategic Business Areas <strong>and</strong><br />
Continental Structures, the President in charge of Strategy <strong>and</strong> the President<br />
in charge of Innovation. It meets on average every two months to monitor the<br />
Group’s performance <strong>and</strong> results, <strong>and</strong> if necessary, to adjust its commercial<br />
or industrial strategy.<br />
A forum for exchanging views <strong>and</strong> reflection, the Group Management<br />
Board plays a supervisory role <strong>and</strong> ensures the proper overall functioning<br />
of <strong>Groupe</strong> SEB.<br />
GROUPE SEB<br />
FINANCIAL REPORT AND REGISTRATION DOCUMENT <strong>2010</strong><br />
45
2 GROUP<br />
CORPORATE GOVERNANCE<br />
MANAGEMENT BODIES<br />
REMUNERATION OF MANAGEMENT (GROUP EXECUTIVE COMMITTEE)<br />
Following the recommendations of the Nominations <strong>and</strong> Remuneration<br />
Committee, the Board of Directors has laid down the following management<br />
remuneration policy:<br />
fi xed remuneration is determined by taking into account the level of<br />
responsibility, experience in the management function <strong>and</strong> market<br />
practices;<br />
the short-term variable component depends on the Group’s performance<br />
<strong>and</strong> the individual performance of each senior executive according to<br />
pre-established criteria set annually by the Board of Directors. It may<br />
represent anywhere from 0 to 175% of the basic fixed remuneration for<br />
the Chief Executive Officer <strong>and</strong> from 0 to 100% for the other members of<br />
the Group Executive Committee;<br />
the long-term variable component (in the form of stock-options <strong>and</strong><br />
performance shares) with the aim of involving them in the long-term<br />
development of the Company’s value.<br />
On these principles, the committee proposes to the Board of Directors the<br />
fixed amount of remuneration for each executive officer, <strong>and</strong> the performance<br />
conditions for the variable component.<br />
In <strong>2010</strong>, remuneration of the current members of the Group Executive<br />
Committee amounted to €4,472,384 of which €2,472,152 for the fixed<br />
amount <strong>and</strong> €2,000,232 for the variable component.<br />
REMUNERATION OF THE CHIEF EXECUTIVE OFFICER<br />
The information given below covers all remuneration (fi xed <strong>and</strong> variable<br />
components) <strong>and</strong> benefits of every kind (stock options, performance shares,<br />
severance allowance, in-kind benefits <strong>and</strong> supplementary pension provisions)<br />
concerning Thierry de La Tour d’Artaise, the only Company officer to receive<br />
remuneration (as the other Board members receive attendance fees only).<br />
In respect of his corporate m<strong>and</strong>ate as Chairman <strong>and</strong> Chief Executive Officer<br />
of SEB S.A., Thierry de La Tour d’Artaise receives:<br />
a fixed remuneration;<br />
a variable remuneration, granted under performance conditions <strong>and</strong><br />
capped at 175% of the fixed remuneration.<br />
He receives no other remuneration from the Company or other <strong>Groupe</strong> SEB<br />
companies, apart from attendance fees for his membership of the SEB S.A.<br />
Board of Directors, amounting to €24,000 in <strong>2010</strong>.<br />
FIXED REMUNERATION<br />
The amount of annual salary is discussed <strong>and</strong> then proposed by the<br />
Nominations <strong>and</strong> Remuneration Committee to the Board of Directors.<br />
In <strong>2010</strong>, the fixed remuneration for Thierry de La Tour d’Artaise amounted to<br />
€800,330. This amount has remained the same since 2007.<br />
VARIABLE COMPONENT<br />
The variable remuneration of Thierry de La Tour d’Artaise is calculated<br />
according to the same principles <strong>and</strong> rules used for the Group’s executives:<br />
The variable component linked to the Group’s performance measured by<br />
growth in the Group’s revenues <strong>and</strong> operating margin account for 60%<br />
<strong>and</strong> the component linked to individual performance measured by the<br />
Remuneration Committee according to specific strategic goals for 40%.<br />
The items taken into account to calculate the variable component specifically<br />
include the personal contribution of the CEO to strategy, good governance,<br />
<strong>and</strong> the Group’s continued development.<br />
The quantitative <strong>and</strong> qualitative performance criteria are defined by the Board<br />
of Directors at the beginning of the year in line with the Group’s strategic<br />
priorities.<br />
These annual objectives are discussed then proposed by the Nominations<br />
<strong>and</strong> Remuneration Committee, before being confi rmed by the Board of<br />
Directors.<br />
The amount of the variable component is calculated on the basis of the<br />
annual fixed remuneration relating to the previous year.<br />
The variable component bonus paid in <strong>2010</strong> in respect of the 2009 financial<br />
year was €1,120,000.<br />
The variable component bonus paid in 2011 in respect of the <strong>2010</strong> financial<br />
year will be €1,248,000.<br />
For <strong>2010</strong>, the qualitative criteria used to calculate these items include:<br />
the Group’s continued development especially in emerging economies.<br />
IN-KIND BENEFITS<br />
Thierry de La Tour d’Artaise benefits a company car, equivalent to a benefit<br />
of €9,060 for the year, <strong>and</strong> receives €14,580 per year for the use of an<br />
apartment in Paris.<br />
LONG-TERM COMMITMENTS<br />
Pension commitment<br />
M. Thierry de La Tour d’Artaise is covered by the group supplementary<br />
pension scheme for <strong>Groupe</strong> SEB’s French top executives (members of the<br />
Group Executive Committee <strong>and</strong> Group Management Board).<br />
This scheme supplements the m<strong>and</strong>atory pension plans <strong>and</strong> comprises<br />
a defi ned contribution plan (known as “Article 83”) supplemented by an<br />
uncertain defined benefit plan:<br />
differential plan based on the officer’s seniority <strong>and</strong> presence. The benefit<br />
may be paid to supplement the benefits from the legal plans up to 25% of<br />
the reference remuneration computed over the average of the last three<br />
annual target remunerations;<br />
top-up plan contingent on seniority <strong>and</strong> presence for which the<br />
potential entitlement vested by year of seniority is 0.8% of the reference<br />
remuneration calculated over the average of the last three annual target<br />
remunerations <strong>and</strong> capped at 20 years of seniority or 16% of the reference<br />
remuneration.<br />
46 FINANCIAL REPORT AND REGISTRATION DOCUMENT <strong>2010</strong> GROUPE SEB
2<br />
CORPORATE GOVERNANCE<br />
GROUP MANAGEMENT BODIES<br />
To benefi t from the defi ned benefi t plans, <strong>Groupe</strong> SEB executives must<br />
have occupied functions within the Group Executive Committee or Group<br />
Management Board for at least eight years.<br />
The scheme is capped at 41% of the reference remuneration (including<br />
benefits from m<strong>and</strong>atory plans).<br />
Furthermore, the Board of Directors Meeting of 19 March <strong>2010</strong> decided,<br />
in addition to the above rules, to limit the reference remuneration used as<br />
the calculation basis to 36 times the annual Social Security ceiling in force<br />
on the retirement date.<br />
The Group intends to outsource the entire commitment through matching<br />
payments to a fund into which the pension contributions are made on a<br />
regular basis.<br />
Severance allowance<br />
Thierry de La Tour d’Artaise shall not benefit from any compensation payment<br />
by the Board of Directors in the event of termination of his corporate m<strong>and</strong>ate<br />
as a director.<br />
The employment contract under which he joined the Group in 1994, which<br />
eventually led to his appointment as Chief Executive Officer of the Group,<br />
was suspended on 1 March 2005 for the duration of his corporate m<strong>and</strong>ate<br />
as a director.<br />
This contract stipulates that (as for other members of the Group Executive<br />
Committee) in the event of termination of his contract by the employer (except<br />
for reasons of serious professional misconduct, or in the event of a change<br />
in the control of the Group), he would benefi t from a severance package<br />
equal to two years of his total remuneration. In application of the TEPA law,<br />
a new rider to this contract defines the conditions of performance to which<br />
this allowance is subject. It is fixed at two years of remuneration (basic pay<br />
+ bonus), which can vary according to the extent of achievement of targets<br />
over the previous four financial years, as follows:<br />
if the average rate of target achievement is less than 50%, no allowance<br />
is payable;<br />
if the average rate is between 50% <strong>and</strong> 100%, the allowance shall be<br />
between 75% <strong>and</strong> 100%, based on a linear calculation;<br />
if the average rate is above 100%, the allowance shall remain at 100%.<br />
The Board of Directors reserves the right to reduce this allowance by a<br />
maximum of one-half if the last trading year showed a net loss; however, the<br />
allowance may not be less than the fixed basic salary plus bonus for the last<br />
financial year if application of the performance criteria based on achievement<br />
of targets gives entitlement to payment of an allowance.<br />
The employment contract binding Thierry de La Tour d’Artaise includes no<br />
allowances concerning a non-competition clause.<br />
TABLE 1<br />
As the m<strong>and</strong>ate of Thierry de La Tour d’Artaise was renewed on 13 May<br />
2008, the Board of Directors, in accordance with the AFEP-MEDEF Code<br />
of October 2008, planned to review the prevailing situation in 2012, the date<br />
of the end of the current m<strong>and</strong>ate of Thierry de La Tour d’Artaise.<br />
Retirement lump-sum payment<br />
The total retirement lump-sum payment entitlement of Thierry de La Tour<br />
d’Artaise amounts to €320,055.<br />
STOCK OPTIONS – PERFORMANCE SHARES<br />
59,942 stock options <strong>and</strong> 4,995 performance shares were allocated to Thierry<br />
de La Tour d’Artaise in respect of the <strong>2010</strong> financial year.<br />
The Board of Directors decided that 50% of the stock options <strong>and</strong> 100%<br />
of the performance shares allocated to Thierry de La Tour d’Artaise will be<br />
contingent on performance conditions related to the growth of sales <strong>and</strong><br />
operating margin.<br />
Performance will be measured over the unavailability period of four years<br />
for stock options <strong>and</strong> the two-year vesting period for performance shares.<br />
Performance will be calculated as follows:<br />
if the achievement rate of sales targets <strong>and</strong> operating margin is equal to<br />
or greater than 100% in one year, one quarter of the stock options <strong>and</strong><br />
one half of the performance shares will be irrevocably vested;<br />
if the achievement rate of sales targets <strong>and</strong> operating margin is lower<br />
than 50% in one year, one quarter of the stock options <strong>and</strong> one half of<br />
the performance shares will be suspended;<br />
if the achievement rate of sales <strong>and</strong> operating margin targets is between<br />
50% <strong>and</strong> 100%, stock options <strong>and</strong> performance shares will be allocated<br />
on a proportional basis.<br />
In addition, shares originating from the exercise of stock options <strong>and</strong><br />
free shares allocated to Thierry de La Tour d’Artaise will be subject to an<br />
obligation to hold them in his name for the duration of occupancy of his<br />
post, in the following amounts:<br />
for shares originating from exercised stock options, a quantity of shares<br />
corresponding to 50% of the net gain on acquisition, net of tax <strong>and</strong><br />
statutory deductions, realized at the time of exercise of the options;<br />
for shares allocated free of charge, a quantity of shares corresponding to<br />
50% of the net gain after taxes, statutory deductions <strong>and</strong> costs.<br />
These amounts will be reduced to 20% of the net gain as soon as the number<br />
of shares held by Thierry de La Tour d’Artaise reaches the equivalent of<br />
2 years of remuneration.<br />
As a reminder, hedging instruments are prohibited <strong>and</strong> to the knowledge of<br />
the Company, no such instrument has been put in place.<br />
2<br />
Remuneration, stock options <strong>and</strong> shares allocated to the Chief Executive Officer<br />
2009 <strong>2010</strong><br />
Thierry de La Tour d’Artaise – Chairman <strong>and</strong> Chief Executive Officer<br />
Remuneration due for the year (details in table 2) €1,967,970 €2,095,970<br />
Valuation of stock options allocated during the year (details in table 4)* €410,297 €649,112<br />
Valuation of performance-related shares allocated during the year (details in table 6)* €139,823 €227,772<br />
TOTAL €2,518,090 €2,972,854<br />
* On each allocation date, the book fair value of the stock options <strong>and</strong> shares is determined in accordance with IFRS rules. This is a historic value on the allocation date, calculated for<br />
accounting purposes according to the method described in Note 19.2.1 of section 3 of the Consolidated <strong>Financial</strong> Statements. This value does not represent, neither a current market<br />
value nor a discounted value of these stock options <strong>and</strong> shares, nor the actual amount that could be generated at the exercise of these options, if they are exercised or at the vesting of<br />
these performance shares, if they become vested.<br />
GROUPE SEB<br />
FINANCIAL REPORT AND REGISTRATION DOCUMENT <strong>2010</strong><br />
47
2 GROUP<br />
CORPORATE GOVERNANCE<br />
MANAGEMENT BODIES<br />
TABLE 2<br />
Breakdown of the Chief Executive Officer’s remuneration<br />
Amounts in respect of 2009 Amounts in respect of <strong>2010</strong><br />
Thierry de La Tour d’Artaise –<br />
Chairman <strong>and</strong> Chief Executive Officer Due Paid Due Paid<br />
Fixed remuneration €800,330 €800,330 €800,330 €800,330<br />
Variable component €1,120,000 €1,031,000 €1,248,000 €1,120,000<br />
Exceptional remuneration none none none none<br />
Attendance fees €24,000 €24,000 €24,000 €24,000<br />
In-kind benefits: – Car allowance €9,060 €9,060 €9,060 €9,060<br />
– Accommodation €14,580 €14,580 €14,580 €14,580<br />
TOTAL €1,967,970 €1,878,970 €2,095,970 €1,967,970<br />
TABLE 3<br />
Attendance fees <strong>and</strong> other remuneration received by members of the Board of Directors excluding the Chairman <strong>and</strong> CEO<br />
Board members<br />
Attendance fees<br />
paid in 2009<br />
Attendance fees<br />
paid in <strong>2010</strong><br />
Tristan Boiteux €24,000 €24,000<br />
Damarys Braida €24,000 €24,000<br />
Pascal Castres Saint Martin €36,000 NA<br />
Philippe Desmarescaux €32,000 €33,600<br />
Norbert Dentressangle €32,000 €32,000<br />
Hubert Fevre €18,000 €21,000<br />
Jacques Gairard €24,000 €24,000<br />
FÉDÉRACTIVE (Pascal Girardot) €36,000 €34,400<br />
Philippe Lenain €32,000 €44,000<br />
Antoine Lescure €24,000 €15,000<br />
Cédric Lescure NA €9,000<br />
Frédéric Lescure €24,000 €24,000<br />
FFP (Christian Peugeot) €24,000 €24,000<br />
Jean-Dominique Senard NA €24,000<br />
VENELLE INVESTISSEMENT (Olivier Roclore) €24,000 €27,200<br />
Jérôme Wittlin €32,000 €32,000<br />
TOTAL €386,000 €392,200<br />
TABLE 4<br />
Stock option allocation for share subscription or purchase to the Chief Executive Officer in <strong>2010</strong><br />
Date of the plan<br />
Type of stock<br />
option (purchase<br />
or subscription)<br />
Valuation of stock<br />
options based on<br />
the method used<br />
in the consolidated<br />
accounts<br />
Number of stock<br />
options allocated Exercise price Exercise period<br />
from 18/06/2014<br />
to 18/06/2018<br />
Thierry de La Tour d’Artaise 18/06/<strong>2010</strong> Purchase €10.829 59,942 €53.86<br />
TABLE 5<br />
Stock options exercised by the Chief Executive Officer in <strong>2010</strong><br />
Date of the plan<br />
Number of<br />
stock options<br />
exercised<br />
during the year Exercise price Year of allocation<br />
Thierry de La Tour d’Artaise 17/10/2002 6,600 €25.15 2002<br />
18/06/2003 55,516 €24.24 2003<br />
48 FINANCIAL REPORT AND REGISTRATION DOCUMENT <strong>2010</strong> GROUPE SEB
2<br />
CORPORATE GOVERNANCE<br />
GROUP MANAGEMENT BODIES<br />
TABLE 6<br />
Performance shares allocated to the Chief Executive Officer<br />
Date of the plan<br />
Number of shares<br />
allocated Unit valuation Vesting date<br />
Availability<br />
date<br />
Thierry de La Tour d’Artaise 18/06/<strong>2010</strong> 4,995 €45.60 18/06/2012 18/06/2014<br />
Performance conditions<br />
Sales <strong>and</strong> operating margin<br />
goals reached<br />
TABLE 7<br />
Performance shares available during the financial year for the Company officer<br />
Name of the Chief Executive Officer<br />
Date of the plan<br />
Number of<br />
available shares<br />
Thierry de La Tour d’Artaise 11/06/2009 none<br />
18/06/<strong>2010</strong> none<br />
Vesting conditions<br />
TABLE 8<br />
History of stock option allocation for share subscription or purchase to the Chief Executive Officer<br />
At 31 December <strong>2010</strong><br />
Subscription<br />
plan<br />
Purchase<br />
plan<br />
Purchase<br />
plan<br />
Purchase<br />
plan<br />
Purchase<br />
plan<br />
Purchase<br />
plan<br />
Purchase<br />
plan<br />
Purchase<br />
plan<br />
Purchase<br />
plan<br />
Purchase<br />
plan<br />
Purchase<br />
plan<br />
Date of AGM 04/05/2000 03/05/1999 14/05/2002 14/05/2002 06/05/2004 06/05/2004 11/05/2006 11/05/2006 13/05/2008 13/05/2009 12/05/<strong>2010</strong><br />
Date of Board of<br />
Directors’ Meeting 14/06/2001 19/04/2002 17/10/2002 18/06/2003 18/06/2004 08/04/2005 16/06/2006 20/04/2007 13/05/2008 12/06/2009 18/06/<strong>2010</strong><br />
Total stock options<br />
allocated (a) 493,500 417,450 598,125 612,150 539,100 554,700 589,798 579,150 1,005,900 371,300 412,592<br />
Of which options<br />
allocated to CEO<br />
Thierry de La Tour<br />
d’Artaise (a) 66,000 49,500 6,600 115,516 104,989 105,000 105,012 105,000 105,000 71,250 59,942<br />
Stock options<br />
exercise date 14/06/2005 19/04/2006 17/10/2006 18/06/2007 18/06/2008 08/04/2009 16/06/<strong>2010</strong> 20/04/2011 13/05/2012 12/06/2013 18/06/2014<br />
Expiry date 14/06/2009 19/04/<strong>2010</strong> 17/10/<strong>2010</strong> 18/06/2011 18/06/2012 08/04/2013 16/06/2014 20/04/2015 13/05/2016 12/06/2017 18/06/2018<br />
Subscription or<br />
purchase price<br />
(in €) (a) 18.18 27.88 25.15 24.24 31.67 28.00 29.33 44.00 38.35 28.05 53.86<br />
Average of last<br />
20 prices prior to<br />
Board Meeting (in €) (a) 17.95 27.78 26.65 24.03 31.52 28.20 29.01 43.73 38.35 28.05 53.854<br />
Number of stock<br />
options exercised (a) 66,000 49,500 6,600 115,516 0 0 0 0 0 0 0<br />
Number of stock<br />
options cancelled (a) 0 0 0 0 0 0 0 0 0 0 0<br />
Balance of stock<br />
options remaining to<br />
be exercised (a) 0 0 0 0 104,989 105,000 105,012 105,000 105,000 71,250 59,942<br />
2<br />
(a) Takes into account the allocation of free shares in March 2004 (1 for 10) <strong>and</strong> the three-way split on 16 June 2008.<br />
GROUPE SEB<br />
FINANCIAL REPORT AND REGISTRATION DOCUMENT <strong>2010</strong><br />
49
2 GROUP<br />
CORPORATE GOVERNANCE<br />
MANAGEMENT BODIES<br />
TABLE 9<br />
Options allocated in <strong>2010</strong> – Ten highest allocations of Stock options to non-executive officers<br />
Total number of stock options allocated<br />
Weighted average<br />
price<br />
Plan in question<br />
57,600 €53.86 18/06/<strong>2010</strong><br />
Stock options exercised in <strong>2010</strong> – Ten highest stock options exercised by non-executive officers<br />
Date of the plan 19/04/2002 17/10/2002 18/06/2003 18/06/2004 08/04/2005 16/06/2006 Overall<br />
Type of stock options Purchase Purchase Purchase Purchase Purchase Purchase<br />
Price of option €27.88 €25.15 €24.24 €31.67 €28.00 €29.33 €28.80<br />
Number of stock options<br />
exercised 52,725 15,015 64,864 149,986 156,000 173,022 611,612<br />
TABLE 10<br />
General information about the Chief Executive Officer<br />
Employment contract<br />
Complementary<br />
pension scheme<br />
Indemnities or<br />
benefits due or likely<br />
to be due subsequent<br />
to the termination or<br />
modification of functions<br />
Allowance concerning<br />
non-competition clause<br />
Yes No Yes No Yes No Yes No<br />
Thierry de La Tour d’Artaise (suspended) X X X<br />
SHARE TRANSACTIONS CARRIED OUT BY MEMBERS<br />
OF SEB MANAGEMENT DURING <strong>2010</strong> (ARTICLE L. 621-18-2<br />
OF THE FRENCH MONETARY AND FINANCIAL CODE)<br />
Name<br />
Function<br />
Number<br />
of shares bought<br />
or subscribed<br />
Average<br />
acquisition<br />
price<br />
Number of<br />
shares sold<br />
Average<br />
sale price<br />
Tristan Boiteux Board member 463 €52.65<br />
Person linked to Tristan Boiteux Board member 36 €52.84<br />
Person linked to Damarys Braida Board member 8,700 €54.58<br />
Thierry de La Tour d’Artaise Chairman & CEO 62,116 €24.34<br />
Person linked to Thierry de La Tour d’Artaise Chairman & CEO 8,954 €68.32<br />
Hubert Fèvre Board member 580 €52.65<br />
FFP – Sté Foncière, Financière et de Participations Board member 380,000 €55.22<br />
Jacques Gairard Board member 1,300 €67.39 200 €72.00<br />
Person linked to Jacques Gairard Board member 14,500 €48.18<br />
Pascal Girardot, permanent<br />
representative of FÉDÉRACTIVE Board member 514 €52.20<br />
Person linked to Pascal Girardot,<br />
permanent representative of FÉDÉRACTIVE Board member 299 €53.44<br />
Jean-Pierre Lac Executive Vice-president 65,555 €28.62 27,791 €67.29<br />
Cédric Lescure Board member 143 €54.08<br />
Frédéric Lescure Board member 306 €53.00<br />
Person linked to Frédéric Lescure Board member 32 €52.45<br />
Harry Touret Executive Vice-president 54,003 €29.55 7,500 €49.68<br />
Personn linked to Harry Touret Executive Vice-president 20,808 €77.36<br />
Frédéric Verwaerde Executive Vice-president 24,002 €28.67 24,002 €55.70<br />
50 FINANCIAL REPORT AND REGISTRATION DOCUMENT <strong>2010</strong> GROUPE SEB
2<br />
CORPORATE GOVERNANCE<br />
CHAIRMAN’S REPORT ON INTERNAL CONTROL<br />
CHAIRMAN’S REPORT<br />
ON INTERNAL CONTROL<br />
In accordance with Article 117 of the French <strong>Financial</strong> Securities Act<br />
of 1 August 2003, <strong>and</strong> the provisions of Article L. 225-37 of the French<br />
Commercial Code, as amended on 3 July 2008 (law No 2008-649), the<br />
object of this report is to describe the organization of the work of the Board<br />
of Directors, <strong>and</strong> the internal control procedures adopted by <strong>Groupe</strong> SEB<br />
for the year ended 31 December <strong>2010</strong>.<br />
This report, drawn up under the supervision of the Chairman, is essentially<br />
based on the coordinated work of the Group’s Audit <strong>and</strong> Organization<br />
department, in liaison with the Finance department <strong>and</strong> the main corporate<br />
support functions <strong>and</strong> operational management. It also takes account of<br />
consultations with the Audit Committee <strong>and</strong> the Statutory auditors.<br />
This report was approved by the Board of Directors on 25 February 2011.<br />
In accordance with the new provisions of the law of 3 July 2008 which<br />
requires each company to identify which Corporate Governance Code it<br />
abides by, <strong>Groupe</strong> SEB hereby indicates that it abides by the AFEP-MEDEF<br />
Corporate Governance Code of December 2008.<br />
2<br />
GROUP INTERNAL CONTROL ENVIRONMENT<br />
In the course of its operations <strong>and</strong> in pursuit of its business strategy, <strong>Groupe</strong><br />
SEB is exposed to a number of risks <strong>and</strong> unknown factors, both internal<br />
<strong>and</strong> external. To cope with this situation, it has set up an organization <strong>and</strong><br />
procedures aimed at identifying, quantifying, anticipating <strong>and</strong> managing<br />
these risks as much as possible, in order to reduce their negative impact<br />
<strong>and</strong> thus to help to achieve the Company’s operational <strong>and</strong> strategic goals.<br />
The internal control system is a process defined <strong>and</strong> implemented by the<br />
Group under its own responsibility to ensure:<br />
compliance with laws <strong>and</strong> regulations;<br />
application of instructions <strong>and</strong> guidelines, <strong>and</strong> conformity with the Group’s<br />
internal practices;<br />
the proper functioning of the Company’s internal processes;<br />
the quality, integrity <strong>and</strong> relevance of its internal <strong>and</strong> external information,<br />
particularly financial disclosures;<br />
organizational adaptation to changes in st<strong>and</strong>ards <strong>and</strong> regulations;<br />
consistency between identified risks, objectives <strong>and</strong> expected benefits;<br />
reduced exposure to risks of fraudulent behaviour;<br />
prevention, <strong>and</strong>, if necessary, punishment of unethical conduct.<br />
As with any control system, it cannot provide an absolute guarantee that<br />
these risks are totally eliminated.<br />
<strong>Groupe</strong> SEB is an international entity, whose organization is firstly divided<br />
into geographical zones for continents, each with their own ranges of<br />
products to sell. In addition, operations are organized by activity, covering<br />
specific product lines <strong>and</strong> trademarks. This mode of operating depends on<br />
decentralization of operational responsibilities <strong>and</strong> extensive delegation.<br />
But at the same time, to guarantee efficient overall management, <strong>Groupe</strong> SEB<br />
applies clearly-defined operational <strong>and</strong> delegation rules. It also benefits from<br />
a well-established corporate culture which is rooted in shared fundamental<br />
values that foster an ethical working environment: high-quality work, mutual<br />
respect, team spirit, loyalty <strong>and</strong> thoroughness.<br />
The internal audit system is based on a structured Quality Management<br />
System defining eleven key functional areas which integrate the dem<strong>and</strong>s<br />
<strong>and</strong> requirements of Sustainable Development.<br />
A signatory of the Global Compact since 2003, <strong>Groupe</strong> SEB supports the<br />
values set out in this document <strong>and</strong> promotes them throughout the Company.<br />
The Group Human Resources department states in its guiding principles<br />
that: “The Group is a community of men <strong>and</strong> women who share the same<br />
objectives <strong>and</strong> values”.<br />
Against this background, <strong>Groupe</strong> SEB enjoins all its employees to uphold<br />
ethical st<strong>and</strong>ards <strong>and</strong> act in accordance with them.<br />
The integrity of the internal control function is also assured by an internal<br />
control manual, detailing the main internal control guidelines for each Group<br />
structure:<br />
use of a delegation manual <strong>and</strong> definition of power limits;<br />
internal control rules governing commercial operations, the management<br />
of customer credit <strong>and</strong> settlement methods, relations with banking<br />
institutions, payroll management, purchasing control, fi nancial asset<br />
management <strong>and</strong> the protection of corporate property <strong>and</strong> assets;<br />
respect for rules governing division of responsibilities;<br />
policies applying to insurance cover <strong>and</strong> hedging;<br />
financial reporting audit principles.<br />
GROUPE SEB<br />
FINANCIAL REPORT AND REGISTRATION DOCUMENT <strong>2010</strong><br />
51
2 CHAIRMAN’S<br />
CORPORATE GOVERNANCE<br />
REPORT ON INTERNAL CONTROL<br />
The risk analysis <strong>and</strong> internal control processes use two basic tools:<br />
an annual ‘top-down’ review <strong>and</strong> analysis of the main risks. In <strong>2010</strong>,<br />
the members the Group Executive Committee, the Director of Legal Affairs<br />
<strong>and</strong> the Director of IT Systems, the President in charge of Innovation<br />
<strong>and</strong> the President in charge of Strategy were interviewed individually to<br />
help identify <strong>and</strong> analyze the top ten risks that <strong>Groupe</strong> SEB is or could<br />
be exposed to. Estimating a probability, an impact <strong>and</strong> a degree of<br />
preparation for the Group to be ready to manage each of these risks<br />
enables us to establish an annual map of the major risks for <strong>Groupe</strong> SEB;<br />
a ‘bottom-up’ process involving self-assessment questionnaires, based on<br />
processes. These are sent out to each operational entity <strong>and</strong> are designed<br />
to identify possible weak points <strong>and</strong> encourage the practice of internal<br />
control at all levels, with a view to making Group operations more efficient.<br />
In <strong>2010</strong>, the self-assessment process was completed as in previous years,<br />
with one questionnaire every two years for each Group entity.<br />
Added to these two methods of evaluation are regular internal audits of all<br />
entities <strong>and</strong> of all the Group’s functions, as well as the annual <strong>and</strong> half-yearly<br />
reviews carried out by the Statutory auditors.<br />
In <strong>2010</strong>, the self-assessment questionnaires for each process were<br />
thoroughly reviewed <strong>and</strong> analyzed to enhance their efficiency as tools.<br />
In <strong>2010</strong>, a crisis drill was conducted with the entire Executive Committee<br />
<strong>and</strong> involved a certain number of operational functions connected to this<br />
fake scenario. An analysis of the strengths <strong>and</strong> weaknesses of this simulation<br />
allowed the improvement of the Group’s crisis prevention <strong>and</strong> management<br />
process.<br />
INTERNAL CONTROL PARTICIPANTS<br />
THE BOARD OF DIRECTORS, THE AUDIT<br />
COMMITTEE AND THE NOMINATIONS<br />
AND REMUNERATION COMMITTEE<br />
The role of these bodies is described in the “Organization <strong>and</strong> Operation of<br />
the Board of Directors” section, pages 42 <strong>and</strong> 43.<br />
GROUP EXECUTIVE COMMITTEE<br />
AND GROUP MANAGEMENT BOARD<br />
Their role is described in the “Group Management Bodies” section, page 45.<br />
THE INTERNAL AUDIT DEPARTMENT<br />
Internal audit, as defined by professional st<strong>and</strong>ards, consists of<br />
“an independent <strong>and</strong> objective process which ensures that the Group has<br />
adequate control of its operations <strong>and</strong> which offers advice on improving the<br />
latter while contributing to added value. The internal audit function helps the<br />
Group to achieve its objectives by systematically <strong>and</strong> methodically evaluating<br />
its risk management, control <strong>and</strong> corporate governance procedures, <strong>and</strong><br />
through recommendations for their improvement.”<br />
The role of the <strong>Groupe</strong> SEB Internal Audit department is fully consistent<br />
with this approach.<br />
The Internal Audit department is responsible for evaluating, at all locations<br />
where the Group is established <strong>and</strong> for all functions, compliance with Group<br />
Internal Rules <strong>and</strong> procedures <strong>and</strong> any non-compliance with legislation, <strong>and</strong><br />
for ensuring that Group assets are protected. It is also required to evaluate<br />
the efficient conduct of operations <strong>and</strong> to ensure that all business risks are<br />
anticipated <strong>and</strong> controlled.<br />
In the area of risk management, the Internal Audit department draws up a<br />
map of high-level risks.<br />
Based on this map, on the self-assessment questionnaires <strong>and</strong> on the<br />
principle of an audit in each entity every three or four years, the Audit<br />
department proposes an internal audit plan for the following year.<br />
This plan is submitted to the Audit Committee.<br />
Each internal audit – adapted to circumstances <strong>and</strong> conducted locally by<br />
an average of three Auditors over a two-week period – gives rise to an audit<br />
report which is sent to the audited structures <strong>and</strong> their upline management,<br />
to the members of the Group Executive Committee <strong>and</strong> to the Group<br />
Chairman <strong>and</strong> CEO, describing the basic organization of each process <strong>and</strong><br />
making recommendations.<br />
Steps are then taken by operational management to remedy identifi ed<br />
shortcomings in internal control, <strong>and</strong> to make any other necessary<br />
improvements. The implementation of resulting action plans is subjected to<br />
a systematic internal audit review within 12 months of the audit.<br />
The results of these audits are compared with the results of the<br />
self-assessments, thus completing the full circle of the internal control process.<br />
In order to ensure continuous improvement of internal control <strong>and</strong> company<br />
efficiency, the main recommendations issued by the Audit department for<br />
each process are shared yearly with the Group Management Committee for<br />
the main Group divisions: purchasing, IT, quality, finance, human resources,<br />
logistics, production, after-sales service <strong>and</strong> marketing.<br />
The Internal Audit department draws up an annual report of work done which<br />
is presented to the Group Executive Committee <strong>and</strong> the Audit Committee.<br />
The Audit Committee reviews the resources needed by the Internal<br />
Audit department to carry out its work, <strong>and</strong> makes observations or<br />
recommendations as required. The Internal Audit department has a staff<br />
of eight people.<br />
LEGAL AND INSURANCE DEPARTMENT<br />
The role of the Group Legal department is to ensure that the Group complies<br />
with legal <strong>and</strong> regulatory requirements wherever it operates, to protect the<br />
Group’s assets <strong>and</strong> businesses <strong>and</strong> to defend the interests of the Group,<br />
its management <strong>and</strong> employees in carrying out their functions. The Legal<br />
department is concerned with three main areas of internal control:<br />
it drafts <strong>and</strong> updates model contracts <strong>and</strong> their related procedures for<br />
frequently recurring transactions (purchases of goods <strong>and</strong> services,<br />
conditions of sale, advertising campaigns, damages claims, etc.);<br />
52 FINANCIAL REPORT AND REGISTRATION DOCUMENT <strong>2010</strong> GROUPE SEB
2<br />
CORPORATE GOVERNANCE<br />
CHAIRMAN’S REPORT ON INTERNAL CONTROL<br />
it makes recommendations to the Group Executive Committee on rules for<br />
delegating authority, <strong>and</strong> on the circulation <strong>and</strong> protection of confidential<br />
information, <strong>and</strong> it applies <strong>and</strong> monitors these rules;<br />
it selects external legal advisors, monitors their services <strong>and</strong> performance,<br />
<strong>and</strong> oversees invoicing follow-up in liaison with the Management Control<br />
department.<br />
The role of the Legal department in the area of insurance is to ensure that<br />
there is adequate insurance cover of the risks to which the Group is exposed.<br />
<strong>Groupe</strong> SEB insurance cover is managed on a worldwide consolidated basis.<br />
Worldwide insurance cover is arranged in partnership with leading insurance<br />
pools; additional specific policies can be subscribed to locally.<br />
FINANCE, TREASURY AND TAX DEPARTMENT<br />
The role of this department is to ensure the security, transparency <strong>and</strong><br />
efficiency of treasury <strong>and</strong> financial transactions, <strong>and</strong> to ensure compliance<br />
with regulations <strong>and</strong> tax obligations in all the countries where the Group<br />
is based.<br />
Its responsibilities in this area cover:<br />
financial resource management, in consultation with the Executive<br />
Vice-president, Finance, to ensure the Group’s liquidity;<br />
cash flow management;<br />
financial risk assessment <strong>and</strong> hedging (particularly in the areas of foreign<br />
exchange <strong>and</strong> raw material prices);<br />
ongoing relations with banks;<br />
financial management support for subsidiaries, <strong>and</strong> support for the<br />
Group’s General Management, in financial planning for new projects.<br />
This department has a triple responsibility in the area of internal control:<br />
monitor tax inspections carried out by taxation authorities in all the Group’s<br />
entities;<br />
ensure consistency in the tax procedures used by the Group’s entities<br />
<strong>and</strong> in liaison with tax consultants, verify the compliance of the Group’s<br />
main activities with current legislation;<br />
select tax consultants <strong>and</strong> monitor the services provided along with their<br />
cost.<br />
In <strong>2010</strong>, the position of Credit Management Director in charge of managing<br />
<strong>and</strong> limiting the Group’s customer risk was created at a global level.<br />
A Credit Management Committee is in charge of prior authorization in the<br />
event of any client receivable balance significantly exceeding the balance<br />
covered within the framework of contracts with COFACE or any other credit<br />
insurance organization.<br />
THE GROUP MANAGEMENT CONTROL<br />
DEPARTMENT<br />
The Group Executive Committee attaches great importance to the Group’s<br />
planning procedures. These prepare the ground for the annual budget, which<br />
makes it possible to defi ne the Group’s strategic priorities <strong>and</strong> draw up<br />
operational plans.<br />
The Management Control department is responsible for issuing appropriate<br />
directives <strong>and</strong> guidelines to help those involved in drawing up the budget.<br />
It coordinates budget planning <strong>and</strong> control, using a h<strong>and</strong>book of management<br />
procedures <strong>and</strong> rules applicable to all entities, including Group budgeting,<br />
forecasting <strong>and</strong> management reporting methods.<br />
The management reporting system uses a consolidation management tool<br />
for calculating the Group results.<br />
Physical or financial controls make it possible to verify balance sheet items<br />
such as components of the working capital requirement <strong>and</strong> cash position.<br />
These various aggregates are budgeted at the end of the year <strong>and</strong> monitored<br />
monthly.<br />
The Management Control department draws up a Group budget forecast<br />
chart <strong>and</strong> distributes this, with an analysis of significant variances <strong>and</strong> trends<br />
based on the information provided by the Group’s entities in their monthly<br />
business reports.<br />
The Department operates with accounting <strong>and</strong> management software that<br />
allows efficient operational <strong>and</strong> strategic monitoring.<br />
THE INFORMATION SYSTEMS DEPARTMENT<br />
The Group’s IT system is designed to guarantee the security, integrity,<br />
availability <strong>and</strong> traceability of information.<br />
To ensure the proper use of these tools <strong>and</strong> the utility of data, an operating<br />
manual adapted to the needs of users has been drawn up.<br />
The Group has also introduced procedures to ensure the security of its<br />
information systems <strong>and</strong> the integrity of its electronic data.<br />
An Information Systems Steering Committee is responsible for drawing up<br />
an IT master plan which corresponds to the Group’s organizational needs<br />
<strong>and</strong> general development policy. This committee, chaired by the Executive<br />
Vice-president, Industry, comprises the Information Systems department <strong>and</strong><br />
representatives of user entities (including Continental General Management,<br />
Strategic Business Areas Management, the Group Finance department <strong>and</strong><br />
the Human Resources department). Within this framework, it determines the<br />
nature of IT system projects <strong>and</strong> decides on priorities for resource allocation<br />
<strong>and</strong> IT security policies.<br />
The IT data security committee, of which the Audit department is part,<br />
meets regularly to ensure that the level of IT risk within the Group <strong>and</strong> its<br />
subsidiaries is adequately managed <strong>and</strong> that appropriate informational <strong>and</strong><br />
sensitization measures are taken to prevent the risk of piracy of our systems.<br />
Internal audit missions now include more detailed scrutiny of IT security risk<br />
areas, in particular concerning integrated software: user profile management<br />
<strong>and</strong> the risk of system access rights within an enterprise function.<br />
The risk of intrusion into the network <strong>and</strong>/or into a centralized application is<br />
periodically evaluated <strong>and</strong> tested.<br />
Data security audits were also conducted in some supplier companies.<br />
THE QUALITY DEPARTMENT<br />
The desire to improve the quality of its products <strong>and</strong> processes has always<br />
been a central concern of <strong>Groupe</strong> SEB.<br />
The Group uses a Quality Management System (QMS) with Group-wide<br />
st<strong>and</strong>ards that are posted on the Company’s intranet.<br />
2<br />
GROUPE SEB<br />
FINANCIAL REPORT AND REGISTRATION DOCUMENT <strong>2010</strong><br />
53
2 CHAIRMAN’S<br />
CORPORATE GOVERNANCE<br />
REPORT ON INTERNAL CONTROL<br />
<strong>Document</strong>ation for this system includes reference to all procedures, tools<br />
<strong>and</strong> methods relating to the Group’s key processes:<br />
management procedures, definition of Group policy, strategic planning,<br />
constant improvement in quality, <strong>and</strong> safeguarding the environment;<br />
operational processes including strategic marketing, R&D, sales <strong>and</strong><br />
marketing, client order processing <strong>and</strong> production transfers;<br />
operational support functions, covering human resources, information<br />
systems, purchasing, finance, after-sales service <strong>and</strong> customer assistance.<br />
The Quality department uses monthly feedback reporting to fi ne-tune its<br />
action plans, which are then submitted to the Group Executive Committee.<br />
THE FINANCIAL COMMUNICATIONS DEPARTMENT<br />
Each year, this department draws up a schedule of the Group’s regular<br />
financial communications for financial markets <strong>and</strong> institutional investors. It<br />
identifies, in collaboration with the Legal department, legal <strong>and</strong> regulatory<br />
requirements for publication of Group financial notices.<br />
ACCOUNTING AND FINANCIAL INFORMATION PROCEDURES<br />
Internal control procedures for accounting <strong>and</strong> financial information aim to<br />
ensure the quality of the financial information provided by the consolidated<br />
subsidiaries, <strong>and</strong> the fairness <strong>and</strong> accuracy of the fi nancial information<br />
issued by the Group, while safeguarding against risks of error, inaccuracy<br />
or omission in the Group’s financial statements.<br />
<strong>Groupe</strong> SEB uses internal control guidelines based on AMF framework<br />
guidelines <strong>and</strong> accounting <strong>and</strong> financial audit principles.<br />
CENTRALIZED TREASURY AND FINANCE<br />
OPERATIONS<br />
Local regulations permitting, the Group Finance department ensures the<br />
financing of its subsidiaries via cash pooling, inter-company financing<br />
contracts <strong>and</strong> the use of currency flows for payments <strong>and</strong> receipts.<br />
This centralization of operations allows the Finance department to:<br />
control external debt <strong>and</strong> monitor its development;<br />
manage the risk rate inherent in the contracted debt;<br />
finance its subsidiaries in their local currency where regulations permit;<br />
anticipate <strong>and</strong> manage currency risk inherent in commercial <strong>and</strong> financial<br />
flows.<br />
Another important element of internal control is the Group’s centralized<br />
choice of working-partner banks <strong>and</strong> effective long-term management of<br />
these relations.<br />
This organization enables the Finance department to ensure overall control<br />
of the Group’s treasury operations.<br />
CONSOLIDATED ACCOUNTS MANAGEMENT<br />
AND CONTROL<br />
We have already described the role of Group Management Control in<br />
overseeing monthly consolidated financial management information.<br />
Budgetary control identifi es deviations from performance targets, on the<br />
basis of monthly consolidated data which is compared to an analysis of<br />
Group operational directives. This makes it possible to identify any changes<br />
or discrepancies in relation to financial budget data <strong>and</strong> previous years.<br />
This decentralized statutory consolidation includes all the companies in<br />
the Group that are directly or indirectly controlled by the Group’s holding<br />
company, SEB S.A.<br />
Each consolidated subsidiary prepares a set of accounts, restated to comply<br />
with the Group’s accounting procedures <strong>and</strong> based on accounting data from<br />
local information systems. All the Group’s entities apply IFR accounting<br />
st<strong>and</strong>ards.<br />
The Finance Managers of the subsidiaries prepare the restated accounts<br />
on the basis of the Group’s accounting procedures manual, which sets out<br />
rules for accounting entries <strong>and</strong> evaluation.<br />
This manual describes the principles used to draw up financial statements.<br />
The principles cover areas such as preparation of accounts on the<br />
assumption of operational continuity, compliance with accounting periods,<br />
<strong>and</strong> ensuring the integrity of the information in the fi nancial statements.<br />
It is regularly updated to integrate changes in legislation <strong>and</strong> regulations<br />
governing the preparation of consolidated accounts in France.<br />
The accounting procedures manual also gives a precise description of the<br />
principles used by the Group for accounting entries, <strong>and</strong> evaluation <strong>and</strong><br />
presentation of the main items in the financial statements:<br />
descriptions of constituent items of the consolidated income statement<br />
with their defi nitions, as well as consistency tests for the purpose of<br />
taxation;<br />
rules governing balance sheet <strong>and</strong> off-balance sheet items <strong>and</strong> their<br />
presentation;<br />
regulations concerning the valuation of certain estimated items, such as:<br />
provisions for the impairment of receivables,<br />
provisions for the impairment of stocks of raw materials <strong>and</strong> finished<br />
products,<br />
provisions for the impairment of non-current assets,<br />
provisions relating to sales (e.g., warranties <strong>and</strong> unsold returns),<br />
other provisions for risks <strong>and</strong> charges <strong>and</strong> in particular, provisions for<br />
restructuring;<br />
accounting principles applied to reporting intra-Group transactions.<br />
54 FINANCIAL REPORT AND REGISTRATION DOCUMENT <strong>2010</strong> GROUPE SEB
2<br />
CORPORATE GOVERNANCE<br />
CHAIRMAN’S REPORT ON INTERNAL CONTROL<br />
Prior to each consolidation period, the Group Consolidation department<br />
issues a reminder of the reporting deadline <strong>and</strong> indicates any newly-applicable<br />
changes in st<strong>and</strong>ards, rules <strong>and</strong> principles.<br />
On receiving the sets of accounts for consolidation, the Group Consolidation<br />
department conducts the usual verifications before carrying out the actual<br />
consolidation. This review of the accounts submitted is an opportunity to<br />
verify the evaluation <strong>and</strong> accounting methods used for large, unusual or<br />
exceptional transactions.<br />
To ensure the integrity of the financial data received from the subsidiaries,<br />
the Group Consolidation department refers to the covering letter sent in by<br />
the management of each subsidiary (whether or not consolidated), at the<br />
time of closure of the half-yearly <strong>and</strong> annual accounts. In this covering letter,<br />
the official representative <strong>and</strong> the Finance Director of the entity concerned<br />
jointly certify the compliance of the financial statements with the Group’s<br />
accounting rules <strong>and</strong> principles, the effectiveness of the internal control<br />
procedures used to process <strong>and</strong> draw up the financial statements <strong>and</strong> the<br />
absence of irregularities involving personnel or management. In addition,<br />
they comment on any significant events occurring during the accounting<br />
period under review <strong>and</strong> describe all elements which, in themselves or in their<br />
overall effect, influence the comprehension <strong>and</strong> evaluation of the financial<br />
statements of the entity concerned.<br />
FINANCIAL COMMUNICATION<br />
The Group’s financial statements, accounts <strong>and</strong> notes to the accounts are<br />
drawn up on the basis of the fi nal data processed by the consolidation<br />
software. These are then integrated into the annual or half-year reports.<br />
The texts of all the Group’s fi nancial publications (annual <strong>and</strong> half-year<br />
reports, letters to shareholders, shareholder guide, etc.), are drawn up by<br />
reference to information gathered throughout the year <strong>and</strong> specific interviews<br />
conducted at least twice a year (or more frequently as dictated by current<br />
concerns or special issues) with the senior management of the SBAs,<br />
Continental Structures <strong>and</strong> Corporate Support Functions. They are validated<br />
by the latter <strong>and</strong> by the Group Executive Committee.<br />
2<br />
GROUPE SEB<br />
FINANCIAL REPORT AND REGISTRATION DOCUMENT <strong>2010</strong><br />
55
2 STATUTORY<br />
CORPORATE GOVERNANCE<br />
AUDITORS’ REPORT ON INTERNAL CONTROL<br />
STATUTORY AUDITORS’ REPORT<br />
ON INTERNAL CONTROL<br />
YEAR ENDED 31 DECEMBER <strong>2010</strong><br />
To the Shareholders,<br />
In our capacity as Statutory auditors of SEB S.A. <strong>and</strong> in accordance with<br />
Article L. 225-235 of the French Commercial Code (Code de Commerce),<br />
we hereby report to you on the report prepared by the Chairman of your<br />
Company in accordance with Article L.225-37 of the French Commercial<br />
Code for the year ended 31 December <strong>2010</strong>.<br />
It is the Chairman’s responsibility to prepare, <strong>and</strong> submit to the Board of<br />
Directors for approval, a report on the internal control <strong>and</strong> risk management<br />
procedures implemented by the Company <strong>and</strong> containing the other<br />
disclosures required by Article L. 225-37 of the French Commercial Code,<br />
particularly in terms of corporate governance.<br />
It is our responsibility:<br />
to report to you on the information contained in the Chairman’s report in<br />
respect of the internal control procedures relating to the preparation <strong>and</strong><br />
processing of accounting <strong>and</strong> financial information; <strong>and</strong><br />
to attest that this report contains the other disclosures required by<br />
Article L. 225-37 of the French Commercial Code, it being specified that<br />
we are not responsible for verifying the fairness of these disclosures.<br />
We conducted our work in accordance with professional st<strong>and</strong>ards<br />
applicable in France.<br />
INFORMATION ON THE INTERNAL CONTROL PROCEDURES<br />
RELATING TO THE PREPARATION AND PROCESSING<br />
OF ACCOUNTING AND FINANCIAL INFORMATION<br />
The professional st<strong>and</strong>ards require that we perform the necessary procedures to assess the fairness of the information provided in the Chairman’s report<br />
in respect of the internal control procedures relating to the preparation <strong>and</strong> processing of accounting <strong>and</strong> financial information. These procedures mainly<br />
consisted in:<br />
obtaining an underst<strong>and</strong>ing of the internal control procedures relating to the preparation <strong>and</strong> processing of accounting <strong>and</strong> financial information on which<br />
the information presented in the Chairman’s report is based <strong>and</strong> the existing documentation;<br />
obtaining an underst<strong>and</strong>ing of the work involved in the preparation of this information <strong>and</strong> the existing documentation;<br />
determining whether any significant weaknesses in the internal control procedures relating to the preparation <strong>and</strong> processing of accounting <strong>and</strong> financial<br />
information that we would have noted in the course of our engagement are properly disclosed in the Chairman’s report.<br />
On the basis of our work, we have nothing to report on the information in respect of the Company’s internal control procedures relating to the preparation<br />
<strong>and</strong> processing of accounting <strong>and</strong> financial information contained in the report prepared by the Chairman of the Board of Directors in accordance with<br />
Article L. 225-37 of the French Commercial Code.<br />
OTHER DISCLOSURES<br />
We hereby attest that the report of the Chairman of the Board includes the other disclosures required by Article L. 225-37 of the French Commercial Code.<br />
Lyon <strong>and</strong> Villeurbanne, 21 March 2011<br />
The Statutory Auditors<br />
PricewaterhouseCoopers Audit<br />
Bernard RASCLE<br />
Deloitte & Associés<br />
Dominique VALETTE<br />
This is a free translation into English of the Statutory auditors’ report issued in French prepared in accordance with Article L. 225-235 of the French Commercial<br />
Code on the report prepared by the Chairman of the Board of Directors of SEB S.A. on the internal control procedures relating to the preparation <strong>and</strong> processing<br />
of accounting <strong>and</strong> financial information issued in French <strong>and</strong> is provided solely for the convenience of English speaking users.<br />
This report should be read in conjunction with, <strong>and</strong> construed in accordance with, French law <strong>and</strong> the relevant professional st<strong>and</strong>ards applicable in France.<br />
56 FINANCIAL REPORT AND REGISTRATION DOCUMENT <strong>2010</strong> GROUPE SEB
2<br />
CORPORATE GOVERNANCE<br />
STATUTORY AUDITORS<br />
STATUTORY AUDITORS<br />
STATUTORY AUDITORS<br />
PricewaterhouseCoopers Audit, 63 rue de Villiers<br />
Deloitte & Associés, 185 avenue Charles-de-Gaulle<br />
92200 Neuilly-sur-Seine<br />
92200 Neuilly-sur-Seine<br />
appointed at the Ordinary General Meeting of 13 May 2009,<br />
appointed at the Ordinary General Meeting of 13 May 2009,<br />
represented by Bernard Rascle.<br />
represented by Dominique Valette.<br />
Term: Ordinary General Meeting of 2015.<br />
Term: Ordinary General Meeting of 2015.<br />
Each of these Statutory auditors is a member of the Compagnie Régionale des Commissaires aux Comptes de Versailles.<br />
2<br />
SUBSTITUTE STATUTORY AUDITORS<br />
For PricewaterhouseCoopers Audit:<br />
Pierre Coll – 63, rue de Villiers, 92200 Neuilly-sur-Seine, France<br />
appointed at the Ordinary General Meeting of 13 May 2009.<br />
Term: Ordinary General Meeting of 2015.<br />
For Deloitte & Associés<br />
BEAS – 7/9, Villa Houssaye, 92200 Neuilly-sur-Seine, France<br />
appointed at the Ordinary General Meeting of 13 May 2009.<br />
Term: Ordinary General Meeting of 2015.<br />
GROUPE SEB<br />
FINANCIAL REPORT AND REGISTRATION DOCUMENT <strong>2010</strong><br />
57
2 STATUTORY<br />
CORPORATE GOVERNANCE<br />
AUDITORS<br />
FEES PAID TO STATUTORY AUDITORS<br />
The breakdown of fees paid to Statutory auditors <strong>and</strong> members of their networks is as follows:<br />
PricewaterhouseCoopers Audit<br />
Deloitte & Associés<br />
Audit Amount (Ex. VAT) As a % Amount (Ex. VAT) As a %<br />
(in € thous<strong>and</strong>s) <strong>2010</strong> 2009 <strong>2010</strong> 2009 <strong>2010</strong> 2009 <strong>2010</strong> 2009<br />
AUDIT<br />
Audit <strong>and</strong> certification of parent company<br />
<strong>and</strong> consolidated accounts<br />
SEB S.A., issuer coordination <strong>and</strong> consolidation 156 153 108 106<br />
Fully integrated subsidiaries 1,082 1,085 1,545 1,397<br />
Other procedures <strong>and</strong> services directly relating<br />
to audit assignment 23 21<br />
SEB S.A., issuer coordination <strong>and</strong> consolidation<br />
Fully integrated subsidiaries<br />
SUB-TOTAL 1,261 1,238 92% 88% 1,674 1,503 98% 95%<br />
OTHER SERVICES PERFORMED<br />
BY THE NETWORKS FOR FULLY INTEGRATED<br />
SUBSIDIARIES<br />
Legal, fiscal, corporate 112 64 37 35<br />
Information systems 36<br />
Others 0 97 0 3<br />
SUB-TOTAL 112 161 8% 12% 37 74 2% 5%<br />
TOTAL 1,373 1,399 100% 100% 1,711 1,577 100% 100%<br />
58 FINANCIAL REPORT AND REGISTRATION DOCUMENT <strong>2010</strong> GROUPE SEB
CONSOLIDATED FINANCIAL STATEMENTS<br />
3<br />
CONSOLIDATED<br />
FINANCIAL STATEMENTS<br />
FINANCIAL SUMMARY 60<br />
CONSOLIDATED RATIOS 61<br />
FINANCIAL STATEMENTS 62<br />
Consolidated income statement 62<br />
Statement of comprehensive income 62<br />
Balance sheet 63<br />
Consolidated cash flow statement 64<br />
Consolidated statement of changes in equity 65<br />
NOTES TO THE CONSOLIDATED<br />
FINANCIAL STATEMENTS 67<br />
Years ended 31 December, in millions of euros 67<br />
STATUTORY AUDITORS’ REPORT<br />
ON THE CONSOLIDATED<br />
FINANCIAL STATEMENTS 116<br />
Opinion on the consolidated financial statements 116<br />
Justification of our assessments 116<br />
Specific verification 116<br />
3<br />
GROUPE SEB<br />
FINANCIAL REPORT AND REGISTRATION DOCUMENT <strong>2010</strong><br />
59
3 FINANCIAL<br />
CONSOLIDATED FINANCIAL STATEMENTS<br />
SUMMARY<br />
FINANCIAL SUMMARY<br />
(in € millions) <strong>2010</strong> 2009 2008 2007 (i) 2006 (i) 2005<br />
IFRS (c) (i) 2004<br />
IFRS (b) 2004 (b) 2003 2002 (a) 2001<br />
RESULTS<br />
Sales in France 712 685 668 640 595 591 624 636 660 660 527<br />
Sales outside France 2,940 2,491 2,562 2,230 2,057 1,872 1,665 1,703 1,688 1,836 1,328<br />
Total sales 3,652 3,176 3,230 2,870 2,652 2,463 2,289 2,339 2,348 2,496 1,855<br />
Operating margin 438 355 342 301 262 262 261 248 234 217 175<br />
Operating profit 349 248 279 237 153 183 187 175 196 143 119<br />
Profit attributable to owners<br />
of the parent 220 146 152 145 87 102 131 123 148 118 74<br />
Depreciation, amortisation<br />
<strong>and</strong> impairment losses 117 124 110 88 97 114 85 91 86 95 83<br />
Employee benefits expense (d) 627 549 563 540 534 516 499 506 514 536 424<br />
Discretionary <strong>and</strong><br />
non-discretionary profit sharing<br />
<strong>and</strong> matching contributions<br />
to employee savings plans 50 33 38 33 26 29 34 34 36 51 29<br />
EBITDA (e) 468 372 388 329 247 291 270 259 278 230 196<br />
Adjusted EBITDA (h) 488 416 394 351 324 323 310 296 279 252 222<br />
BALANCE SHEET<br />
(AT 31 DECEMBER)<br />
Equity attributable to owners<br />
of the parent 1,512 1,169 992 814 770 757 644 642 557 471 464<br />
Net debt 131 243 649 658 422 423 331 331 189 327 404<br />
Non-current assets 1,249 1,163 1,184 1,060 766 773 679 624 476 481 535<br />
Capital expenditure 140 109 116 92 85 99 99 87 99 85 81<br />
Inventories 635 466 615 528 517 450 386 387 359 415 352<br />
Trade receivables 733 627 646 627 646 630 552 552 544 580 471<br />
Number of employees<br />
at 31 December 23,058 20,663 18,879 13,048 13,741 14,396 14,500 14,500 14,690 15,780 13,939<br />
PER SHARE DATA (IN €) (J)<br />
Total number of shares<br />
outst<strong>and</strong>ing (in thous<strong>and</strong>s) 49,952 49,952 50,912 50,881 51,057 50,940 51,228 51,228 46,347 46,317 46,320<br />
Weighted average number<br />
of shares, excluding treasury<br />
stock (in thous<strong>and</strong>s) 47,414 46,477 47,326 48,620 48,610 48,888 48,468 48,468 48,369 48,306 48,276<br />
Adjusted diluted earnings<br />
per share (g) 4.55 3.13 3.18 2.92 1.78 2.07 2.67 2.52 3.02 2.42 1.53<br />
Dividend per share (g) 1.17 1.04 0.94 0.93 0.85 0.80 0.80 0.80 0.76 0.65 0.61<br />
Dividend yield per share (in %) (f) (g) 1.51 2.62 4.38 2.26 2.37 2.61 3.04 3.04 2.52 2.56 3.19<br />
Share price: High (g) 82.78 40.53 44.00 48.15 38.07 30.88 35.73 35.73 32.12 29.11 20.85<br />
Low (g) 39.15 16.44 19.71 35.33 26.70 26.10 24.45 24.45 20.92 18.48 11.85<br />
Share price at 31 December 77.73 39.70 21.46 41.33 35.87 30.67 26.30 26.30 30.00 25.64 18.98<br />
Stock market capitalisation<br />
(in € millions) 3,882.8 1,983 1,093 2,103 1,831 1,562 1,347 1,347 1,529 1,306 967<br />
Average daily trading<br />
volume (number of shares) 107,282 88,830 117,527 127,638 75,681 63,243 87,183 87,183 85,608 74,664 65,547<br />
(a) Including the new Moulinex subsidiaries since 1 January 2002.<br />
(b) Including All-Clad since 28 July 2004.<br />
(c) Including Lagostina since 1 May 2005 <strong>and</strong> Panex since 1 June 2005.<br />
(d) Excluding discretionary <strong>and</strong> non-discretionary profit sharing <strong>and</strong> matching contributions to employee savings plans but including temporary staff costs. From 2004, the reported amounts also<br />
include the service cost of pension <strong>and</strong> other post-employment benefits.<br />
(e) Earnings before interest, taxes, depreciation <strong>and</strong> amortisation (including amortisation <strong>and</strong> impairment of goodwill <strong>and</strong> trademarks, <strong>and</strong> depreciation <strong>and</strong> amortisation expense reported under<br />
“Other operating income <strong>and</strong> expense”).<br />
(f) Dividend for the year expressed as a percentage of the closing share price at the year-end.<br />
(g) Adjusted for the March 2004 one-for-ten bonus share issue.<br />
(h) Earnings before interest, taxes, depreciation <strong>and</strong> amortisation (including amortisation <strong>and</strong> impairment of losses reported under “Other operating income <strong>and</strong> expense”).<br />
(i) The balance sheet <strong>and</strong> income statements for 2005, 2006 <strong>and</strong> 2007 were adjusted in subsequent years. The adjustments were not material.<br />
(j) Adjusted for the three-for-one stock-split.<br />
60 FINANCIAL REPORT AND REGISTRATION DOCUMENT <strong>2010</strong> GROUPE SEB
3<br />
CONSOLIDATED FINANCIAL STATEMENTS<br />
CONSOLIDATED RATIOS<br />
CONSOLIDATED RATIOS<br />
(in%) <strong>2010</strong> 2009 2008 2007 2006 (d) 2005 (c) 2004<br />
IFRS (b) 2004 2003 2002 (a) 2001 2000<br />
PROFITABILITY RATIOS<br />
Return on equity before<br />
appropriation of previous<br />
year’s profit 18.06 15.69 18.85 17.71 10.88 14.83 21.90 20.60 29.33 23.66 15.79 10.87<br />
Net margin 6.04 4.59 4.69 5.04 3.28 4.13 5.72 5.26 6.33 4.71 3.99 2.81<br />
FINANCIAL RATIOS<br />
Net debt/equity ratio 8.34 22.52 71.64 76.12 51.70 52.85 48.14 48.28 31.64 64.65 81.43 83.86<br />
Finance costs, net/Revenue 0.44 0.86 1.50 1.21 1.15 1.02 0.54 0.33 0.33 0.37 1.11 1.52<br />
Net debt/Adjusted EBITDA 0.27 0.59 1.65 1.87 1.30 1.31 1.07 1.11 0.68 1.30 1.83 1.87<br />
INVESTMENT RATIOS (e)<br />
Investments/Revenue 3.86 3.44 3.60 3.20 3.21 4.03 4.33 3.71 4.20 3.40 4.37 3.95<br />
(a) Including the new Moulinex subsidiaries.<br />
(b) Including All-Clad since 28 July 2004.<br />
(c) Including Lagostina since 1 May 2005 <strong>and</strong> Panex since 1 June 2005.<br />
(d) Including Mirro WearEver since 16 August 2006.<br />
(e) Excluding purchases of property, plant <strong>and</strong> equipment <strong>and</strong> software.<br />
3<br />
GROUPE SEB<br />
FINANCIAL REPORT AND REGISTRATION DOCUMENT <strong>2010</strong><br />
61
3 FINANCIAL<br />
CONSOLIDATED FINANCIAL STATEMENTS<br />
STATEMENTS<br />
FINANCIAL STATEMENTS<br />
CONSOLIDATED INCOME STATEMENT<br />
Years ended 31 December<br />
(in € millions) <strong>2010</strong> 2009 2008<br />
Revenue (Note 3) 3,651.8 3,176.3 3,230.2<br />
Operating expenses (Note 4) (3,213.9) (2,820.9) (2,888.5)<br />
OPERATING MARGIN 437.9 355.4 341.7<br />
Discretionary <strong>and</strong> non-discretionary profit-sharing (Note 5) (50.4) (33.5) (38.2)<br />
RECURRING OPERATING PROFIT 387.6 321.9 303.5<br />
Other operating income <strong>and</strong> expense (Note 6) (38.5) (73.8) (24.3)<br />
OPERATING PROFIT 349.0 248.1 279.2<br />
Finance costs (Note 7) (12.0) (22.6) (37.9)<br />
Other financial income <strong>and</strong> expense (Note 7) (3.9) (4.6) (10.7)<br />
Share of profits/(losses) of associates 0.0 0.0 (1.3)<br />
PROFIT BEFORE TAX 333.1 220.9 229.3<br />
Income tax expense (Note 8) (89.5) (58.1) (66.5)<br />
PROFIT FOR THE PERIOD 243.6 162.8 162.8<br />
Non-controlling interests (Note 20) (23.2) (16.8) (11.2)<br />
PROFIT ATTRIBUTABLE TO OWNERS OF THE PARENT 220.4 146.0 151.6<br />
EARNINGS PER SHARE (IN €)<br />
Basic earnings per share (Note 9) 4.65 3.14 3.20<br />
Diluted earnings per share (Note 9) 4.55 3.13 3.18<br />
The accompanying Notes 1 to 32 are an integral part of these consolidated financial statements.<br />
STATEMENT OF COMPREHENSIVE INCOME<br />
(in € millions) <strong>2010</strong> 2009 2008<br />
Profit for the period 243.6 162.8 162.8<br />
Exchange differences on translating foreign operations 111.6 8.2 23.9<br />
Gains (losses) on cash flow hedges 7.6 41.7 (35.3)<br />
Other comprehensive income 119.2 49.9 (11.4)<br />
COMPREHENSIVE INCOME 362.8 212.7 151.4<br />
Non-controlling interests (39.0) (12.0) (25.8)<br />
COMPREHENSIVE INCOME ATTRIBUTABLE TO OWNERS<br />
OF THE PARENT 323.8 200.7 125.6<br />
62 FINANCIAL REPORT AND REGISTRATION DOCUMENT <strong>2010</strong> GROUPE SEB
3<br />
CONSOLIDATED FINANCIAL STATEMENTS<br />
FINANCIAL STATEMENTS<br />
BALANCE SHEET<br />
At 31 December<br />
Assets<br />
(in € millions) <strong>2010</strong> 2009 2008<br />
Goodwill (Note 10) 409.1 386.6 419.8<br />
Other intangible assets (Note 10) 398.7 372.2 368.9<br />
Property, plant <strong>and</strong> equipment (Note 11) 426.5 391.4 381.2<br />
Investments in associates (Note 13) 0.1<br />
Other investments (Note 13) 0.6 0.5 0.7<br />
Other non-current financial assets (Note 13) 7.9 7.2 9.9<br />
Deferred tax assets (Note 8) 40.2 38.1 48.2<br />
Other non-current assets (Note 17) 4.2 5.0 2.9<br />
Non-current derivative instruments – assets (Note 25) 2.5 0.0 0.3<br />
NON-CURRENT ASSETS 1,289.7 1,201.0 1,232.0<br />
Inventories (Note 15) 635.5 466.3 614.6<br />
Trade receivables (Note 16) 733.9 627.1 645.6<br />
Other receivables (Note 17) 59.4 48.1 54.9<br />
Current tax assets 26.8 15.1 38.8<br />
Current derivative instruments – assets (Note 25) 14.1 5.2 11.7<br />
Cash <strong>and</strong> cash equivalents (Note 18) 236.6 307.8 224.6<br />
CURRENT ASSETS 1,706.3 1,469.6 1,590.1<br />
TOTAL ASSETS 2,996.0 2,670.6 2,822.1<br />
Equity <strong>and</strong> liabilities<br />
(in € millions) <strong>2010</strong> 2009 2008<br />
Share capital (Note 19) 50.0 50.0 50.9<br />
Reserves <strong>and</strong> retained earnings (Note 19) 1,409.9 1,140.1 1,005.7<br />
Treasury stock (Note 19) (61.7) (108.8) (150.7)<br />
EQUITY ATTRIBUTABLE TO OWNERS OF THE PARENT 1,398.2 1,081.3 905.9<br />
NON-CONTROLLING INTERESTS (NOTE 20) 173.1 138.8 131.6<br />
EQUITY 1,571.3 1,220.1 1,037.5<br />
Deferred tax assets (Note 8) 54.9 55.3 91.8<br />
Long-term provisions (Note 21) 120.0 111.3 102.3<br />
Long-term borrowings (Note 24) 201.8 301.1 213.5<br />
Other non-current liabilities (Note 23) 23.7 23.7 17.9<br />
Non-current derivative instruments – liabilities (Note 25) 0.3 2.7 21.5<br />
NON-CURRENT LIABILITIES 400.7 494.1 447.0<br />
Short-term provisions (Note 21) 78.3 86.9 77.2<br />
Trade payables (Note 23) 494.4 398.0 366.3<br />
Other current liabilities (Note 23) 250.8 195.7 177.3<br />
Current tax liabilities 24.6 18.0 25.6<br />
Current derivative instruments – liabilities (Note 25) 5.8 11.1 29.7<br />
Short-term borrowings (Note 24) 170.1 246.7 661.5<br />
CURRENT LIABILITIES 1,024.0 956.4 1,337.6<br />
TOTAL EQUITY AND LIABILITIES 2,996.0 2,670.6 2,822.1<br />
3<br />
The accompanying Notes 1 to 32 are an integral part of these consolidated financial statements.<br />
GROUPE SEB<br />
FINANCIAL REPORT AND REGISTRATION DOCUMENT <strong>2010</strong><br />
63
3 FINANCIAL<br />
CONSOLIDATED FINANCIAL STATEMENTS<br />
STATEMENTS<br />
CONSOLIDATED CASH FLOW STATEMENT<br />
Year ended 31 December<br />
(in € millions) <strong>2010</strong> 2009 2008<br />
PROFIT ATTRIBUTABLE TO OWNERS OF THE PARENT 220.4 146.0 151.6<br />
Depreciation/amortisation <strong>and</strong> impairment losses (Notes 10 <strong>and</strong> 11) 117.6 123.6 110.3<br />
Change in provisions (Note 21) (4.2) 17.6 (22.5)<br />
Unrealised gains <strong>and</strong> losses on financial instruments (Note 25) (8.4) 7.1 1.8<br />
Income <strong>and</strong> expenses related to stock options (Note 19.2) 6.2 6.0 7.2<br />
Gains <strong>and</strong> losses on disposals of assets 1.8 0.4 0.7<br />
Other 0.1 2.9<br />
Non-controlling interests (Note 20) 23.2 16.8 11.2<br />
Current <strong>and</strong> deferred taxes (Note 8) 89.4 58.1 66.5<br />
Finance costs, net (Note 7) 12.0 22.6 37.9<br />
CASH FLOW (a) 458.0 398.3 367.6<br />
Change in inventories (Note 15) (138.6) 155.9 (66.8)<br />
Change in trade receivables (Note 16) (67.4) 31.3 (24.3)<br />
Change in trade payables (Note 23) 82.1 28.1 0.6<br />
Change in other receivables <strong>and</strong> payables (Notes 17 <strong>and</strong> 23) 35.0 24.8 (0.3)<br />
Income taxes paid (100.9) (58.3) (76.7)<br />
Interest paid <strong>and</strong> received, net (12) (22.5) (35.6)<br />
NET CASH FROM OPERATING ACTIVITIES 256.1 557.6 164.5<br />
Proceeds from disposals of assets (Note 11) 20.9 6.5 8.6<br />
Purchases of property, plant <strong>and</strong> equipment (Note 11) (120.6) (92.2) (96.0)<br />
Purchases of software <strong>and</strong> other intangible assets (Note 10) (20.2) (17.0) (20.3)<br />
Purchases of financial assets (Note 13) 0.3 0.4 (2.8)<br />
Acquisitions of subsidiaries, net of the cash acquired (Note 2) 0.0 26.4<br />
Effects of other changes in scope of consolidation (Note 2) 0.1 (0.8)<br />
NET CASH USED BY INVESTING ACTIVITIES (119.6) (102.2) (84.9)<br />
Change in long-term borrowings (Note 24) (99.3) 87.6 146.7<br />
Change in short-term borrowings (Note 24) (80.1) (419.4) (65.2)<br />
Proceeds from issue of share capital, including minority interests<br />
(Note 19) 0.7 4.9<br />
Change in treasury stock (Note 19.4) 33.4 8.8 (43.5)<br />
Dividends paid, including to non-controlling shareholders (55.9) (50.2) (46.3)<br />
NET CASH USED BY FINANCING ACTIVITIES (201.9) (372.5) (3.4)<br />
Effect of changes in foreign exchange rates (5.8) 0.3 14.4<br />
NET INCREASE/(DECREASE) IN CASH AND CASH EQUIVALENTS (71.2) 83.2 90.6<br />
Cash <strong>and</strong> cash equivalents at beginning of period (Note 18) 307.8 224.6 134.0<br />
Cash <strong>and</strong> cash equivalents at end of period (Note 18) 236.6 307.8 224.6<br />
(a) Before interest <strong>and</strong> income taxes paid.<br />
64 FINANCIAL REPORT AND REGISTRATION DOCUMENT <strong>2010</strong> GROUPE SEB
3<br />
CONSOLIDATED FINANCIAL STATEMENTS<br />
FINANCIAL STATEMENTS<br />
CONSOLIDATED STATEMENT OF CHANGES IN EQUITY<br />
(in € millions)<br />
Share<br />
capital<br />
Share<br />
premium<br />
account<br />
Reserves<br />
<strong>and</strong> retained<br />
earnings<br />
Translation<br />
reserve<br />
Treasury<br />
stock<br />
Equity<br />
attributable<br />
to owners of<br />
the parent<br />
Noncontrolling<br />
interests<br />
AT 31 DECEMBER 2007 50.9 107.3 798.2 16.2 (108.6) 864.0 0.0 864.0<br />
Profit/(loss) for the period 151.6 151.6 11.2 162.8<br />
Other comprehensive income (35.3) 9.3 (26.0) 14.6 (11.4)<br />
Comprehensive income 0.0 0.0 116.3 9.3 0.0 125.6 25.8 151.4<br />
Dividends paid (46.1) (46.1) (0.2) (46.3)<br />
Issue of share capital 0.6 0.6 0.6<br />
Reduction of share capital 0.0 0.0<br />
Changes in treasury stock (42.1) (42.1) (42.1)<br />
Gains (losses) on sales of treasury stock,<br />
after tax (1.0) (1.0) (1.0)<br />
Exercise of stock options 5.9 5.9 1.3 7.2<br />
Other movements (a) (1.0) (1.0) 104.7 103.7<br />
AT 31 DECEMBER 2008 50.9 107.9 872.3 25.5 (150.7) 905.9 131.6 1,037.5<br />
Profit/(loss) for the period 145.9 145.9 16.9 162.8<br />
Other comprehensive income 41.7 13.0 54.7 (4.8) 49.9<br />
Comprehensive income 0.0 0.0 187.6 13.0 0.0 200.6 12.1 212.7<br />
Dividends paid (45.4) (45.4) (4.8) (50.2)<br />
Issue of share capital 0.7 0.7 0.7<br />
Reduction of share capital 0.0 0.0<br />
Changes in treasury stock (0.9) (29.7) 41.9 11.3 11.3<br />
Gains (losses) on sales of treasury stock,<br />
after tax (2.5) (2.5) (2.5)<br />
Exercise of stock options 6.0 6.0 6.0<br />
Other movements 4.7 4.7 (0.1) 4.6<br />
AT 31 DECEMBER 2009 (NOTE 19) 50.0 78.9 1,022.7 38.5 (108.8) 1,081.3 138.8 1,220.1<br />
2009 recommended dividend 0.0<br />
At 31 December 2009 after appropriation 50.0 78.9 1,022.7 38.5 (108.8) 1,081.3 138.8 1,220.1<br />
Profit/(loss) for the period 220.4 220.4 23.2 243.6<br />
Other comprehensive income 7.6 95.8 103.4 15.8 119.2<br />
Comprehensive income 0.0 0.0 228.0 95.8 0.0 323.8 39.0 362.8<br />
Dividends paid (51.2) (51.2) (4.7) (55.9)<br />
Issue of share capital 0.0 0.0<br />
Reduction of share capital 0.0 0.0<br />
Changes in treasury stock 47.1 47.1 47.1<br />
Gains (losses) on sales of treasury stock,<br />
after tax (9.0) (9.0) (9.0)<br />
Exercise of stock options 6.2 6.2 6.2<br />
Other movements (1.4) 1.4 0.0 0.0<br />
AT 31 DECEMBER <strong>2010</strong> (NOTE 19) 50.0 78.9 1,195.3 135.7 (61.7) 1,398.2 173.1 1,571.3<br />
<strong>2010</strong> recommended dividend (59) (59) (59)<br />
AT 31 DECEMBER <strong>2010</strong> AFTER<br />
APPROPRIATION 50.0 78.9 1,136.3 135.7 (61.7) 1,339.2 173.1 1,512.3<br />
Equity<br />
3<br />
(a) “’Other movements” for 2008 mainly correspond to non-controlling interests in ZJ Supor, which was fully consolidated as from 1 January 2008.<br />
GROUPE SEB<br />
FINANCIAL REPORT AND REGISTRATION DOCUMENT <strong>2010</strong><br />
65
3 FINANCIAL<br />
CONSOLIDATED FINANCIAL STATEMENTS<br />
STATEMENTS<br />
CONTENTS<br />
NOTE 1 SUMMARY OF SIGNIFICANT ACCOUNTING POLICIES 67<br />
1.1. Basis <strong>and</strong> scope of consolidation 68<br />
1.2. Foreign currency translation 68<br />
1.3. Use of estimates 68<br />
1.4. Accounting policies <strong>and</strong> valuation methods 69<br />
1.5. Income statement presentation 72<br />
NOTE 2 CHANGES IN THE SCOPE OF CONSOLIDATION 73<br />
2.1. Changes in <strong>2010</strong> 73<br />
2.2. Changes in 2009 73<br />
2.3. Changes in 2008 73<br />
NOTE 3 SEGMENT INFORMATION 75<br />
3.1. Geographical segment information (by location of assets) 75<br />
3.2. Revenue by geographical location of the customer 77<br />
NOTE 4 OPERATING EXPENSES 78<br />
NOTE 5 EMPLOYEE BENEFITS EXPENSE 78<br />
NOTE 6 OTHER OPERATING INCOME AND EXPENSE 79<br />
6.1. Restructuring costs 79<br />
6.2. Impairment losses 79<br />
6.3. Gains <strong>and</strong> losses on asset disposals <strong>and</strong> other 80<br />
NOTE 7<br />
FINANCE COSTS AND OTHER FINANCIAL INCOME<br />
AND EXPENSE, NET 81<br />
NOTE 8 INCOME TAXES 81<br />
8.1. Income tax expense 81<br />
8.2. Effective tax rate 81<br />
8.3. Deferred tax assets <strong>and</strong> liabilities 82<br />
8.4. Other information 82<br />
NOTE 9 EARNINGS PER SHARE 83<br />
NOTE 10 INTANGIBLE ASSETS 83<br />
NOTE 11 PROPERTY, PLANT AND EQUIPMENT 86<br />
NOTE 12 LEASES 88<br />
NOTE 13<br />
INVESTMENTS IN ASSOCIATES, OTHER<br />
INVESTMENTS AND OTHER NON-CURRENT<br />
FINANCIAL ASSETS 88<br />
13.1. Investments 88<br />
13.2. Other non-current fi nancial assets 88<br />
NOTE 14 PRODUCT DEVELOPMENT COSTS 89<br />
NOTE 20 NON-CONTROLLING INTERESTS 93<br />
NOTE 21 PROVISIONS 93<br />
21.1. Product warranties 94<br />
21.2. Claims <strong>and</strong> litigation <strong>and</strong> other contingencies 94<br />
21.3. Restructuring provisions 94<br />
NOTE 22 EMPLOYEE BENEFITS 95<br />
22.1. Assumptions 95<br />
22.2. Analysis of pension <strong>and</strong> other post-employment benefi t obligations 96<br />
22.3. Recognised cost 97<br />
22.4. Movements in provisions 97<br />
22.5. Movements in pension <strong>and</strong> other post-employment benefi t<br />
obligations 98<br />
22.6. Analysis of plan assets 99<br />
22.7. Early retirement schemes 99<br />
NOTE 23 TRADE AND OTHER PAYABLES 100<br />
NOTE 24 BORROWINGS 100<br />
24.1. Total borrowings 100<br />
24.2. Net debt 102<br />
NOTE 25 FAIR VALUE OF FINANCIAL INSTRUMENTS 102<br />
25.1. <strong>Financial</strong> instruments 102<br />
25.2. Derivative instruments 104<br />
25.3. Information on assets <strong>and</strong> fi nancial liabilities measured at fair<br />
value 105<br />
NOTE 26 MARKET RISK MANAGEMENT 105<br />
26.1. Risk management 105<br />
26.2. Market risks 105<br />
26.3. Liquidity risk 108<br />
26.4. Credit risk 109<br />
NOTE 27 ENVIRONMENTAL EXPENDITURE 109<br />
NOTE 28 OFF-BALANCE SHEET COMMITMENTS 110<br />
28.1. Specifi c commitments 110<br />
28.2. Commitments arising in the ordinary course of business 110<br />
NOTE 29 CONTINGENT ASSETS AND LIABILITIES 110<br />
29.1. Contingent assets 110<br />
29.2. Contingent liabilities 111<br />
NOTE 30 RELATED PARTY TRANSACTIONS 111<br />
30.1. Transactions with non-consolidated companies 111<br />
30.2. Management remuneration <strong>and</strong> benefi ts 112<br />
NOTE 31 SUBSEQUENT EVENTS 112<br />
NOTE 15 INVENTORIES 89<br />
NOTE 16 TRADE RECEIVABLES 89<br />
NOTE 17 OTHER RECEIVABLES 90<br />
NOTE 18 CASH AND CASH EQUIVALENTS 90<br />
NOTE 32<br />
LIST OF CONSOLIDATED COMPANIES AT<br />
31 DECEMBER <strong>2010</strong> (SHOWING THE % INTEREST<br />
HELD BY THE GROUP) 113<br />
32.1. Fully consolidated companies 113<br />
32.2. Associates 115<br />
32.3. Non-consolidated companies 115<br />
NOTE 19 EQUITY 90<br />
19.1. Share capital 90<br />
19.2. Stock options <strong>and</strong> performance shares 91<br />
19.3. Reserves <strong>and</strong> retained earnings (before appropriation of profi t) 92<br />
19.4. Treasury stock 92<br />
66 FINANCIAL REPORT AND REGISTRATION DOCUMENT <strong>2010</strong> GROUPE SEB
3<br />
CONSOLIDATED FINANCIAL STATEMENTS<br />
NOTES TO THE CONSOLIDATED FINANCIAL STATEMENTS<br />
NOTES TO THE CONSOLIDATED<br />
FINANCIAL STATEMENTS<br />
YEARS ENDED 31 DECEMBER, IN MILLIONS OF EUROS<br />
SEB S.A. (“the Company”) <strong>and</strong> its subsidiaries (together “<strong>Groupe</strong> SEB” or<br />
“the Group”) are a world leader in the design, manufacture <strong>and</strong> marketing of<br />
cookware <strong>and</strong> small household appliances such as pressure cookers, irons<br />
<strong>and</strong> steam generators, kettles, coffee machines, deep fat fryers, toasters<br />
<strong>and</strong> food processors.<br />
SEB S.A.’s registered office is at Chemin du Petit Bois, Ecully (69130<br />
Rhône, France). The Company is listed on Eurolist by Euronext Paris (ISIN<br />
FR0000121709).<br />
NOTE 1<br />
SUMMARY OF SIGNIFICANT ACCOUNTING POLICIES<br />
The consolidated financial statements were approved for publication by the<br />
Board of Directors on 25 February 2011.<br />
As a company listed in a European Union country <strong>and</strong> in compliance with<br />
European Commission regulation 1606/2002/EC dated 19 July 2002, the<br />
<strong>2010</strong> consolidated financial statements <strong>and</strong> the 2009 <strong>and</strong> 2008 comparative<br />
information have been prepared in accordance with the International<br />
Accounting St<strong>and</strong>ards (IASs) <strong>and</strong> International <strong>Financial</strong> <strong>Report</strong>ing<br />
St<strong>and</strong>ards (IFRSs) adopted by the European Union as of 31 December <strong>2010</strong>,<br />
including the interpretations issued by the International <strong>Financial</strong> <strong>Report</strong>ing<br />
Interpretations Committee (IFRIC) <strong>and</strong> its predecessor, the St<strong>and</strong>ing<br />
Interpretations Committee (SIC). These documents can be downloaded from<br />
the European Commission’s website, http://ec.europa.eu/internal_market/<br />
accounting/ias_en.htm.<br />
New IFRSs applicable in <strong>2010</strong><br />
The following st<strong>and</strong>ards, amendments <strong>and</strong> interpretations applicable since<br />
1 January <strong>2010</strong> have no material impact on the Group s financial statements.<br />
Revised IAS 27 <strong>and</strong> revised IFRS 3 will only be applied to transactions carried<br />
out since 1 January <strong>2010</strong>.<br />
IFRS 3 (revised) – Business Combinations, applicable prospectively.<br />
The revised st<strong>and</strong>ard introduces a number of changes to the acquisition<br />
method of accounting for business combinations. These changes notably<br />
include the immediate recording of acquisition costs as expenses, the<br />
option of applying the full goodwill method <strong>and</strong> the potential recognition<br />
of more intangible assets;<br />
IAS 27 (revised) – Separate <strong>and</strong> Consolidated <strong>Financial</strong> Statements.<br />
The revised st<strong>and</strong>ard significantly revises the method of accounting for<br />
changes in ownership interests. Under the revised st<strong>and</strong>ard, in the case<br />
of a change in ownership interest that leads to the loss or acquisition of<br />
control, the previously held interest will be measured at the disposal or<br />
acquisition date fair value <strong>and</strong> the resulting gain or loss will be recognised<br />
in the income statement. Increases <strong>and</strong> decreases in ownership interest<br />
that do not affect control will be treated as a change in equity between<br />
the Group <strong>and</strong> non-controlling interests <strong>and</strong> no goodwill will arise on any<br />
increase <strong>and</strong> no gain or loss will be recognized on any decrease;<br />
amendment to IAS 39 – Exposures Qualifying for Hedge Accounting.<br />
This amendment describes the circumstances in which hedge accounting<br />
is permitted;<br />
amendments to IFRIC 9 <strong>and</strong> IAS 39 – Reassessment of Embedded<br />
Derivatives <strong>and</strong> <strong>Financial</strong> instruments. Entities that reclassified financial<br />
assets out of the trading portfolio under the October 2008 amendment to<br />
IAS 39 are now required to reassess <strong>and</strong>, if necessary, separately account<br />
for any embedded derivatives. This amendment does not affect the Group;<br />
IFRIC 16 – Hedges of a Net Investment in a Foreign Operation.<br />
This interpretation clarifies the method of hedging foreign currency<br />
exposure within a group;<br />
IFRIC 17 – Distributions of Non-Cash Assets to Owners (prospective<br />
application). This interpretation specifies the method of recognising this<br />
type of distribution;<br />
amendment to IFRS 2 – Share-based Payment: Group Cash-settled<br />
Share-based Payment Transactions. This amendment specifies the<br />
accounting treatment to be used in the subsidiary’s separate fi nancial<br />
statements;<br />
annual improvements to IFRSs (16 April 2009): mainly concern disclosures<br />
to be made in the notes under IFRS 5 <strong>and</strong> IFRS 8, the classification of<br />
l<strong>and</strong> leases (IAS 17), <strong>and</strong> amendments to existing st<strong>and</strong>ards pursuant to<br />
the publication of IFRS 3R <strong>and</strong> IAS 27R.<br />
New st<strong>and</strong>ards not early adopted<br />
The following new st<strong>and</strong>ards, interpretations <strong>and</strong> amendments to existing<br />
st<strong>and</strong>ards that are applicable for annual periods beginning on or after<br />
1 January 2011 were not early adopted in <strong>2010</strong>. They are not expected to<br />
have any material impact on the consolidated financial statements.<br />
IAS 24 (revised) – Related Party Disclosures. The revised st<strong>and</strong>ard clarifies<br />
the definition of related party <strong>and</strong> extends the disclosure requirements to<br />
commitments as well as transactions;<br />
amendment to IAS 32 – <strong>Financial</strong> Instruments. The amendment mainly<br />
concerns the classification of rights issues in a currency other than the<br />
issuer’s functional currency;<br />
3<br />
GROUPE SEB<br />
FINANCIAL REPORT AND REGISTRATION DOCUMENT <strong>2010</strong><br />
67
3 NOTES<br />
CONSOLIDATED FINANCIAL STATEMENTS<br />
TO THE CONSOLIDATED FINANCIAL STATEMENTS<br />
amendment to IFRIC 14 – Prepayments of a Minimum Funding<br />
Requirement. The amendment specifies that any prepayments of a<br />
minimum funding requirement under defined benefit plans must be<br />
recognised as an asset in the same way as any other prepayment;<br />
IFRIC 19 – Extinguishing <strong>Financial</strong> Liabilities with Equity Instruments.<br />
This interpretation provides guidance on accounting for agreements<br />
to settle a fi nancial liability fully or partially with shares or other equity<br />
instruments.<br />
1.1. BASIS AND SCOPE OF CONSOLIDATION<br />
Material companies that are exclusively controlled by SEB S.A. either directly<br />
or indirectly are fully consolidated.<br />
The profi ts of subsidiaries acquired or disposed of during the year are<br />
recognised in the consolidated income statement from the acquisition date<br />
or up to the disposal date.<br />
Where necessary, the financial statements of subsidiaries are restated to<br />
comply with Group accounting policies.<br />
Material companies over which SEB S.A. exercises signifi cant infl uence,<br />
directly or indirectly, are accounted for by the equity method. At 31 December<br />
<strong>2010</strong>, no entities were accounted for by the equity method.<br />
Certain companies fulfilling the above criteria are not consolidated because<br />
they are not material in relation to the Group as a whole. The materiality<br />
criteria applied by the Group are as follows:<br />
revenue of at least €10 million;<br />
total assets of at least €10 million;<br />
total debt of at least €5 million.<br />
The list of consolidated companies is presented in Note 32.<br />
All material intra-group transactions have been eliminated in consolidation.<br />
1.2. FOREIGN CURRENCY TRANSLATION<br />
1.2.1. Translation of the financial statements<br />
of foreign operations<br />
The financial statements of foreign entities are prepared in their functional<br />
currency, corresponding to the currency of the primary economic environment<br />
in which the entity operates. The functional currency of most foreign entities<br />
is their local currency.<br />
The euro is the Group’s functional currency <strong>and</strong> reporting currency.<br />
The financial statements of foreign entities are translated into euros by the<br />
closing rate method, as follows:<br />
assets <strong>and</strong> liabilities in a functional currency other than the euro are<br />
translated at the closing rate at the balance sheet date <strong>and</strong> income<br />
statement items are translated at the weighted average rate for the year;<br />
the resulting exchange differences are recognised as a separate<br />
component of equity, under “Translation reserve”.<br />
The financial statements of subsidiaries whose functional currency is not the<br />
local accounting currency are initially translated into the functional currency<br />
using the historical rate method, as follows:<br />
non-monetary assets <strong>and</strong> liabilities (non-current assets, inventories <strong>and</strong><br />
securities) <strong>and</strong> the corresponding movements recorded in the income<br />
statement are translated at the historical exchange rate;<br />
monetary assets <strong>and</strong> liabilities (cash, short <strong>and</strong> long-term loans <strong>and</strong><br />
borrowings, operating receivables <strong>and</strong> payables) are translated at the<br />
closing rate at the balance sheet date;<br />
income statement items are translated at the weighted average rate for<br />
the year, apart from depreciation, amortisation <strong>and</strong> impairment losses on<br />
non-monetary items;<br />
the resulting exchange differences are recognised in the income statement.<br />
These financial statements in the functional currency are then translated into<br />
euros using the closing rate method.<br />
In accordance with the option available to first-time adopters under IFRS 1,<br />
<strong>Groupe</strong> SEB elected to reset to zero at 1 January 2004 the cumulative<br />
translation differences arising on consolidation of foreign entities.<br />
1.2.2. Translation of foreign currency transactions<br />
Foreign currency transactions are recognised <strong>and</strong> measured in accordance<br />
with IAS 21 – The Effects of Changes in Foreign Exchange Rates.<br />
Transactions in currencies other than the euro are initially recognised at<br />
the exchange rate prevailing on the transaction date. Monetary assets <strong>and</strong><br />
liabilities denominated in currencies other than the euro are translated at the<br />
closing exchange rate, <strong>and</strong> the resulting exchange differences are recognised<br />
in the income statement.<br />
The effect of changes in exchange rates on the fair value of non-monetary<br />
fi nancial assets <strong>and</strong> liabilities is recognised by the accounting method<br />
applied to the category of financial assets or liabilities concerned.<br />
Monetary fi nancial assets are measured at amortised cost in the original<br />
currency <strong>and</strong> changes in amortised cost corresponding to exchange<br />
differences are recognised in the income statement, while other changes<br />
are recognised directly in equity.<br />
The Group’s exposure to certain currency risks is hedged using forward<br />
contracts <strong>and</strong> options (see Note 1.4.4 c) Derivative Instruments).<br />
1.3. USE OF ESTIMATES<br />
The preparation of consolidated fi nancial statements in accordance with<br />
IFRS requires the use of estimates <strong>and</strong> assumptions that have an impact<br />
on the reported amounts of assets <strong>and</strong> liabilities – such as accumulated<br />
depreciation, amortisation <strong>and</strong> impairment losses – <strong>and</strong> contingent assets<br />
<strong>and</strong> liabilities at the balance sheet date <strong>and</strong> income <strong>and</strong> expenses for the<br />
year.<br />
All such estimates are made on a going concern basis using the information<br />
available when the financial statements are drawn up. They reflect amounts<br />
<strong>and</strong> assumptions that management considers relevant <strong>and</strong> reasonable given<br />
the Group’s operating environment <strong>and</strong> past experience. In the current<br />
economic environment, short <strong>and</strong> medium-term forecasting has become<br />
more diffi cult. The estimates <strong>and</strong> assumptions used to prepare the <strong>2010</strong><br />
consolidated financial statements reflected the financial parameters shaping<br />
the market at 31 December. The value of certain assets, such as goodwill<br />
<strong>and</strong> trademarks, was estimated at the year-end based on the long-term<br />
economic outlook <strong>and</strong> management’s best estimates, taking into account<br />
the reduced visibility of future cash flows.<br />
68 FINANCIAL REPORT AND REGISTRATION DOCUMENT <strong>2010</strong> GROUPE SEB
3<br />
CONSOLIDATED FINANCIAL STATEMENTS<br />
NOTES TO THE CONSOLIDATED FINANCIAL STATEMENTS<br />
The assumptions used – which mainly concern impairment tests on<br />
non-current assets – <strong>and</strong> the sensitivity of reported amounts to changes in<br />
these assumptions are presented in the relevant notes to these consolidated<br />
financial statements, in accordance with IAS 36.<br />
Estimates are adjusted following any change in the circumstances on which<br />
they were based or when any new information comes to light. Actual results<br />
may differ from these estimates <strong>and</strong> assumptions.<br />
The main estimates <strong>and</strong> assumptions used to prepare the consolidated<br />
financial statements concern the measurement of pension <strong>and</strong> other<br />
post-employment benefit obligations (Note 22.1), deferred taxes (Note 1.4.9),<br />
property, plant <strong>and</strong> equipment (Note 1.4.3), intangible assets (Notes 1.4.1 <strong>and</strong><br />
10), investments in associates <strong>and</strong> other investments, impairment of current<br />
assets (Notes 1.4.5 <strong>and</strong> 1.4.6), short <strong>and</strong> long-term provisions (Notes 1.4.10<br />
<strong>and</strong> 1.4.11), certain financial instruments (Note 1.4.4 – Derivative instruments)<br />
<strong>and</strong> share-based payments (Note 1.4.10).<br />
1.4. ACCOUNTING POLICIES AND VALUATION<br />
METHODS<br />
The financial statements of Group companies are prepared in accordance<br />
with local generally accepted accounting principles. They are restated where<br />
necessary to comply with Group accounting policies.<br />
The notes to the consolidated financial statements include analyses of assets<br />
<strong>and</strong> liabilities by maturity where disclosure of this information is required<br />
under IFRS.<br />
The methods used to measure intangible assets, property, plant <strong>and</strong><br />
equipment, inventories <strong>and</strong> trade receivables are described below.<br />
1.4.1. Intangible assets<br />
A) DEVELOPMENT COSTS<br />
Under IAS 38 – Intangible Assets, research costs are recognised as an<br />
expense <strong>and</strong> development costs are recognised as an intangible asset when<br />
the Group can demonstrate (IAS 38, paragraph 57):<br />
its intention to complete the development project;<br />
that it is probable that the expected future economic benefits attributable<br />
to the asset will flow to the Group;<br />
its ability to measure reliably the cost of the asset.<br />
Development costs that do not fulfi l the above criteria are expensed as<br />
incurred.<br />
In the consolidated fi nancial statements, qualifying development costs<br />
incurred after the advance design phase <strong>and</strong> before the manufacturing phase<br />
are recognised as intangible assets.<br />
Development costs are amortised on a straight-line basis over three to<br />
five years, corresponding to the same useful life as that applied to specific<br />
tooling.<br />
B) OTHER INTANGIBLE ASSETS<br />
Software licences <strong>and</strong> internal software development costs are recognised as<br />
intangible assets when it is probable that they will generate future economic<br />
benefits. They are amortised by the straight-line method over periods ranging<br />
from three to five years. Other software licences <strong>and</strong> software development<br />
costs are expensed as incurred.<br />
Patents, licences <strong>and</strong> trademarks with a finite useful life are amortised over<br />
the shorter of the period of legal protection <strong>and</strong> their expected useful life,<br />
not to exceed fifteen years.<br />
Trademarks with an indefinite useful life are not amortised but are tested<br />
for impairment.<br />
C) GOODWILL<br />
Goodwill, corresponding to the excess of the Group’s interest in net fair value<br />
of the identifiable assets <strong>and</strong> liabilities acquired in a business combination<br />
over the consideration transferred, is recognised in the balance sheet as<br />
an asset under “goodwill”. The consideration transferred is measured as<br />
the fair value of assets transferred, equity instruments issued <strong>and</strong> liabilities<br />
incurred by the acquirer to the former owner on the acquisition date, plus any<br />
contingent consideration. In the case of a business combination achieved in<br />
stages, the difference between the carrying amount of the previously held<br />
interest <strong>and</strong> its acquisition-date fair value is recognised directly in profit or<br />
loss on the acquisition date.<br />
For each business combination, any non-controlling interest in the acquiree<br />
may be measured either at fair value on the acquisition date (full goodwill<br />
method) or at the non-controlling interest’s proportionate share of the<br />
acquiree’s identifiable net assets (partial goodwill method).<br />
The fair values provisionally attributed to identifiable assets <strong>and</strong> liabilities,<br />
non-controlling interests measured at fair value <strong>and</strong> the various components<br />
of the consideration transferred may be adjusted for a period of twelve<br />
months after the acquisition date. After that period, any adjustments are<br />
recognised prospectively in profit or loss with no adjustment to goodwill.<br />
Goodwill is not amortised but is tested for impairment at least once a year.<br />
For impairment testing purposes, goodwill is allocated to a Cash-Generating<br />
Unit (CGU), defined as the smallest identifiable group of assets that generates<br />
cash infl ows that are largely independent of the cash infl ows from other<br />
assets or groups of assets<br />
The method used to test CGUs for impairment is described in Note 1.4.3.<br />
When a CGU is found to be impaired, an impairment loss corresponding<br />
to the difference between the carrying amount of the goodwill <strong>and</strong> its<br />
recoverable amount is recognised in “Other operating expense”. Impairment<br />
losses on goodwill are not reversible.<br />
Negative goodwill is recognised directly in the income statement for the<br />
period of acquisition <strong>and</strong> attributed in full to the acquirer.<br />
1.4.2. Property, plant <strong>and</strong> equipment<br />
Property, plant <strong>and</strong> equipment are initially recognised at cost <strong>and</strong> are<br />
depreciated by the straight-line method over their estimated useful lives.<br />
Maintenance <strong>and</strong> repair costs are expensed as incurred.<br />
The main useful lives are as follows:<br />
buildings:<br />
10 to 40 years;<br />
plant <strong>and</strong> machinery:<br />
10 years;<br />
office equipment:<br />
3 to 10 years;<br />
vehicles:<br />
4 to 5 years;<br />
tooling:<br />
1 to 5 years.<br />
Each significant part of an item of property, plant <strong>and</strong> equipment with a useful<br />
life that is different from that of the asset to which it belongs is depreciated<br />
separately. Useful lives are reviewed at regular intervals <strong>and</strong> the effect of<br />
any adjustments – corresponding to a change in accounting estimates – is<br />
applied prospectively.<br />
3<br />
GROUPE SEB<br />
FINANCIAL REPORT AND REGISTRATION DOCUMENT <strong>2010</strong><br />
69
3 NOTES<br />
CONSOLIDATED FINANCIAL STATEMENTS<br />
TO THE CONSOLIDATED FINANCIAL STATEMENTS<br />
No items of property, plant or equipment have been revalued.<br />
In accordance with IAS 17 – Leases, finance leases that transfer substantially<br />
all the risks <strong>and</strong> rewards incidental to ownership of an asset are recognised<br />
in property, plant <strong>and</strong> equipment for an amount corresponding to the lower<br />
of the fair value of the leased asset <strong>and</strong> the present value of the minimum<br />
lease payments.<br />
A liability for the same amount is recorded under “Finance lease liabilities”.<br />
1.4.3. Impairment of long-lived assets<br />
Under IAS 36 – Impairment of Assets, the recoverable amount of property,<br />
plant <strong>and</strong> equipment <strong>and</strong> intangible assets must be measured at each<br />
period-end or whenever there is an indication that the asset may be impaired.<br />
Assets with an indefinite life – corresponding in the case of <strong>Groupe</strong> SEB to<br />
goodwill <strong>and</strong> trademarks – are tested for impairment at least once a year.<br />
Assets with a finite life are tested whenever events or circumstances indicate<br />
that their carrying amount may not be recovered.<br />
Impairment tests are performed at the level of each Cash-Generating<br />
Unit (CGU). A CGU is defined as the smallest identifiable group of assets<br />
that generates cash inflows that are largely independent of the cash inflows<br />
from other assets or groups of assets. The fair value of CGUs is determined<br />
by the discounted cash fl ows method. An impairment loss is recognised<br />
for any excess of an asset’s carrying amount over its recoverable amount.<br />
Recoverable amount corresponds to the higher of the asset’s fair value less<br />
costs to sell <strong>and</strong> its value in use. The impairment loss is allocated to reduce<br />
the carrying amount of goodwill <strong>and</strong> then ratably to the other assets of the<br />
CGU based on their respective carrying amounts.<br />
The capitalised amount of development projects in progress is also tested<br />
for impairment.<br />
Impairment losses on CGUs <strong>and</strong> on assets with an indefinite useful life are<br />
recorded in “Other operating expense”.<br />
At <strong>Groupe</strong> SEB, CGUs correspond to individual production sites, broken<br />
down where appropriate by product family. The assets allocated to each<br />
CGU correspond mainly to tooling <strong>and</strong> other manufacturing assets (primarily<br />
buildings <strong>and</strong> machinery). Marketing subsidiaries <strong>and</strong> integrated<br />
manufacturing <strong>and</strong> sales entities are each treated as separate CGUs, but<br />
marketing subsidiaries that share resources are combined in a single CGU.<br />
Provisions for impairment of non-fi nancial assets other than goodwill are<br />
reviewed at each annual <strong>and</strong> interim period-end <strong>and</strong> adjusted as necessary.<br />
1.4.4. <strong>Financial</strong> instruments<br />
<strong>Financial</strong> instruments are accounted for in accordance with IAS 39 – <strong>Financial</strong><br />
Instruments: Recognition <strong>and</strong> Measurement.<br />
<strong>Financial</strong> assets <strong>and</strong> liabilities are recognised in the balance sheet when<br />
the Group becomes a party to the contractual provisions of the instrument.<br />
They are initially recognised at cost, corresponding to the fair value of the<br />
consideration paid or received plus external transaction costs that are<br />
directly attributable to the acquisition or issue of the fi nancial asset or<br />
financial liability.<br />
A) FINANCIAL ASSETS<br />
<strong>Financial</strong> assets consist of shares in subsidiaries <strong>and</strong> affiliates, as well as<br />
operating receivables, debt securities <strong>and</strong> other cash equivalents classified<br />
as current assets.<br />
Available-for-sale financial assets are assets that are intended to be held<br />
for an indefi nite period but which may be sold in response to changes<br />
in market interest rates or liquidity needs. They comprise investments in<br />
non-consolidated companies.<br />
At each period-end, they are measured at fair value <strong>and</strong> the resulting<br />
unrealised gain or loss is recognised directly in equity. When the assets are<br />
sold or there is objective evidence of impairment, the cumulative gains <strong>and</strong><br />
losses previously recognised in equity are reclassified to profit.<br />
Held-to-maturity investments are financial assets with a fixed maturity<br />
that the Group has the positive intention <strong>and</strong> ability to hold to maturity.<br />
They are measured at amortised cost, determined by the effective interest<br />
method.<br />
B) FINANCIAL LIABILITIES<br />
<strong>Financial</strong> liabilities comprise borrowings <strong>and</strong> other financing, including bank<br />
overdrafts, <strong>and</strong> operating liabilities.<br />
Borrowings <strong>and</strong> other financial liabilities are measured at amortised cost,<br />
determined by the effective interest method.<br />
When interest rate risks on financial liabilities are hedged by swaps qualifying<br />
as cash flow hedges, the swaps are also recognised in the balance sheet at<br />
fair value. The effective portion of changes in their fair value is recognised<br />
directly in equity <strong>and</strong> the ineffective portion is recognised in profit.<br />
C) DERIVATIVE INSTRUMENTS<br />
Market risks (interest rate, currency <strong>and</strong> commodity price risks) are hedged,<br />
generally through the use of derivative instruments.<br />
In accordance with IAS 32 <strong>and</strong> IAS 39, derivative instruments are measured<br />
at fair value.<br />
The accounting treatment of changes in fair value depends on the future use<br />
of the derivative <strong>and</strong> the resulting accounting classification.<br />
Derivative instruments designated as the hedging instrument in a hedging<br />
relationship may be classified as either fair value or cash flow hedges.<br />
a fair value hedge is a hedge of the exposure to changes in fair value of<br />
a recognised asset or liability or an unrecognised firm commitment that<br />
is attributable to a particular risk <strong>and</strong> could affect profit;<br />
a cash flow hedge is a hedge of the exposure to variability in cash flows<br />
that is attributable to a particular risk associated with a recognised asset<br />
or liability or a highly probable forecast transaction <strong>and</strong> could affect profit.<br />
The gain or loss arising from remeasurement at fair value of derivative<br />
instruments designated as fair value hedges is recognised in profit, offsetting<br />
all or part of the gain or loss recognised on the hedged item.<br />
In the case of cash fl ow hedges, the effective portion of the gain or loss<br />
arising from remeasurement of the derivative instrument at fair value is<br />
recognised in equity <strong>and</strong> the ineffective portion is recognised in profi t.<br />
The cumulative gains <strong>and</strong> losses on cash flow hedges recognised directly<br />
in equity are reclassified into profit when the hedged item affects profit.<br />
Hedge accounting is applied when:<br />
the hedging relationship is formally designated <strong>and</strong> documented at the<br />
inception of the hedge;<br />
the hedge is expected to be highly effective <strong>and</strong> is determined actually<br />
to have been highly effective throughout the financial reporting periods<br />
for which it was designated.<br />
70 FINANCIAL REPORT AND REGISTRATION DOCUMENT <strong>2010</strong> GROUPE SEB
3<br />
CONSOLIDATED FINANCIAL STATEMENTS<br />
NOTES TO THE CONSOLIDATED FINANCIAL STATEMENTS<br />
At the inception of each hedge, the hedging relationship is formally<br />
documented, specifying in particular the Group’s risk management objective<br />
<strong>and</strong> strategy for undertaking the hedge. The initial documentation also<br />
includes details of how the Group will assess the hedging instrument’s<br />
effectiveness. In subsequent periods, the hedging instrument’s actual<br />
effectiveness in offsetting the exposure to changes in the hedged item’s<br />
fair value is also fully documented.<br />
Hedge accounting is discontinued prospectively when the derivative<br />
instrument ceases to be a highly effective hedge or when it expires or is<br />
sold, terminated or exercised.<br />
Changes in the fair value of derivative instruments that do not qualify for<br />
hedge accounting are recognised in profit.<br />
1.4.5. Inventories<br />
Raw materials <strong>and</strong> goods purchased for resale are measured at purchase<br />
cost, using the weighted average cost method.<br />
Work-in-progress <strong>and</strong> finished products are measured at cost, including raw<br />
materials <strong>and</strong> labour <strong>and</strong> a portion of direct <strong>and</strong> indirect production costs.<br />
In accordance with IAS 2, inventories are measured at the lower of cost,<br />
determined as explained above, <strong>and</strong> net realisable value.<br />
Net realisable value corresponds to the estimated selling price in the ordinary<br />
course of business less the estimated costs of completion <strong>and</strong> the estimated<br />
costs necessary to make the sale (mainly distribution costs).<br />
The carrying amount of inventories does not include any borrowing costs.<br />
1.4.6. Trade receivables<br />
Trade receivables are measured at the lower of their nominal amount – which<br />
approximates fair value due to their short maturity – <strong>and</strong> their estimated net<br />
realisable value. Provisions for impairment are determined on the basis of<br />
the age of the receivables, taking into account any identified recovery risks.<br />
1.4.7. Cash <strong>and</strong> cash equivalents<br />
Cash <strong>and</strong> cash equivalents comprise cash at bank <strong>and</strong> on h<strong>and</strong> <strong>and</strong><br />
short-term investments in money market instruments. These instruments<br />
have maturities of less than three months; they are readily convertible into<br />
known amounts of cash <strong>and</strong> are not exposed to any material price risk.<br />
The consolidated statement of cash flows is presented using the indirect<br />
method <strong>and</strong> cash fl ows are analysed between operating, investing <strong>and</strong><br />
financing activities.<br />
IAS 7 has been amended following the publication of IAS 27R. The aggregate<br />
cash flows arising from obtaining or losing control of a subsidiary are<br />
classifi ed as investing activities while cash fl ows arising from changes<br />
in ownership interests in a fully consolidated subsidiary are classifi ed as<br />
financing activities. Transactions with jointly controlled entities or entities<br />
accounted for by the equity method continue to be classified as investing<br />
activities.<br />
1.4.8. Treasury stock<br />
Treasury stock is deducted from equity at cost. Any gains or losses arising<br />
from the purchase, sale, issue or cancellation of treasury stock are recognised<br />
directly in equity without affecting profit.<br />
1.4.9. Income taxes<br />
Income tax expense reported in the income statement corresponds to current<br />
tax for the period <strong>and</strong> changes in deferred taxes.<br />
In accordance with IAS 12 – Income Taxes, deferred taxes are recognised for<br />
temporary differences between the carrying amounts of assets <strong>and</strong> liabilities<br />
<strong>and</strong> their tax base. They are determined using tax rates (<strong>and</strong> tax laws) that<br />
have been enacted or substantively enacted by the balance sheet date.<br />
Temporary differences include:<br />
a) taxable temporary differences, which are temporary differences that will<br />
result in taxable amounts in determining taxable profit (tax loss) of future<br />
periods when the carrying amount of the asset or liability is recovered or<br />
settled; <strong>and</strong><br />
b) deductible temporary differences, which are temporary differences that will<br />
result in amounts that are deductible in determining taxable profit (tax loss)<br />
of future periods when the carrying amount of the asset or liability is<br />
recovered or settled.<br />
Deferred tax assets are recognised for deductible temporary differences <strong>and</strong><br />
tax loss carryforwards to the extent that it is probable that future taxable<br />
profits will be available against which they can be utilised.<br />
Previously unrecognised deferred tax assets at the date of a business<br />
combination or during the twelve-month fair value measurement period are<br />
subsequently recognised as an adjustment to profit or loss provided they<br />
meet the recognition criteria.<br />
In accordance with IAS 12, deferred tax assets <strong>and</strong> liabilities are not<br />
discounted.<br />
1.4.10. Employee benefits<br />
A) PENSION AND OTHER POST-EMPLOYMENT BENEFIT PLANS<br />
In some countries, the Group is required to pay length-of-service awards to<br />
employees on retirement or pension benefits under formal pension plans.<br />
The Group also pays contributions to government-sponsored pension<br />
schemes in its various host countries. The accounting treatment of these<br />
pension <strong>and</strong> other post-employment benefit plans depends on the type of<br />
plan, as follows:<br />
Defined contribution plans<br />
Contributions to these plans are recognised as an expense for the period<br />
to which they relate.<br />
Defined benefit plans<br />
In accordance with IAS 19 – Employee Benefits, obligations under defined<br />
benefit plans are calculated annually by qualified actuaries using the<br />
projected unit credit method based on final salaries. The projected unit credit<br />
method sees each period of service as giving rise to an additional unit of<br />
benefit entitlement <strong>and</strong> measures each unit separately to build up the final<br />
obligation, which is then discounted.<br />
The actuarial assumptions used to calculate the obligation include<br />
staff turnover rates, mortality rates, the discount rate <strong>and</strong> the expected<br />
retirement age.<br />
The assumptions vary according to local laws <strong>and</strong> regulations in the host<br />
countries concerned.<br />
3<br />
GROUPE SEB<br />
FINANCIAL REPORT AND REGISTRATION DOCUMENT <strong>2010</strong><br />
71
3 NOTES<br />
CONSOLIDATED FINANCIAL STATEMENTS<br />
TO THE CONSOLIDATED FINANCIAL STATEMENTS<br />
Actuarial gains <strong>and</strong> losses arising from the effects of changes in actuarial<br />
assumptions <strong>and</strong> experience adjustments on plan obligations <strong>and</strong> assets are<br />
recognised in profit by the corridor method. Under this method, the portion<br />
of the net cumulative unrecognised actuarial gains <strong>and</strong> losses that exceeds<br />
the greater of 10% of the present value of the defined benefit obligation <strong>and</strong><br />
10% of the fair value of any plan assets at that date is amortised over the<br />
remaining service lives of the employees concerned.<br />
A provision is recorded in the balance sheet for any unfunded obligations,<br />
corresponding to defined benefit obligations not covered by plan assets, net<br />
of unrecognised gains <strong>and</strong> losses.<br />
For plans that have a surplus – corresponding to the excess of plan assets<br />
over the defined benefit obligation – an asset is recognised only when the<br />
criteria specified in IAS 19 are fulfilled.<br />
B) OTHER LONG-TERM BENEFIT PLANS<br />
Certain subsidiaries pay jubilees to employees who have completed a certain<br />
number of years service or offer employees “time savings accounts”. The cost<br />
of these long-term benefits is calculated on an actuarial basis <strong>and</strong> recognised<br />
in profit over the service lives of the employees concerned. Actuarial gains<br />
<strong>and</strong> losses are recognised immediately in profit during the period in which<br />
they are generated, as their deferral is not allowed under IFRS.<br />
Pension <strong>and</strong> other post-employment benefit costs are classified as operating<br />
expenses, except for the interest cost, which is included in other financial<br />
income <strong>and</strong> expense in accordance with the alternative treatment allowed<br />
under IAS 19.<br />
In accordance with IFRS 1 – First-Time Adoption of IFRS, cumulative<br />
actuarial gains <strong>and</strong> losses at 1 January 2004 were included in provisions<br />
for pensions <strong>and</strong> other post-employment benefit obligations at that date by<br />
adjusting equity. <strong>Groupe</strong> SEB has elected not to use the option available<br />
in the amended version of IAS 19 whereby entities may recognise actuarial<br />
gains <strong>and</strong> losses under defined benefit pension plans directly in equity as<br />
from 1 January 2006.<br />
C) SHARE-BASED PAYMENTS<br />
Stock option plans are measured <strong>and</strong> recognised in accordance with<br />
IFRS 2 – Share-Based Payment. Stock options represent a benefit for the<br />
grantee <strong>and</strong>, accordingly, are treated as part of the Group’s compensation<br />
costs. Option grants are not cash-settled, <strong>and</strong> the benefit is therefore<br />
recognised as an expense over the vesting period by adjusting equity,<br />
for an amount corresponding to the fair value of the underlying equity<br />
instruments. Stock options granted to employees of Group subsidiaries<br />
that are exercisable for SEB S.A. shares are deemed to be equity-settled<br />
share-based payments.<br />
Fair values are determined using the Black & Scholes option pricing model.<br />
This model takes into account the option exercise price <strong>and</strong> period, market<br />
data at the grant date (risk-free interest rate, share price, volatility, expected<br />
dividends) <strong>and</strong> grantee behaviour assumptions.<br />
IFRS 2 has been applied only to stock options granted after 7 November<br />
2002 that had not yet vested at 1 January 2005. As allowed under IFRS 1,<br />
options granted prior to 7 November 2002 have not been restated.<br />
1.4.11. Provisions<br />
In accordance with IAS 37 – Provisions, Contingent Liabilities <strong>and</strong><br />
Contingent Assets, a provision is recognised when the Group has a present<br />
obligation (legal or constructive) as a result of a past event, it is probable<br />
that an outflow of resources embodying economic benefits will be required<br />
to settle the obligation, <strong>and</strong> a reliable estimate can be made of the amount<br />
of the obligation.<br />
A) PROVISIONS FOR WARRANTY COSTS<br />
The Group provides a warranty on its products. The estimated costs of the<br />
warranty are accrued at the time of sale, based on historical data.<br />
This item also includes provisions for product recalls, which are set up when<br />
the recall is decided.<br />
B) PROVISIONS FOR CLAIMS AND LITIGATION<br />
As a general principle, all known claims <strong>and</strong> litigation involving the Group<br />
are reviewed by management at each period-end. All necessary provisions<br />
have been recorded to cover the related risks, as estimated after obtaining<br />
advice from outside legal advisors.<br />
C) RESTRUCTURING PROVISIONS<br />
The Group is considered as having a constructive obligation when<br />
management has a detailed formal plan for the restructuring, has raised a<br />
valid expectation in those affected that it will carry out the restructuring by<br />
starting to implement that plan or announcing its main features <strong>and</strong> no inflow<br />
of economic benefits is expected that would offset the costs of the plan.<br />
The amount of the related provision corresponds to forecast cash outflows<br />
under the plan.<br />
1.4.12. Off-balance sheet commitments<br />
For several years now, the Group’s reporting system has included detailed<br />
reporting of off-balance sheet commitments. The process provides for the<br />
reporting by consolidated subsidiaries, in their consolidation packages, of<br />
information about the following commitments that they have given:<br />
guarantees, endorsements <strong>and</strong> bonds;<br />
security interests (mortgages <strong>and</strong> pledges);<br />
commitments under non-cancellable operating leases <strong>and</strong> fi rm orders<br />
for fixed assets;<br />
other commitments.<br />
1.4.13. Transactions between owners<br />
Acquisitions or disposals of non-controlling interests that do not affect the<br />
Group’s control of a subsidiary are treated as transactions between owners<br />
<strong>and</strong> accounted for in equity. The carrying amounts of the subsidiary’s assets<br />
(including goodwill recognised upon obtaining control) <strong>and</strong> liabilities remain<br />
unchanged.<br />
In the event of a partial disposal leading to the loss of control of a subsidiary,<br />
the Group (a) derecognises the assets (including any goodwill) <strong>and</strong> liabilities<br />
of the subsidiary at their carrying amounts at the date when control is<br />
lost; (b) derecognises the carrying amount of any non-controlling interests<br />
in the former subsidiary at the date when control is lost; (c) recognises<br />
the fair value of the consideration received; (d) recognises any investment<br />
retained in the former subsidiary at its fair value at the date when control<br />
is lost; (e) reclassifies to profit or loss any gain or loss recognised in other<br />
comprehensive income <strong>and</strong> (f) recognises any resulting difference as a gain<br />
or loss in profit or loss attributable to the parent. The remeasurement at fair<br />
value of any investment retained therefore affects profit or loss.<br />
1.5. INCOME STATEMENT PRESENTATION<br />
1.5.1. Revenue<br />
Revenue corresponds to the value, excluding tax, of goods <strong>and</strong> services<br />
sold by consolidated companies in the course of their ordinary activities,<br />
after eliminating intra-group sales.<br />
72 FINANCIAL REPORT AND REGISTRATION DOCUMENT <strong>2010</strong> GROUPE SEB
3<br />
CONSOLIDATED FINANCIAL STATEMENTS<br />
NOTES TO THE CONSOLIDATED FINANCIAL STATEMENTS<br />
Revenue is recognised when the significant risks <strong>and</strong> rewards of ownership<br />
are transferred to the buyer – generally when the customer receives a<br />
product – for an amount corresponding to the fair value of the consideration<br />
received or receivable as determined after deducting rebates <strong>and</strong> discounts.<br />
Advertising expense contributions billed by customers <strong>and</strong> the cost of<br />
consumer promotions that do not fulfil the criteria for recognition as operating<br />
expenses are recognised as a deduction from revenue. The reported amount<br />
of revenue also includes miscellaneous revenues.<br />
Freight <strong>and</strong> other costs billed to customers are treated as an integral part<br />
of revenue.<br />
Accruals are booked for deferred rebates granted to customers on the basis<br />
of contractual or constructive commitments identified at the period-end.<br />
1.5.2. Operating margin <strong>and</strong> operating expenses<br />
The Group’s main performance indicator is operating margin, which<br />
corresponds to revenue less operating expenses. Operating expenses<br />
comprise the cost of sales, research <strong>and</strong> development costs, advertising<br />
costs <strong>and</strong> distribution <strong>and</strong> administrative expenses. Statutory <strong>and</strong><br />
discretionary employee profit-sharing <strong>and</strong> non-recurring operating income<br />
<strong>and</strong> expenses, as defined in Note 1.5.4, are excluded from the calculation.<br />
1.5.3. Recurring operating profit<br />
Recurring operating profit corresponds to operating margin less statutory<br />
<strong>and</strong> discretionary employee profit sharing.<br />
1.5.4. Operating profit<br />
Operating profit comprises all the recurring <strong>and</strong> non-recurring income <strong>and</strong><br />
expenses generated in the course of the Group’s ordinary activities, including<br />
income <strong>and</strong> expenses resulting from one-off decisions or transactions that<br />
are unusual in terms of their amount. Non-recurring operating income <strong>and</strong><br />
expenses mainly include the following items (see Note 6 for details 6):<br />
costs of significant restructuring plans;<br />
impairment losses on property, plant <strong>and</strong> equipment <strong>and</strong> intangible assets,<br />
including goodwill;<br />
costs related to business combinations (excluding the costs of issuing<br />
equity instruments or of new debt contracted for the purpose of the<br />
business combination) <strong>and</strong> the remeasurement at fair value of any<br />
previously held investment on the date control was obtained;<br />
gains or losses recognised upon losing control of a subsidiary, including<br />
the remeasurement at fair value of any investment retained;<br />
gains <strong>and</strong> losses on very exceptional events (litigation, asset disposals, etc.<br />
involving unusually large amounts) <strong>and</strong> changes in provisions booked for<br />
these types of events.<br />
1.5.5. Other income statement items<br />
Accrued interest on interest-bearing instruments is recognised by the<br />
effective interest method based on the purchase price.<br />
Dividend income is recognised when the shareholder’s right to receive<br />
payment is established.<br />
Finance costs are recognised in the income statement on an accruals basis.<br />
1.5.6. Earnings per share<br />
Basic earnings per share correspond to profit attributable to owners of the<br />
parent divided by the weighted average number of shares outst<strong>and</strong>ing during<br />
the period, excluding treasury stock.<br />
Diluted earnings per share are calculated by adjusting the weighted average<br />
number of shares outst<strong>and</strong>ing to take into account the dilutive effect of stock<br />
options <strong>and</strong> other equity instruments issued by the Company.<br />
3<br />
NOTE 2<br />
CHANGES IN THE SCOPE OF CONSOLIDATION<br />
2.1. CHANGES IN <strong>2010</strong><br />
No subsidiaries were acquired or divested in <strong>2010</strong>. The only change in<br />
the scope of consolidation concerned the Peruvian branch previously<br />
consolidated by <strong>Groupe</strong> SEB Colombia, which is now a subsidiary called<br />
<strong>Groupe</strong> SEB Peru <strong>and</strong> is fully consolidated by the Group. This internal<br />
transaction had no impact on the consolidated financial statements.<br />
Following approval by Colombian competition authorities in early December,<br />
<strong>Groupe</strong> SEB signed a contract on 17 December with the main shareholders<br />
of Colombia-based Imusa to acquire a majority interest in the Company.<br />
Given the time required to comply with stock market regulations, the<br />
transaction should be completed at end February 2011. This transaction<br />
had no impact on the <strong>2010</strong> consolidated financial statements. (see Note 31 –<br />
Subsequent events)<br />
2.2. CHANGES IN 2009<br />
No subsidiaries were acquired or divested in 2009. The only change in scope<br />
of consolidation during the period concerned the <strong>Groupe</strong> SEB Retailing<br />
subsidiary, which was accounted for by the equity method in 2008 <strong>and</strong> fully<br />
consolidated from 1 January 2009. This change in consolidation method did<br />
not have a material impact on the financial statements.<br />
2.3. CHANGES IN 2008<br />
Supor<br />
Supor is China’s leading cookware manufacturer, with a very broad<br />
product range that includes pressure cookers, woks <strong>and</strong> frying pans.<br />
It also manufactures small home equipment, such as rice cookers, electric<br />
pressure cookers, slow-cookers <strong>and</strong> induction hotplates, which are sold<br />
GROUPE SEB<br />
FINANCIAL REPORT AND REGISTRATION DOCUMENT <strong>2010</strong><br />
73
3 NOTES<br />
CONSOLIDATED FINANCIAL STATEMENTS<br />
TO THE CONSOLIDATED FINANCIAL STATEMENTS<br />
mainly under the Supor br<strong>and</strong>. Supor employs roughly 6,600 people, of<br />
whom 80% are production workers based at the Company’s four plants in<br />
mainl<strong>and</strong> China, in Yuhuan, Wuhan, Hangzhou <strong>and</strong> Dongguan. A significant<br />
portion of its revenue is generated internationally through sub-contracting<br />
agreements with major small household equipment manufacturers, including<br />
<strong>Groupe</strong> SEB.<br />
Supor reported revenue of €351 million in 2008 <strong>and</strong> €281 million in 2007.<br />
Supor’s contribution to consolidated operating margin was €30 million in 2008.<br />
Acquisition of control of Supor on 1 January 2008<br />
<strong>Groupe</strong> SEB acquired 52.74% of the capital of Supor in two stages:<br />
on 28 August 2007, SEB acquired 30% of the voting rights in the<br />
group’s parent company Zhejiang Supor Co. Ltd. (ZJ Supor), listed on<br />
the Shenzhen stock exchange under code 002032.SZ, at a total cost of<br />
€115.8 million;<br />
on 21 December 2007, following a public tender offer for part of the<br />
remaining shares launched in November, SEB acquired a further 22.74%<br />
of the capital <strong>and</strong> voting rights for €228.8 million.<br />
For the preparation of the 2007 consolidated fi nancial statements, the<br />
Group considered that it exercised significant influence over ZJ Supor from<br />
1 September 2007. ZJ Supor was therefore accounted for by the equity<br />
method in the last four months of 2007, based on the Group’s 30% interest.<br />
In January 2008, <strong>Groupe</strong> SEB acquired control of ZJ Supor following a<br />
General Meeting at which the Company’s shareholders elected the fi ve<br />
directors nominated by <strong>Groupe</strong> SEB (four <strong>Groupe</strong> SEB executives <strong>and</strong> one<br />
independent director) to the nine-member Board of Directors, thereby giving<br />
<strong>Groupe</strong> SEB the majority. ZJ Supor <strong>and</strong> its subsidiaries have therefore been<br />
fully consolidated from 1 January 2008.<br />
The following table analyses the fair value of the assets acquired <strong>and</strong> liabilities<br />
assumed <strong>and</strong> provides a reconciliation with the corresponding cash flows:<br />
Goodwill corresponds mainly to market shares <strong>and</strong> projected synergies,<br />
particularly in terms of manufacturing, supply chain operations <strong>and</strong> product<br />
development, which cannot be separately identified.<br />
Acquisition of minority interests in certain ZJ Supor<br />
subsidiaries<br />
During the second quarter of 2008, <strong>Groupe</strong> SEB acquired Hong Kong-based<br />
Grain Harvest Development Ltd., which holds signifi cant stakes in three<br />
ZJ Supor subsidiaries, as follows:<br />
25% of Wuhan Supor Cookware;<br />
25% of Zhejiang Supor Electrical Appliances;<br />
30% of Dongguan Supor Electrical Appliances.<br />
This transaction, which enabled the Group to increase its share of<br />
ZJ Supor’s profi t, was accounted for based on the three companies’ fair<br />
values at 31 March 2008, leading to the recognition of additional goodwill<br />
of €35.7 million.<br />
Exercise of stock options by certain Supor Group<br />
executives<br />
Prior to the acquisition, certain Supor Group senior executives were granted<br />
options to purchase new ZJ Supor shares, which were exercisable upon<br />
the change of control of Supor. Following administrative processing by the<br />
Chinese authorities, the options were exercised at the end of June 2008<br />
for a total of 12 million Supor shares, lowering <strong>Groupe</strong> SEB’s share in the<br />
Company to 51.31%.<br />
All the options were exercised, <strong>and</strong> there are no remaining stock options<br />
likely to have a dilutive impact on <strong>Groupe</strong> SEB’s stake in ZJ Supor.<br />
(in € millions) 1 January 2008<br />
Non-current assets (a) 153.3<br />
Inventories 38.5<br />
Trade <strong>and</strong> other receivables 31.9<br />
Net cash <strong>and</strong> cash equivalents 73.2<br />
Trade <strong>and</strong> other payables (32.5)<br />
Other liabilities (including deferred taxes) (36.8)<br />
Minority interests (16.6)<br />
TOTAL NET ASSETS 211.0<br />
PERCENT INTEREST 52.74%<br />
NET ASSETS ACQUIRED 111.3<br />
COST OF THE BUSINESS COMBINATION 344.6<br />
Goodwill 233.3<br />
(a) Including the Supor br<strong>and</strong>, valued by independent experts at €75.1 million.<br />
74 FINANCIAL REPORT AND REGISTRATION DOCUMENT <strong>2010</strong> GROUPE SEB
3<br />
CONSOLIDATED FINANCIAL STATEMENTS<br />
NOTES TO THE CONSOLIDATED FINANCIAL STATEMENTS<br />
NOTE 3<br />
SEGMENT INFORMATION<br />
In accordance with IFRS 8 – Operating Segments, fi nancial information<br />
is presented by geographical segment, which is the basis of the internal<br />
information reviewed <strong>and</strong> used by the chief operating decision makers, i.e.<br />
the members of the Executive Committee.<br />
3.1. GEOGRAPHICAL SEGMENT INFORMATION (BY LOCATION OF ASSETS)<br />
(in € millions)<br />
France<br />
Other Western<br />
European<br />
countries (a)<br />
North<br />
America<br />
South<br />
America<br />
Asia/<br />
Pacific<br />
Central Europe<br />
<strong>and</strong> other<br />
countries<br />
Intra-group<br />
transactions<br />
Total<br />
<strong>2010</strong><br />
Revenue<br />
Inter-segment revenue 711.7 770.7 386.8 344.1 660.2 614.2 3,487.7<br />
External revenue 635.9 46.5 0.8 12.1 756.2 6.4 (1,293.8) 164.1<br />
TOTAL REVENUE 1,347.6 817.2 387.6 356.2 1,416.4 620.6 (1,293.8) 3,651.8<br />
Profit/(loss)<br />
Operating margin 160.4 44.2 (8.8) 24.7 118.3 106.0 (6.9) 437.9<br />
Operating profit 87.0 47.1 (26.3) 20.8 119.8 100.6 349.0<br />
Finance costs <strong>and</strong> other financial<br />
income <strong>and</strong> expense, net (15.9)<br />
Share of profit of associates<br />
Income tax expense (89.5)<br />
NET PROFIT 243.6<br />
Balance sheet<br />
Segment assets 637.9 469.1 339.4 303.6 961.1 241.3 (285.1) 2,667.3<br />
<strong>Financial</strong> assets 261.7<br />
Tax assets 67.0<br />
3<br />
TOTAL ASSETS 2,996.0<br />
Segment liabilities 425.1 279.1 54.7 100.2 239.9 109.0 (240.8) 967.2<br />
Borrowings 378.0<br />
Tax liabilities 79.5<br />
Equity 1,571.3<br />
TOTAL EQUITY<br />
AND LIABILITIES 2,996.0<br />
Other information<br />
Capital expenditure<br />
<strong>and</strong> purchases<br />
of intangible assets 59.4 7.4 5.0 19.1 47.2 2.7 140.8<br />
Depreciation<br />
<strong>and</strong> amortisation expense 59.9 8.2 3.8 9.1 17.4 1.6 100.0<br />
Impairment losses 3.6 14.7 18.3<br />
(a) “Other Western European countries” correspond to the 15 other countries comprising the pre-enlargement European Union. The new EU countries are included in the “Central Europe<br />
<strong>and</strong> other countries” segment.<br />
GROUPE SEB<br />
FINANCIAL REPORT AND REGISTRATION DOCUMENT <strong>2010</strong><br />
75
3 NOTES<br />
CONSOLIDATED FINANCIAL STATEMENTS<br />
TO THE CONSOLIDATED FINANCIAL STATEMENTS<br />
(in € millions)<br />
2009<br />
Revenue<br />
France<br />
Other Western<br />
European<br />
countries (a)<br />
North<br />
America<br />
South<br />
America<br />
Asia/<br />
Pacific<br />
Central Europe<br />
<strong>and</strong> other<br />
countries<br />
Intra-group<br />
transactions<br />
Inter-segment revenue 684.7 706.1 342.4 259.5 596.9 529.8 3,119.4<br />
External revenue 557.7 44.2 0.6 14.6 477.0 4.9 (1,042.1) 56.9<br />
TOTAL REVENUE 1,242.4 750.3 343.0 274.1 1,073.9 534.7 (1,042.1) 3,176.3<br />
Profit/(loss)<br />
Operating profit 38.9 (0.7) (28.6) 19.9 127.3 91.3 248.1<br />
Finance costs <strong>and</strong> other financial<br />
income <strong>and</strong> expense, net (27.2)<br />
Share of profit of associates<br />
Income tax expense (58.1)<br />
NET PROFIT 162.8<br />
Balance sheet<br />
Segment assets 567.9 443.0 319.4 245.2 758.1 200.7 (237.6) 2,296.7<br />
<strong>Financial</strong> assets 320.7<br />
Tax assets 53.2<br />
TOTAL ASSETS 2,670.6<br />
Segment liabilities 381.4 266.0 42.5 70.7 177.6 78.8 (201.4) 815.6<br />
Borrowings 561.7<br />
Tax liabilities 73.2<br />
Equity 1,220.1<br />
TOTAL EQUITY AND LIABILITIES 2,670.6<br />
Other information<br />
Capital expenditure <strong>and</strong><br />
purchases of intangible assets 60.8 9.0 2.2 8.0 28.1 1.2 109.3<br />
Depreciation <strong>and</strong> amortisation<br />
expense 58.4 8.3 3.8 8.4 13.8 1.3 94.0<br />
Impairment losses 4.3 5.0 20.4 29.7<br />
(a) “Other Western European countries” correspond to the 15 other countries comprising the pre-enlargement European Union. The new EU countries are included in the “Central Europe <strong>and</strong><br />
other countries” segment.<br />
Total<br />
76 FINANCIAL REPORT AND REGISTRATION DOCUMENT <strong>2010</strong> GROUPE SEB
3<br />
CONSOLIDATED FINANCIAL STATEMENTS<br />
NOTES TO THE CONSOLIDATED FINANCIAL STATEMENTS<br />
(in € millions)<br />
2008<br />
Revenue<br />
France<br />
Other Western<br />
European<br />
countries (a)<br />
North<br />
America<br />
South<br />
America<br />
Asia/<br />
Pacific<br />
Central Europe<br />
<strong>and</strong> other<br />
countries<br />
Intra-group<br />
transactions<br />
Inter-segment revenue 666.0 706.4 376.2 263.1 498.8 642.7 3,153.2<br />
External revenue 693.8 48.8 2.8 26.9 594.9 1.2 (1,291.4) 77.0<br />
TOTAL REVENUE 1,359.8 755.2 379.0 290.0 1,093.7 643.9 (1,291.4) 3,230.2<br />
Profit/(loss)<br />
Operating profit 62.7 3.5 0.1 24.3 84.2 104.4 279.2<br />
Finance costs <strong>and</strong> other financial<br />
income <strong>and</strong> expense, net (48.6)<br />
Share of profit of associates (1.3)<br />
Income tax expense (66.5)<br />
NET PROFIT 162.8<br />
Balance sheet<br />
Segment assets 641.5 514.4 370.7 214.5 731.4 239.6 (224.4) 2,487.7<br />
<strong>Financial</strong> assets 247.3<br />
Tax assets 87.1<br />
Total<br />
TOTAL ASSETS 2,822.1<br />
Segment liabilities 364.4 237.3 39.9 56.1 150.7 93.4 (200.9) 740.9<br />
Borrowings - 926.2<br />
Tax liabilities - 117.4<br />
Equity - 1,037.6<br />
TOTAL EQUITY AND LIABILITIES 2,822.1<br />
Other information<br />
Capital expenditure <strong>and</strong><br />
purchases of intangible assets 59.7 13.2 5.5 10.5 24.7 2.7 116.3<br />
Depreciation <strong>and</strong> amortisation<br />
expense 54.4 10.5 4.1 8.4 11.1 1.3 89.8<br />
Impairment losses 2.3 14.3 3.9 20.5<br />
3<br />
(a) “Other Western European countries” correspond to the 15 other countries comprising the pre-enlargement European Union. The new EU countries are included in the “Central Europe <strong>and</strong><br />
other countries” segment.<br />
Inter-segment transactions correspond to sales to external customers<br />
located within the geographical segment.<br />
External transactions correspond to total sales (within the Group <strong>and</strong> to<br />
external customers) generated outside the geographical segment by<br />
companies within the geographical segment.<br />
Intra-group transactions are carried out on an arm’s length basis.<br />
3.2. REVENUE BY GEOGRAPHICAL LOCATION OF THE CUSTOMER<br />
(in € millions) <strong>2010</strong> 2009 2008<br />
France 711.7 685.3 668.1<br />
Other Western European countries (a) 786.9 728.3 734.6<br />
North America 404.4 348.9 393.7<br />
South America 345.7 261.5 269.1<br />
Asia-Pacific 764.0 599.9 498.8<br />
Central Europe <strong>and</strong> other countries 639.1 552.4 665.9<br />
TOTAL 3,651.8 3,176.3 3,230.2<br />
(a) “Other Western European countries” correspond to the 15 other countries comprising the pre-enlargement European Union. The new EU countries are included in the “Central Europe <strong>and</strong><br />
other countries” segment.<br />
GROUPE SEB<br />
FINANCIAL REPORT AND REGISTRATION DOCUMENT <strong>2010</strong><br />
77
3 NOTES<br />
CONSOLIDATED FINANCIAL STATEMENTS<br />
TO THE CONSOLIDATED FINANCIAL STATEMENTS<br />
NOTE 4<br />
OPERATING EXPENSES<br />
(in € millions) <strong>2010</strong> 2009 restated 2008 restated<br />
Purchased raw materials <strong>and</strong> goods (1,632.7) (1,414.1) (1,423.2)<br />
Labour costs (126.7) (125.4) (126.0)<br />
Freight costs (64.9) (22.1) (24.0)<br />
Other production costs (322.3) (305.4) (324.6)<br />
COST OF SALES (SUB-TOTAL) (2,146.6) (1,867.0) (1,897.8)<br />
Research <strong>and</strong> development costs (60.0) (50.0) (49.8)<br />
Advertising expense (143.0) (95.2) (119.8)<br />
Distribution <strong>and</strong> administrative expenses (864.3) (808.7) (820.9)<br />
OPERATING EXPENSES (3,213.9) (2,820.9) (2,888.5)<br />
As part of its migration to a new financial reporting application, the Group<br />
revamped its accounting plan, which resulted in certain expenses (mainly<br />
logistics expenses) being reclassifi ed in cost of sales. This changed the<br />
structure of gross margin, but had no impact on reported operating margin.<br />
NOTE 5<br />
EMPLOYEE BENEFITS EXPENSE<br />
(in € millions) <strong>2010</strong> 2009 2008<br />
Wages <strong>and</strong> salaries (excluding temporary staff costs) (429.3) (381.2) (384.1)<br />
Payroll taxes (112.6) (104.1) (105.0)<br />
Pension <strong>and</strong> other post-employment benefit plan costs (39.3) (38.3) (34.9)<br />
Service cost under defined benefit plans (7.6) (5.0) (5.3)<br />
Discretionary <strong>and</strong> non-discretionary profit-sharing (50.4) (33.5) (38.2)<br />
TOTAL EMPLOYEE BENEFITS EXPENSE (639.2) (562.1) (567.5)<br />
Breakdown by geographical<br />
segment <strong>2010</strong><br />
France<br />
Other Western<br />
European<br />
countries (a)<br />
North<br />
America<br />
South<br />
America<br />
Asia/<br />
Pacific<br />
Central Europe<br />
<strong>and</strong> other<br />
countries<br />
Employee benefits<br />
expense (excluding temporary staff costs) (368.3) (74.4) (41.5) (53.5) (77.2) (24.3) (639.2)<br />
Average number of employees 5,859 1,430 693 2,142 11,794 250 22,168<br />
Total<br />
Breakdown by geographical<br />
segment 2009<br />
France<br />
Other Western<br />
European<br />
countries (a)<br />
North<br />
America<br />
South<br />
America<br />
Asia/<br />
Pacific<br />
Central Europe<br />
<strong>and</strong> other<br />
countries<br />
Employee benefits<br />
expense (excluding temporary staff costs) (343.7) (72.9) (34.6) (39.1) (51.7) (20.1) (562.1)<br />
Average number of employees 6,077 1,461 638 1,997 9,313 227 19,713<br />
Total<br />
Breakdown by geographical<br />
segment 2008<br />
France<br />
Other Western<br />
European<br />
countries (a)<br />
North<br />
America<br />
South<br />
America<br />
Asia/<br />
Pacific<br />
Central Europe<br />
<strong>and</strong> other<br />
countries<br />
Employee benefits<br />
expense (excluding temporary staff costs) (344.8) (73.7) (35.6) (42.2) (52.4) (18.8) (567.5)<br />
Average number of employees 6,422 1,451 746 2,289 6,535 607 18,050<br />
(a) “Other Western European countries” correspond to the 15 other countries comprising the pre-enlargement European Union. The new EU countries are included in the “Central Europe <strong>and</strong><br />
other countries” segment.<br />
Total<br />
78 FINANCIAL REPORT AND REGISTRATION DOCUMENT <strong>2010</strong> GROUPE SEB
3<br />
CONSOLIDATED FINANCIAL STATEMENTS<br />
NOTES TO THE CONSOLIDATED FINANCIAL STATEMENTS<br />
Employees by category (%) <strong>2010</strong> 2009 2008<br />
Direct labour 49.8 48.6 44.5<br />
Other workers 40.6 41.4 44.5<br />
Managers 9.6 10.0 11.0<br />
TOTAL 100.0 100.0 100.0<br />
NOTE 6<br />
OTHER OPERATING INCOME AND EXPENSE<br />
(in € millions) <strong>2010</strong> 2009 2008<br />
Restructuring costs (15.0) (41.3) (13.9)<br />
Impairment losses (18.4) (29.7) (19.6)<br />
Gains <strong>and</strong> losses on asset disposals <strong>and</strong> other (5.1) (2.8) 9.2<br />
OTHER OPERATING INCOME AND EXPENSE, NET (38.5) (73.8) (24.3)<br />
6.1. RESTRUCTURING COSTS<br />
<strong>2010</strong><br />
Restructuring costs for the year amounted to €15.0 million, mainly<br />
comprising:<br />
in France, the new pension reform has extended the period during which<br />
the Group will incur expenses under the pre-retirement plans introduced at<br />
certain sites in 2006. The additional cost for <strong>2010</strong> amounted to €4.8 million;<br />
in Brazil, the Group decided to insource all of its sales forces with the<br />
aim of improving customer service quality <strong>and</strong> controlling the entire value<br />
chain. The contracts with existing external sales representatives were<br />
therefore terminated, leading to compensation costs of €6.5 million;<br />
in China, responsibility for selling Tefal br<strong>and</strong> products was transferred<br />
to the Supor sales force, leading to sales force rationalisation costs of<br />
€2.4 million.<br />
2009<br />
Restructuring costs for 2009 amounted to €41.3 million, mainly comprising:<br />
a plan to reorganise European iron manufacturing operations announced<br />
on 11 February 2009. The related costs recognised in 2009 totalled<br />
€7.9 million for the redundancy plan at the Erbach site in Germany;<br />
in France, the reorganisation of iron manufacturing sites resulted in a<br />
pre-retirement plan at the Pont-Évêque site;<br />
provisions were also booked following the decision to combine the R&D<br />
<strong>and</strong> marketing teams from the La Défense <strong>and</strong> Caen sites at a facility in<br />
Burgundy to create a single, optimised “Electric Cooking Appliances” unit;<br />
an additional provision was also booked as a result of the 2006 Vosges<br />
site closure;<br />
total restructuring costs in France therefore amounted to €20.4 million<br />
in 2009;<br />
in Italy, the Group announced job cuts in September 2009 at the Omegna<br />
site, for which a €5.8 million provision was booked;<br />
in light of the severe economic crisis in a number of markets,<br />
the Group continued to realign its industrial (Brazil, United States),<br />
administrative (Spain) <strong>and</strong> sales (Norway, United Kingdom) organisations,<br />
giving rise to restructuring costs of €7.2 million in 2009.<br />
2008<br />
Restructuring costs for the year amounted to €13.9 million <strong>and</strong> mainly<br />
concerned plans in the following countries:<br />
France, for €5 million, corresponding to the additional costs of three plant<br />
closures launched in 2006, mainly the increase in payroll taxes on early<br />
retirement benefits <strong>and</strong> the cash cost of measures to assist the affected<br />
employees for which provisions could not be booked according to IFRS;<br />
the United Kingdom, for €6.6 million, related to the outsourcing of logistics<br />
operations;<br />
the United States, for €2.2 million, following the closure of the Medford,<br />
Los Angeles <strong>and</strong> Budd Lake offices <strong>and</strong> the transfer of their sales <strong>and</strong><br />
marketing activities to the West Orange <strong>and</strong> Millville sites.<br />
6.2. IMPAIRMENT LOSSES<br />
<strong>2010</strong><br />
In application of the principle described in Note 1.4.3, certain manufacturing<br />
cash-generating units (CGUs) were tested for impairment by comparing the<br />
carrying amount of the assets of each CGU with their value in use, defined<br />
as the sum of discounted future cash flows for the 5-year period covered by<br />
the business plan. Terminal value was determined based on the expected<br />
future cash flows to be derived from the assets in the last year of the plan.<br />
CGUs comprising intangible assets with indefinite useful lives were tested<br />
for impairment on a regular basis <strong>and</strong> CGUs comprising depreciable or<br />
amortisable assets were tested only when there was an indication that they<br />
may have been impaired. The main impairment tests <strong>and</strong> CGUs concerned<br />
are discussed in Note 10 – Intangible Assets.<br />
3<br />
GROUPE SEB<br />
FINANCIAL REPORT AND REGISTRATION DOCUMENT <strong>2010</strong><br />
79
3 NOTES<br />
CONSOLIDATED FINANCIAL STATEMENTS<br />
TO THE CONSOLIDATED FINANCIAL STATEMENTS<br />
The main impairment loss recognised in <strong>2010</strong> was an additional impairment<br />
of the All-Clad goodwill for €14.7 million. After the deep recession in 2009,<br />
there was a significant recovery in sales in <strong>2010</strong> but the general environment<br />
in US premium segment remains hesitant <strong>and</strong> pre-recession margins have<br />
not yet been restored. These conditions were included in the business<br />
plan that serves as a basis for impairment testing, leading to an additional<br />
goodwill impairment loss of €14.7 million, in addition to the €21.2 million loss<br />
already recognised in 2009. The main assumptions used for impairment tests<br />
<strong>and</strong> sensitivity analyses in <strong>2010</strong> are described in Note 10.<br />
The Group also booked a €3.6 million impairment loss for its Scales<br />
manufacturing facility at Rumilly (France) to take account of a decline in<br />
production volumes following the decision to relocate the production of<br />
budget scales to China.<br />
The main assumptions used in <strong>2010</strong> for impairment tests on the<br />
manufacturing CGUs in Europe were as follows:<br />
the weighted average cost of capital was estimated at 8.18% (vs. 8.66%<br />
in 2009 <strong>and</strong> 8.83% in 2008);<br />
the long-term growth rate beyond the 5-year period covered by the<br />
business plan was set between 0% <strong>and</strong> 2%, depending on the business<br />
of the CGU concerned (unchanged for the past three years).<br />
Broadly, the tests performed on the European manufacturing CGUs<br />
at end-<strong>2010</strong> showed little sensitivity to changes in the financial<br />
assumptions (WACC <strong>and</strong> long-term growth), thanks to a significant recovery<br />
in production volumes in <strong>2010</strong>.<br />
2009<br />
In 2009, following the deterioration in activity in the United States, especially<br />
in the premium segment, a €20.4 million impairment loss was recognised<br />
on All-Clad goodwill.<br />
Impairment losses were also recorded on certain European manufacturing<br />
assets:<br />
Omegna (Italy), for €5.0 million, due to the reorganisation announced<br />
in September resulting in a significant reduction in production capacity;<br />
Mayenne (France), for €2.5 million, following the downgrading of<br />
production forecasts for coffee makers <strong>and</strong> instant hot water dispensers;<br />
Rumilly Drinks unit (France), for €1.2 million, due to the downgrading of<br />
production forecasts for instant hot water dispensers;<br />
Rumilly Scales unit (France), for €0.6 million.<br />
2008<br />
In 2008, impairment tests led to the recognition of impairment losses totalling<br />
€16.1 million on the following European manufacturing CGUs:<br />
Erbach (Germany), for €9.3 million;<br />
Omegna (Italy), for €5.0 million, due to the plant operating significantly<br />
below capacity;<br />
Mayenne (France), for €1.8 million, due to inadequate margins, particularly<br />
on coffeemakers.<br />
In addition, a further impairment loss of €3.5 million was recognised<br />
on the Mirro, WearEver <strong>and</strong> AirBake br<strong>and</strong>s.<br />
6.3. GAINS AND LOSSES ON ASSET DISPOSALS<br />
AND OTHER<br />
<strong>2010</strong><br />
The main gains <strong>and</strong> losses in <strong>2010</strong> include:<br />
recognition of a €2.6 million provision for the dispute with one of the<br />
Group’s former distributors in the Middle-East. Although the Group<br />
believes it has complied strictly with the terms of the contract, the<br />
provision has been taken to cover the uncertainties of the local judicial<br />
process <strong>and</strong> other factors;<br />
a loss of €1.5 million on the disposal of a logistics warehouse in Germany;<br />
an additional €0.7 million provision for the dispute with a Chinese importer<br />
described in Note 29.1 <strong>and</strong> the 2009 <strong>Registration</strong> <strong>Document</strong>, increasing<br />
the total amount from €1.2 million to €1.9 million at 31 December <strong>2010</strong>.<br />
2009<br />
In 2009, the Group booked a €1.2 million provision for a dispute with a<br />
Chinese importer. The Group’s German companies paid exceptional<br />
contributions of €1.0 million to the pension guarantee fund due to the<br />
bankruptcy of certain companies participating in the plans in early 2009.<br />
2008<br />
The main gains <strong>and</strong> losses include:<br />
the reversal of a provision for €8.0 million, following the abolition, in the<br />
2009 Social Security Financing Act, of employer contributions to the fund<br />
for early retirement benefits payable to workers exposed to asbestos in the<br />
course of their work. Certain sites that were acquired in 2001 after Moulinex<br />
filed for bankruptcy met the Act’s asbestos plan criteria. A provision of<br />
€11.6 million was therefore set aside in 2004 <strong>and</strong> 2005, corresponding to<br />
the discounted present value of <strong>Groupe</strong> SEB’s contribution to the early<br />
retirement benefit fund. Following abolition of the funding obligation, the<br />
corresponding provision was reversed in 2008, with the exception of an<br />
amount of €0.8 million required to cover the 0.8 contribution;<br />
proceeds of €1.5 million from the out-of-court settlement of a trademark<br />
infringement claim made against a competitor.<br />
80 FINANCIAL REPORT AND REGISTRATION DOCUMENT <strong>2010</strong> GROUPE SEB
3<br />
CONSOLIDATED FINANCIAL STATEMENTS<br />
NOTES TO THE CONSOLIDATED FINANCIAL STATEMENTS<br />
NOTE 7<br />
FINANCE COSTS AND OTHER FINANCIAL INCOME AND EXPENSE, NET<br />
(in € millions) <strong>2010</strong> 2009 2008<br />
FINANCE COSTS (12.0) (22.6) (37.9)<br />
Interest cost on long-term employee benefit obligations (5.6) (6.4) (6.2)<br />
Exchange gains <strong>and</strong> losses 4.8 1.7 (0.2)<br />
Income <strong>and</strong> expenses from financial instruments (0.1) (1.8) (3.8)<br />
Other (3.0) 1.9 (0.5)<br />
OTHER FINANCIAL INCOME AND EXPENSE, NET (3.9) (4.6) (10.7)<br />
The interest cost on long-term employee benefit obligations corresponds<br />
to the difference between the discounting adjustment for the year – arising<br />
from the fact that benefi t payments are one year closer to being paid –<br />
<strong>and</strong> the expected return on the corresponding plan assets. Discounting<br />
adjustments to other long-term liabilities <strong>and</strong> provisions are also included<br />
under this caption.<br />
Exchange gains <strong>and</strong> losses on foreign currency transactions are included in<br />
operating margin. Gains <strong>and</strong> losses on hedges of foreign currency borrowings<br />
are reported under “Other financial income <strong>and</strong> expense”.<br />
Income <strong>and</strong> expenses from financial instruments correspond to amortisation<br />
of the time value of hedging instruments, <strong>and</strong> derivative instruments for<br />
which the hedging relationship has not been documented.<br />
NOTE 8<br />
INCOME TAXES<br />
8.1. INCOME TAX EXPENSE<br />
(in € millions) <strong>2010</strong> 2009 2008<br />
Current taxes 92.0 73.2 55.3<br />
Deferred taxes, net (2.5) (15.1) 11.2<br />
3<br />
INCOME TAX EXPENSE 89.5 58.1 66.5<br />
Current income tax expense corresponds to taxes paid or payable in the<br />
short term on profit for the year, based on local tax rates <strong>and</strong> tax laws in the<br />
Group’s host countries.<br />
Group companies in France, Germany, Italy <strong>and</strong> the United States have<br />
elected for group relief. The companies in each tax group record in their<br />
accounts the income tax charge or benefit that they would have paid<br />
or received if they had been taxed on a st<strong>and</strong>-alone basis (Note 32).<br />
Tax savings resulting from the election for group relief are not material; the<br />
main benefit lies in the fact that any tax losses can be set off immediately<br />
against the taxable income of other companies in the tax group.<br />
8.2. EFFECTIVE TAX RATE<br />
The following table provides a reconciliation between the Group’s effective tax rate of 26.9% (26.3% in 2009 <strong>and</strong> 29.0% in 2008) <strong>and</strong> the statutory French<br />
tax rate of 34.43%:<br />
(in%) <strong>2010</strong> 2009 2008<br />
STATUTORY FRENCH TAX RATE 34.4 34.4 34.4<br />
Effect of different tax rates (8.4) (12.4) (9.6)<br />
Unrecognised <strong>and</strong> unrelieved tax loss carryforwards 2.0 2.3 3.5<br />
Prior period tax loss carryforwards recognised <strong>and</strong> utilised during<br />
the period (4.0) (2.7)<br />
Other (a) 2.9 4.7 0.7<br />
EFFECTIVE TAX RATE 26.9 26.3 29.0<br />
(a) The caption “Other” primarily includes unrecognised deferred tax assets other than for tax losses, <strong>and</strong> changes in deferred tax assets not recognised in prior periods, the change in<br />
value of these items <strong>and</strong> the impact of the non-deductibility of the impairment loss on All-Clad goodwill (1.5% in <strong>2010</strong> <strong>and</strong> 3.1% in 2009).<br />
GROUPE SEB<br />
FINANCIAL REPORT AND REGISTRATION DOCUMENT <strong>2010</strong><br />
81
3 NOTES<br />
CONSOLIDATED FINANCIAL STATEMENTS<br />
TO THE CONSOLIDATED FINANCIAL STATEMENTS<br />
8.3. DEFERRED TAX ASSETS AND LIABILITIES<br />
(in € millions) <strong>2010</strong> 2009 2008<br />
Intangible assets (br<strong>and</strong>s) (91.6) (80.2) (82.7)<br />
Capitalised development costs (5.8) (6.3) (6.5)<br />
Property, plant <strong>and</strong> equipment (24.4) (24.6) (27.6)<br />
Net tax loss carryforwards 19.6 11.8 24.8<br />
Provisions for pensions <strong>and</strong> other employee-related liabilities 32.1 32.7 30.9<br />
Elimination of intra-group gains 16.5 14.5 14.2<br />
Other timing differences (net) 38.9 34.9 3.3<br />
NET DEFERRED TAX ASSET/(LIABILITY) (14.7) (17.2) (43.6)<br />
Of which:<br />
Deferred tax assets 40.2 38.1 48.2<br />
Deferred tax liabilities 54.9 55.3 91.8<br />
Deferred taxes on other timing differences essentially include deferred taxes on the non-deductible portion of provisions.<br />
The following table shows changes in net deferred taxes recognised in the balance sheet:<br />
(in € millions)<br />
NET DEFERRED TAX LIABILITY AT 31 DECEMBER 2008 (43.6)<br />
Deferred tax charges <strong>and</strong> benefits for the period recognised in profit 15.1<br />
Effect of deferred taxes recognised in equity 6.7<br />
Effect of changes in foreign exchange rates 1.5<br />
Effect of changes in the scope of consolidation 1.0<br />
Other 2.1<br />
NET DEFERRED TAX LIABILITY AT 31 DECEMBER 2009 (17.2)<br />
Deferred tax charges <strong>and</strong> benefits for the period recognised in profit 2.5<br />
Effect of deferred taxes recognised in equity 1.1<br />
Effect of changes in foreign exchange rates (2.8)<br />
Effect of changes in the scope of consolidation<br />
Other 1.7<br />
NET DEFERRED TAX LIABILITY AT 31 DECEMBER <strong>2010</strong> (14.7)<br />
Deferred taxes recognised in equity essentially include deferred taxes on derivative hedging instruments <strong>and</strong> deferred taxes on gains <strong>and</strong> losses on treasury shares.<br />
8.4. OTHER INFORMATION<br />
At 31 December <strong>2010</strong>, the Group had unrecognised deductible temporary differences <strong>and</strong> tax losses expiring in the following periods:<br />
At 31 December <strong>2010</strong><br />
(in € millions)<br />
Deductible temporary<br />
differences Tax losses Total<br />
2011 0.6 0.6<br />
2012 0.8 0.2 1.0<br />
2013 0.8 0.8<br />
2014 0.7 0.7<br />
2015 <strong>and</strong> beyond 0.3 11.8 12.1<br />
Available indefinitely 51.9 51.9<br />
TOTAL 3.2 63.9 67.1<br />
Unrecognised tax loss carryforwards fell from €72 million in 2009 to<br />
€63.9 million in <strong>2010</strong>. As in prior years, they primarily concerned operations<br />
in Germany (€31 million in <strong>2010</strong>, €39 million in 2009 <strong>and</strong> €42 million in 2008),<br />
Spain (€4 million in <strong>2010</strong>, €11 million in 2009 <strong>and</strong> €13 million in 2008) <strong>and</strong> the<br />
United Kingdom (€9.6 million in <strong>2010</strong> <strong>and</strong> €9 million in both 2009 <strong>and</strong> 2008).<br />
82 FINANCIAL REPORT AND REGISTRATION DOCUMENT <strong>2010</strong> GROUPE SEB
3<br />
CONSOLIDATED FINANCIAL STATEMENTS<br />
NOTES TO THE CONSOLIDATED FINANCIAL STATEMENTS<br />
NOTE 9<br />
EARNINGS PER SHARE<br />
(in € millions) <strong>2010</strong> 2009 2008<br />
Numerator<br />
Profit for the period 220.4 146.0 151.6<br />
After tax effect of dilutive potential shares<br />
Profit used to calculate diluted earnings per share 220.4 146.0 151.6<br />
Denominator<br />
Weighted average number of ordinary shares used to calculate basic<br />
earnings per share 47,414,375 46,476,548 47,325,540<br />
Effect of dilutive potential shares 1,000,136 86,774 366,772<br />
Weighted average number of ordinary shares used to calculate diluted<br />
earnings per share 48,414,511 46,563,322 47,692,312<br />
BASIC EARNINGS PER SHARE (IN €) 4.65 3.14 3.20<br />
DILUTED EARNINGS PER SHARE (IN €) 4.55 3.13 3.18<br />
The potential dilution is mainly due to the various stock option plans (see Note 19.2).<br />
NOTE 10<br />
INTANGIBLE ASSETS<br />
In accordance with IAS 38, intangible assets with an indefinite useful life –<br />
corresponding to trademarks <strong>and</strong> goodwill – are no longer amortised but<br />
are tested for impairment at each year-end. The impairment testing method<br />
is described in Note 1.4.<br />
Intangible assets with a finite useful life are amortised by the straight-line<br />
method over their estimated useful life. Amortisation expense is deducted<br />
from operating margin.<br />
The Group also holds certain trademarks – such as the Tefal international<br />
br<strong>and</strong> <strong>and</strong> the SEB <strong>and</strong> Calor regional br<strong>and</strong>s – which are not recognised<br />
in the balance sheet.<br />
3<br />
<strong>2010</strong><br />
(in € millions)<br />
Cost<br />
Patents <strong>and</strong><br />
licences Trademarks Goodwill Software<br />
Development<br />
costs Other Total<br />
At 1 January 19.1 304.0 406.4 55.8 43.0 59.3 887.6<br />
Acquisitions <strong>and</strong> additions 0.4 1.6 2.7 15.5 20.2<br />
Shares sold on the market (0.1) (20.4) (20.0) (1.7) (42.2)<br />
Other movements (a) 1.6 5.2 (7.1) (0.3)<br />
Translation adjustment 0.5 24.0 38.6 2.0 4.0 69.1<br />
AT 31 DECEMBER 19.9 328.0 445.0 40.6 30.9 70.1 934.5<br />
Depreciation <strong>and</strong> impairment losses<br />
At 1 January 16.4 6.6 19.8 43.5 31.8 10.7 128.8<br />
Translation adjustment 0.2 0.5 1.4 1.4 0.7 4.2<br />
Increases 0.3 6.0 7.9 5.0 19.2<br />
Impairment losses 14.7 14.7<br />
Depreciation <strong>and</strong> impairment losses<br />
written off on disposals (0.1) (20.4) (19.1) (39.6)<br />
Other movements (a) (0.6) (0.6)<br />
AT 31 DECEMBER 16.8 7.1 35.9 30.5 20.6 15.8 126.7<br />
Carrying amount at 1 January 2.7 297.4 386.6 12.3 11.2 48.6 758.8<br />
CARRYING AMOUNT<br />
AT 31 DECEMBER 3.1 320.9 409.1 10.1 10.3 54.3 807.8<br />
(a) Including changes in scope of consolidation.<br />
GROUPE SEB<br />
FINANCIAL REPORT AND REGISTRATION DOCUMENT <strong>2010</strong><br />
83
3 NOTES<br />
CONSOLIDATED FINANCIAL STATEMENTS<br />
TO THE CONSOLIDATED FINANCIAL STATEMENTS<br />
2009<br />
(in € millions)<br />
Cost<br />
Patents <strong>and</strong><br />
licences Trademarks Goodwill Software<br />
Development<br />
costs Other Total<br />
At 1 January 18.6 300.8 419.8 54.1 35.6 52.8 881.7<br />
Acquisitions <strong>and</strong> additions 0.2 1.8 3.6 11.4 17.0<br />
Shares sold on the market (2.1) (0.7) (0.2) (3.0)<br />
Other movements (a) 0.1 4.4 (3.8) 0.7<br />
Translation adjustment 0.3 3.2 13.4 1.9 0.1 (0.9) (8.8)<br />
AT 31 DECEMBER 19.1 304.0 406.4 55.8 43.0 59.3 887.6<br />
Depreciation <strong>and</strong> impairment losses<br />
At 1 January 16.3 6.9 39.5 23.3 7.1 93.1<br />
Translation adjustment 0.1 (0.3) (0.6) 1.1 (0.2) 0.1<br />
Increases 0.2 5.5 8.1 3.4 17.2<br />
Impairment losses 20.4 0.9 21.3<br />
Depreciation <strong>and</strong> impairment losses<br />
written off on disposals (2.1) (0.6) (2.7)<br />
Other movements (a) (0.2) (0.5) 0.1 0.4 (0.2)<br />
AT 31 DECEMBER 16.4 6.6 19.8 43.5 31.8 10.7 128.8<br />
Carrying amount at 1 January 2.3 293.9 419.8 14.6 12.3 45.7 788.6<br />
CARRYING AMOUNT<br />
AT 31 DECEMBER 2.7 297.4 386.6 12.3 11.2 48.6 758.8<br />
(a) Including changes in scope of consolidation.<br />
2008<br />
(in € millions)<br />
Cost<br />
Patents <strong>and</strong><br />
licences Trademarks Goodwill Software<br />
Development<br />
costs Other Total<br />
At 1 January 18.5 217.7 111.1 51.2 29.9 19.2 447.6<br />
Acquisitions <strong>and</strong> additions 0.2 4.3 2.6 13.2 20.3<br />
Shares sold on the market (1.0) (2.2) (0.5) (3.7)<br />
Other movements (a) 75.1 269.0 1.9 5.4 17.6 369.0<br />
Translation adjustment (0.1) 8.0 39.7 (2.3) (0.1) 3.3 48.5<br />
AT 31 DECEMBER 18.6 300.8 419.8 54.1 35.6 52.8 881.7<br />
Depreciation <strong>and</strong> impairment losses<br />
At 1 January 14.5 4.4 36.3 16.3 3.9 75.4<br />
Translation adjustment 0.4 (1.4) 0.4 (0.6)<br />
Increases 1.0 5.6 8.1 1.7 16.4<br />
Impairment losses 0.8 2.1 0.9 0.6 4.4<br />
Depreciation <strong>and</strong> impairment losses<br />
written off on disposals (1.0) (2.0) (3.0)<br />
Other movements (a) 0.5 0.5<br />
AT 31 DECEMBER 16.3 6.9 39.5 23.3 7.1 93.1<br />
Carrying amount at 1 January 4.0 213.3 111.1 14.9 13.6 15.3 372.2<br />
CARRYING AMOUNT<br />
AT 31 DECEMBER 2.3 293.9 419.8 14.6 12.3 45.7 788.6<br />
(a) Including changes in scope of consolidation.<br />
In 2008, other movements mainly comprised the effect of acquiring control<br />
of Supor, which was fully consolidated for the first time during the period,<br />
<strong>and</strong> include recognition of the trademark for €75.1 million <strong>and</strong> goodwill for<br />
€269 million (see Note 2.3).<br />
Trademarks <strong>and</strong> goodwill were tested for impairment according to the<br />
method described in Note 1.4.3. by comparing their carrying amount to<br />
their value in use, with the exception of the trademarks mentioned below,<br />
which were valued using the relief from royalty method.<br />
The discount rates used were determined based on the weighted average<br />
cost of capital, taking into account market interest rates, <strong>and</strong> debt ratio,<br />
beta <strong>and</strong> average equity risk premium based on historical data. The equity<br />
risk premium used for <strong>2010</strong> was 5% (5.25% in 2009). Specific equity risk<br />
premiums ranging from 0.5% to 4.0% were applied to the Group’s different<br />
CGUs, according to their size, region <strong>and</strong> other specific characteristics.<br />
Impairment tests in <strong>2010</strong> were generally based on a 2011 budget similar to<br />
the budget for <strong>2010</strong>.<br />
In <strong>2010</strong>, an additional impairment loss of €14.7 million was booked against<br />
All-Clad goodwill (see Note 6).<br />
84 FINANCIAL REPORT AND REGISTRATION DOCUMENT <strong>2010</strong> GROUPE SEB
3<br />
CONSOLIDATED FINANCIAL STATEMENTS<br />
NOTES TO THE CONSOLIDATED FINANCIAL STATEMENTS<br />
The All-Clad CGU – including the trademark for €108.2 million <strong>and</strong> goodwill<br />
for €64 million at 31 December <strong>2010</strong> – was tested for impairment by<br />
comparing its carrying amount to its value in use, defi ned as the sum of<br />
discounted future cash flows for the 5-year period covered by the business<br />
plan. Terminal value was determined based on the expected future cash<br />
flows to be derived from the assets in the last year of the plan. The main<br />
actuarial assumptions used were as follows:<br />
discount rate of 8.83%, down slightly on the 2009 rate of 9.02% <strong>and</strong> 2008<br />
rate of 9.37%, due to the fall in risk-free rates;<br />
long-term growth rate of 3%, in line with forecasts for the high-end<br />
household equipment market, similar to the rate used since All-Clad was<br />
acquired.<br />
Following the test at 31 December <strong>2010</strong>, an impairment loss of €14.7 million<br />
was recorded in the consolidated fi nancial statements in addition to the<br />
€20.4 million loss already booked in 2009. After the severe recession that<br />
depressed dem<strong>and</strong> in the United States in 2009, sales <strong>and</strong> other business<br />
indicators began to show signs of recovery in <strong>2010</strong>. However, All-Clad has<br />
still not returned to the levels forecast in the initial business plan, which is<br />
the reason for the additional goodwill impairment.<br />
The sensitivity of test results to changes in the individual assumptions used in<br />
<strong>2010</strong> to determine the value in use of the All-Clad CGU assets is as follows:<br />
a one-point decrease in the discount rate would mean that no impairment<br />
loss would have been booked in <strong>2010</strong>;<br />
0.5- <strong>and</strong> 1-point increases in the discount rate would result in an additional<br />
impairment loss of €12.7 million <strong>and</strong> €23.5 million, respectively;<br />
a one-point decrease in the growth rate to perpetuity would result in an<br />
additional impairment loss of €17.5 million;<br />
a one-point decrease in operating margin in the last year of the business<br />
plan – used to calculate terminal value – would result in an impairment<br />
loss of €6.5 million.<br />
as regards the sales trends for 2011-2015, Group management currently<br />
considers the most probable scenario to be based on average annual<br />
growth of 5.5%. Compared to these forecasts, a 10% downward revision<br />
of forecast sales over the entire period would result in an additional<br />
impairment loss of €37.1 million.<br />
In 2008, impairment losses of €3.5 million were recognised respectively<br />
on the Mirro WearEver br<strong>and</strong>s (Mirro, WearEver <strong>and</strong> AirBake) <strong>and</strong> other<br />
related intangible assets, following an impairment test of the Mirro WearEver<br />
CGU (see Note 6), reflecting lower-than-expected profits <strong>and</strong> their impact<br />
on the business plan for future years.<br />
The carrying amount of these br<strong>and</strong>s was €4.5 million at 31 December <strong>2010</strong>.<br />
The test performed at that date on the CGU that owns these br<strong>and</strong>s did<br />
not result in any impairment losses in addition to those booked previously.<br />
The main actuarial assumptions used were as follows:<br />
discount rate after tax of 8.83%;<br />
long-term growth rate of 2%.<br />
A 1-point increase in the discount rate or a 3% downward revision of forecast<br />
sales for 2011-2015 would result in the carrying amount of the br<strong>and</strong>s being<br />
written down in full.<br />
Impairment tests on other trademarks <strong>and</strong> goodwill in <strong>2010</strong>, 2009 <strong>and</strong> 2008<br />
did not result in the recognition of any impairment losses.<br />
The carrying amount of the Supor CGU – including the br<strong>and</strong> for €91.6 million<br />
<strong>and</strong> goodwill for €326.7 million – was compared to its market value at<br />
31 December <strong>2010</strong>, as ZJ Supor is listed on the Shenzen stock exchange<br />
<strong>and</strong> there is a liquid market for its shares. At 31 December <strong>2010</strong>, Supor’s<br />
share price was RMB 23.9, while its carrying amount was RMB 13.<br />
The Arno, Lagostina, Rowenta, Panex, Krups <strong>and</strong> Moulinex trademarks,<br />
which are carried in the balance sheet at 31 December <strong>2010</strong> for €38.1 million,<br />
€30.4 million, €23.2 million, €12.05 million, €7.8 million <strong>and</strong> €1.0 million<br />
respectively, were tested by discounting estimated future royalty revenues<br />
from the licensing of the trademarks. The main assumptions used in <strong>2010</strong><br />
were as follows:<br />
royalty rate: 2% to 5.5%, unchanged from 2009 <strong>and</strong> 2008;<br />
discount rate after tax: 7.81% (Rowenta) to 14.56% (Arno) versus 8.30%<br />
to 14.9% in 2009;<br />
long-term growth rate: 1% to 3%, unchanged from 2009 <strong>and</strong> 2008.<br />
For all of these assets, the sensitivity of value in use to different scenarios was<br />
analysed for the period between 2011 <strong>and</strong> 2015, including their sensitivity<br />
to a one-point increase in the discount rate <strong>and</strong> one-point decrease in the<br />
growth rate to perpetuity. The decreases in value in use under each of these<br />
simulations would not result in the recognition of any impairment losses on<br />
trademarks in the balance sheet. The test margin on the Lagostina br<strong>and</strong><br />
would be reduced to zero if current <strong>2010</strong>-2014 sales forecasts were reduced<br />
by 28%.<br />
3<br />
GROUPE SEB<br />
FINANCIAL REPORT AND REGISTRATION DOCUMENT <strong>2010</strong><br />
85
3 NOTES<br />
CONSOLIDATED FINANCIAL STATEMENTS<br />
TO THE CONSOLIDATED FINANCIAL STATEMENTS<br />
NOTE 11<br />
PROPERTY, PLANT AND EQUIPMENT<br />
<strong>2010</strong><br />
(in € millions) L<strong>and</strong> Buildings<br />
Cost<br />
Machinery <strong>and</strong><br />
equipment<br />
Other<br />
Assets in<br />
progress<br />
At 1 January 26.7 272.3 703.6 101.9 41.7 1,146.2<br />
Acquisitions <strong>and</strong> additions 0.1 10.0 30.5 13.7 66.3 120.6<br />
Shares sold on the market (3.9) (26.8) (54.2) (9.6) (6.3) (100.8)<br />
Other movements (a) 0.1 5.6 31.9 2.3 (40.2) (0.3)<br />
Translation adjustment 1.3 9.2 17.7 3.7 1.7 33.6<br />
AT 31 DECEMBER 24.3 270.4 729.5 112.0 63.1 1,199.3<br />
Depreciation <strong>and</strong> impairment losses<br />
At 1 January 6.3 150.7 530.0 67.8 754.8<br />
Translation adjustment 2.6 10.2 2.2 15.0<br />
Depreciation for the period 0.3 10.7 57.9 11.2 80.1<br />
Impairment losses 1.0 2.5 3.5<br />
Depreciation <strong>and</strong> impairment losses<br />
written off on disposals (0.5) (22.0) (50.0) (8.2) (80.7)<br />
Other movements (a) 0.7 (1.1) 0.5 0.1<br />
AT 31 DECEMBER 6.2 143.7 549.5 73.5 772.8<br />
Carrying amount at 1 January 20.4 121.6 173.6 34.1 41.7 391.4<br />
CARRYING AMOUNT<br />
AT 31 DECEMBER 18.1 126.7 180.0 38.5 63.1 426.5<br />
(a) Including changes in scope of consolidation.<br />
Total<br />
2009<br />
(in € millions) L<strong>and</strong> Buildings<br />
Cost<br />
Machinery <strong>and</strong><br />
equipment<br />
Other<br />
Assets in<br />
progress<br />
At 1 January 24.4 253.2 662.0 103.9 44.3 1,087.8<br />
Acquisitions <strong>and</strong> additions 0.1 13.1 38.2 8.4 32.4 92.2<br />
Shares sold on the market (0.1) (3.6) (36.1) (7.2) (0.8) (47.8)<br />
Other movements (a) 0.6 8.0 29.4 (4.4) (34.7) (1.1)<br />
Translation adjustment 1.7 1.6 10.1 1.2 0.5 15.1<br />
AT 31 DECEMBER 26.7 272.3 703.6 101.9 41.7 1,146.2<br />
Depreciation <strong>and</strong> impairment losses<br />
At 1 January 6.7 136.7 494.0 69.2 706.6<br />
Translation adjustment 1.7 7.3 0.8 9.8<br />
Depreciation for the period 0.3 10.6 55.1 10.7 76.7<br />
Impairment losses 2.2 6.1 0.1 8.4<br />
Depreciation <strong>and</strong> impairment losses<br />
written off on disposals (0.1) (3.5) (32.5) (6.7) (42.8)<br />
Other movements (a) (0.6) 3.0 (6.3) (3.9)<br />
AT 31 DECEMBER 6.3 150.7 530.0 67.8 754.8<br />
Carrying amount at 1 January 17.7 116.5 168.0 34.7 44.3 381.2<br />
CARRYING AMOUNT<br />
AT 31 DECEMBER 20.4 121.6 173.6 34.1 41.7 391.4<br />
(a) Including changes in scope of consolidation.<br />
Total<br />
86 FINANCIAL REPORT AND REGISTRATION DOCUMENT <strong>2010</strong> GROUPE SEB
3<br />
CONSOLIDATED FINANCIAL STATEMENTS<br />
NOTES TO THE CONSOLIDATED FINANCIAL STATEMENTS<br />
2008<br />
(in € millions) L<strong>and</strong> Buildings<br />
Cost<br />
Machinery <strong>and</strong><br />
equipment<br />
Other<br />
Assets in<br />
progress<br />
At 1 January 26.7 223.6 613.9 95.2 31.7 991.1<br />
Acquisitions <strong>and</strong> additions 0.1 4.3 34.3 13.7 43.6 96.0<br />
Shares sold on the market (1.1) (10.9) (38.2) (11.7) (0.7) (62.6)<br />
Other movements (a) 0.1 34.6 55.3 8.5 (30.7) 67.8<br />
Translation adjustment (1.4) 1.6 (3.3) (1.8) 0.4 (4.5)<br />
AT 31 DECEMBER 24.4 253.2 662.0 103.9 44.3 1,087.8<br />
Depreciation <strong>and</strong> impairment losses<br />
At 1 January 5.4 129.4 461.1 66.2 662.1<br />
Translation adjustment (0.7) (3.3) (2.0) (6.0)<br />
Depreciation for the period 0.3 9.8 53.1 11.0 74.2<br />
Impairment losses 1.4 5.6 8.7 0.5 16.2<br />
Depreciation <strong>and</strong> impairment losses<br />
written off on disposals (0.4) (7.4) (35.4) (10.9) (54.1)<br />
Other movements (a) 9.8 4.4 14.2<br />
AT 31 DECEMBER 6.7 136.7 494.0 69.2 706.6<br />
Carrying amount at 1 January 21.3 94.2 152.8 29.0 31.7 329.0<br />
CARRYING AMOUNT<br />
AT 31 DECEMBER 17.7 116.5 168.0 34.7 44.3 381.2<br />
(a) Including changes in scope of consolidation.<br />
Total<br />
The Group’s operations are mainly carried out at 21 major plants worldwide, as follows:<br />
Region Country Plant Main products<br />
FRANCE France Rumilly Cookware, informal meal appliances, scales<br />
Selongey<br />
Pressure cookers<br />
Pont-Évêque<br />
Irons, steam generators, epilators<br />
Is-sur-Tille<br />
Deep fryers, ovens<br />
Lourdes<br />
Food processors <strong>and</strong> choppers<br />
Mayenne<br />
Food processors, blenders<br />
Saint-Lô<br />
Electronic components<br />
Vernon<br />
Vacuum cleaners<br />
WESTERN EUROPE Germany Erbach Steam irons<br />
Italy Omegna Cookware<br />
NORTH AMERICA United States Canonsburg Cookware<br />
SOUTH AMERICA Brazil São Paulo Blenders, fans<br />
São Bernardo<br />
Cookware<br />
Colombia Cajica Blenders, fans<br />
ASIA/PACIFIC China Shanghai Steam irons, steamers, kettles<br />
Yuhuan<br />
Cookware<br />
Wuhan<br />
Cookware<br />
Hangzhou<br />
Rice cookers<br />
Shaoxing Electric pressure cookers, induction hotplates<br />
Vietnam Vietnam Cookware<br />
OTHER COUNTRIES Russia Saint Petersburg Cookware<br />
3<br />
The Group owns all of its plants, except the Sao Bernardo (Brazil) <strong>and</strong><br />
Shanghai (China) sites.<br />
Logistics warehouses <strong>and</strong> commercial <strong>and</strong> offi ce buildings are generally<br />
leased, except for the Group’s headquarters building in Ecully <strong>and</strong> another<br />
office building in Lyon.<br />
All leases are with unrelated lessors <strong>and</strong> reflect normal market terms.<br />
At 31 December <strong>2010</strong>, the aggregate carrying amount of property, plant<br />
<strong>and</strong> equipment held for sale was €3.2 million (€3.7 million at 31 December<br />
2009 <strong>and</strong> €3.8 million at 31 December 2008). They correspond primarily<br />
to manufacturing assets in Brazil for which the sale was agreed in 2008.<br />
The actual sale took place after the year-end once the site decontamination<br />
certificates had been obtained (see Note 31).<br />
Other movements for 2008 mainly refl ected the fi rst-time consolidation<br />
of Supor.<br />
GROUPE SEB<br />
FINANCIAL REPORT AND REGISTRATION DOCUMENT <strong>2010</strong><br />
87
3 NOTES<br />
CONSOLIDATED FINANCIAL STATEMENTS<br />
TO THE CONSOLIDATED FINANCIAL STATEMENTS<br />
NOTE 12<br />
LEASES<br />
Finance leases can be analysed as follows:<br />
(in € millions) <strong>2010</strong> 2009 2008<br />
L<strong>and</strong><br />
Buildings 0.8 0.3 0.2<br />
Machinery <strong>and</strong> equipment 2.2 2.5 2.9<br />
Other 0.1 0.1 0.1<br />
CARRYING AMOUNT 3.1 2.9 3.2<br />
These amounts are included in Note 11 – Property, plant <strong>and</strong> equipment.<br />
<strong>Groupe</strong> SEB does not have any finance leases related to intangible assets or investment property.<br />
Commitments under finance leases <strong>and</strong> non-cancellable operating leases are as follows:<br />
<strong>2010</strong><br />
(in € millions) Finance leases Operating leases<br />
LEASE COMMITMENTS<br />
Due within one year 1.1 35.7<br />
Due in one to five years 1.6 68.0<br />
Due beyond five years 11.4<br />
TOTAL MINIMUM FUTURE LEASE PAYMENTS 2.7 115.1<br />
Future interest costs<br />
DISCOUNTED PRESENT VALUE OF LEASE COMMITMENTS 2.7 115.1<br />
Lease costs recorded in expenses for the year are as follows:<br />
(in € millions) <strong>2010</strong> 2009 2008<br />
Lease costs 40.1 32.8 33.4<br />
NOTE 13<br />
INVESTMENTS IN ASSOCIATES, OTHER INVESTMENTS<br />
AND OTHER NON-CURRENT FINANCIAL ASSETS<br />
13.1. INVESTMENTS<br />
13.1.1. Investments in associates<br />
(in € millions) <strong>2010</strong> 2009 2008<br />
COMPANY<br />
<strong>Groupe</strong> SEB Retailing 0.1<br />
ZJ Supor<br />
0.1<br />
At 31 December 2008, investments in associates corresponded to <strong>Groupe</strong><br />
SEB Retailing, a wholly-owned French company that has been fully<br />
consolidated as from 1 January 2009.<br />
13.1.2. Other investments<br />
13.2. OTHER NON-CURRENT FINANCIAL<br />
ASSETS<br />
These assets mainly comprise guarantee deposits, mainly for property<br />
leases.<br />
There have been no material changes in <strong>Groupe</strong> SEB’s other investments<br />
since 2007.<br />
88 FINANCIAL REPORT AND REGISTRATION DOCUMENT <strong>2010</strong> GROUPE SEB
3<br />
CONSOLIDATED FINANCIAL STATEMENTS<br />
NOTES TO THE CONSOLIDATED FINANCIAL STATEMENTS<br />
NOTE 14<br />
PRODUCT DEVELOPMENT COSTS<br />
(in € millions) <strong>2010</strong> 2009 2008<br />
RESEARCH AND DEVELOPMENT EXPENDITURE 68.1 59.0 58.1<br />
as a % of revenue 1.9% 1.9% 1.8%<br />
CAPITALISED DEVELOPMENT COSTS (8.1) (9.0) (8.3)<br />
as a % of R&D costs 11.9% 15.3% 14.3%<br />
RESEARCH AND DEVELOPMENT COSTS RECOGNISED DIRECTLY<br />
IN THE INCOME STATEMENT (NOTE 4) (60.0) (50.0) (49.8)<br />
AMORTISATION FOR THE PERIOD RECOGNISED IN COST OF SALES (9.1) (8.1) (8.1)<br />
TOTAL COST RECOGNISED IN THE INCOME STATEMENT (69.1) (58.1) (57.9)<br />
as a % of revenue 1.9% 1.8% 1.8%<br />
In <strong>2010</strong>, research <strong>and</strong> development expenditure totalled €68.1 million<br />
compared to €59.0 million in 2009, including industrial property costs<br />
reclassified from administrative costs. To facilitate year-on-year comparisons,<br />
the corresponding amounts for 2008 have also been reclassified.<br />
The research tax credit deducted from the amounts above stood at<br />
€5.2 million in <strong>2010</strong>, €5.4 million in 2009 <strong>and</strong> €5.9 million in 2008.<br />
Capitalised development costs amounted to €8.1 million, versus €9.0 million<br />
in 2009 <strong>and</strong> €8.3 million in 2008.<br />
In all, research <strong>and</strong> development costs recognised in the income statement<br />
came to €69.1 million, versus €58.1 million in 2009 <strong>and</strong> €57.9 million in 2008.<br />
NOTE 15<br />
INVENTORIES<br />
<strong>2010</strong> 2009 2008<br />
(in € millions)<br />
Cost Provisions<br />
Carrying<br />
amount Cost Provisions<br />
Carrying<br />
amount Cost Provisions<br />
Carrying<br />
amount<br />
Raw materials 180.2 (12.5) 167.7 137.4 (12.2) 125.2 119.4 (11.1) 108.3<br />
Work in progress 12.6 (1.0) 11.6 13.7 (0.6) 13.1 40.6 (0.4) 40.2<br />
Finished products 469.2 (13.0) 456.2 350.7 (22.7) 328.0 490.4 (24.3) 466.1<br />
3<br />
TOTAL 662.0 (26.5) 635.5 501.8 (35.5) 466.3 650.4 (35.8) 614.6<br />
NOTE 16<br />
TRADE RECEIVABLES<br />
(in € millions) <strong>2010</strong> 2009 2008<br />
Trade receivables (including discounted bills) 749.4 650.0 656.4<br />
Provisions for doubtful debts (15.5) (22.9) (10.8)<br />
TOTAL 733.9 627.1 645.6<br />
The fair value of trade receivables is equivalent to their carrying amount, in view of their short maturities.<br />
A receivables aging analysis is presented in Note 26.4.<br />
GROUPE SEB<br />
FINANCIAL REPORT AND REGISTRATION DOCUMENT <strong>2010</strong><br />
89
3 NOTES<br />
CONSOLIDATED FINANCIAL STATEMENTS<br />
TO THE CONSOLIDATED FINANCIAL STATEMENTS<br />
NOTE 17<br />
OTHER RECEIVABLES<br />
(in € millions) <strong>2010</strong> 2009 2008<br />
OTHER NON-CURRENT RECEIVABLES 4.2 5.0 2.9<br />
Prepaid expenses 10.0 8.9 8.5<br />
Prepaid <strong>and</strong> recoverable taxes <strong>and</strong> other receivables 49.4 39.2 46.4<br />
OTHER RECEIVABLES 59.4 48.1 54.9<br />
The fair value of prepaid <strong>and</strong> recoverable taxes <strong>and</strong> other receivables is equivalent to their carrying amount.<br />
At 31 December <strong>2010</strong>, other receivables broke down as follows:<br />
(in € millions) Current Non-current Total<br />
Prepaid expenses 10.0 1.1 11.1<br />
Prepaid <strong>and</strong> recoverable taxes <strong>and</strong> other receivables 49.3 3.2 52.5<br />
TOTAL 59.3 4.3 63.6<br />
NOTE 18<br />
CASH AND CASH EQUIVALENTS<br />
(in € millions) <strong>2010</strong> 2009 2008<br />
Cash 181.9 227.9 224.3<br />
Marketable securities 54.7 79.9 0.3<br />
TOTAL 236.6 307.8 224.6<br />
Cash equivalents at 31 December <strong>2010</strong> consist mainly of very short-term investments, such as SICAV money market funds, measured at market value at<br />
the balance sheet date.<br />
NOTE 19<br />
EQUITY<br />
19.1. SHARE CAPITAL<br />
At 31 December <strong>2010</strong>, the share capital was made up of 49,951,826 shares<br />
with a par value of €1.<br />
At 31 December 2009, the share capital was made up of 49,951,826 shares<br />
with a par value of €1. In accordance with the Board of Directors’ decision<br />
of 27 February 2009, SEB S.A. cancelled 1,000,000 of the shares held in<br />
treasury by the Group at 31 March 2009.<br />
At 31 December 2008, the share capital was made up of 50,912,138 ordinary<br />
shares with a par value of €1, following the three-for-one stock-split approved<br />
by the General Meeting of 13 May 2008.<br />
One class of shares carries double voting rights <strong>and</strong> the right to a<br />
supplementary dividend.<br />
After deduction of treasury shares, the weighted average number of shares<br />
outst<strong>and</strong>ing for the year was 47,414,375 (46,476,548 in 2009 <strong>and</strong> 47,325,540<br />
in 2008).<br />
At 31 December <strong>2010</strong>, the family group owned 43.68% of the capital (of which<br />
23.68% by FÉDÉRACTIVE <strong>and</strong> 20.00% by VENELLE INVESTISSEMENT) <strong>and</strong><br />
57.47% of the voting rights.<br />
90 FINANCIAL REPORT AND REGISTRATION DOCUMENT <strong>2010</strong> GROUPE SEB
3<br />
CONSOLIDATED FINANCIAL STATEMENTS<br />
NOTES TO THE CONSOLIDATED FINANCIAL STATEMENTS<br />
19.2. STOCK OPTIONS AND PERFORMANCE SHARES<br />
19.2.1. Stock options<br />
Information about stock option plans at 31 December <strong>2010</strong> is provided below:<br />
STOCK OPTIONS<br />
At 31 December <strong>2010</strong> Date Number of options**<br />
Type of option<br />
Option grant<br />
date***<br />
Option<br />
exercise date<br />
Option expiry<br />
date Granted Exercised Cancelled<br />
Outst<strong>and</strong>ing<br />
Exercise price**<br />
(in €)<br />
To purchase<br />
existing shares 19/04/2002 19/04/2006 19/04/<strong>2010</strong> 417,450 396,000 21,450 0 27.88<br />
To purchase<br />
existing shares 17/10/2002 17/10/2006 17/10/<strong>2010</strong> 598,125 488,895 109,230 0 25.15<br />
To purchase<br />
existing shares 18/06/2003 18/06/2007 18/06/2011 612,150 544,824 27,730 39,596 24.24<br />
To purchase<br />
existing shares 18/06/2004 18/06/2008 18/06/2012 539,100 308,104 17,400 213,596 31.67<br />
To purchase<br />
existing shares 08/04/2005 08/04/2009 08/04/2013 554,700 376,267 20,100 158,333 28.00<br />
To purchase<br />
existing shares 16/06/2006 16/06/<strong>2010</strong> 16/06/2014 589,798 294,594 14,707 280,497 29.33<br />
To purchase<br />
existing shares 20/04/2007 20/04/2011 20/04/2015 579,150 0 8,100 571,050 44.00<br />
To purchase<br />
existing shares 13/05/2008 13/05/2012 13/05/2016 1,005,900 0 17,700 988,200 38.35<br />
To purchase<br />
existing shares 12/06/2009 12/06/2013 12/06/2017 371,300 0 1,050 370,250 28.05<br />
To purchase<br />
existing shares 18/06/<strong>2010</strong> 18/06/2014 18/06/2018 412,592 0 0 412,592 53.86<br />
TOTAL* 5,680,265 2,408,684 237,467 3,034,114<br />
* Of which, movements in <strong>2010</strong> 412,592 1,153,549 36,452 (777,409)<br />
Total options to purchase existing shares 5,680,265 2,408,684 237,467 3,034,114<br />
Total options to purchase new shares 0 0 0 0<br />
3<br />
** The number of options <strong>and</strong> the exercise price for plans prior to 16 June 2008 were adjusted following the three-for-one stock split that took place on 16 June 2008.<br />
*** The grant date corresponds to the date of the Board Meeting when the option grants were decided.<br />
In accordance with IFRS 2 – Share-Based Payment, stock options are<br />
measured at the grant date. The valuation method used is based on the<br />
Black & Scholes option pricing model. The initial valuation is not adjusted<br />
for any subsequent changes in value after the grant date.<br />
The value is recognised in employee benefits expense on a straight-line basis<br />
over the option vesting period by adjusting equity.<br />
IFRS 2 has been applied only to stock options granted after 7 November<br />
2002 that had not yet vested at 1 January 2005. As allowed under IFRS 2,<br />
options granted before 7 November 2002 have not been measured or<br />
recognised in the accounts.<br />
The amount recognised in employee benefits expense in <strong>2010</strong> in respect of stock options was €5.0 million, versus €5.8 million in 2009 <strong>and</strong> €4.7 million in<br />
2008. The assumptions used to value options under the Black & Scholes model are as follows:<br />
<strong>2010</strong> plan 2009 plan 2008 plan 2007 plan 2006 plan<br />
INITIAL VALUE (IN € MILLIONS) 4.5 2.1 8.7 6.8 2.5<br />
AMOUNT RECOGNISED IN EMPLOYEE<br />
BENEFITS EXPENSE (IN € MILLIONS) 0.7 0.6 2.0 1.5 0.2<br />
ASSUMPTIONS<br />
Share price at the option grant date (in €) 53.9 29.7 37.6 44.0 29.3<br />
Volatility 25.0% 26.0% 25.0% 30.0% 20.0%<br />
Risk-free interest rate 3.40% 3.50% 4.50% 4.42% 3.80%<br />
Exercise price (in €) 53.86 28.05 38.35 44.00 29.33<br />
Life of the options (in years) (a) 5 5 5 5 5<br />
Dividend rate 2.8% 3.0% 2.5% 2.0% 3.0%<br />
(a) Corresponding to the average exercise period.<br />
GROUPE SEB<br />
FINANCIAL REPORT AND REGISTRATION DOCUMENT <strong>2010</strong><br />
91
3 NOTES<br />
CONSOLIDATED FINANCIAL STATEMENTS<br />
TO THE CONSOLIDATED FINANCIAL STATEMENTS<br />
19.2.2. Performance shares<br />
In 2009 <strong>and</strong> <strong>2010</strong>, the Board of Directors granted performance shares to<br />
certain employees <strong>and</strong> corporate officers.<br />
Shares granted under the plan are subject to a two-year vesting period<br />
<strong>and</strong> certain performance obligations. The performance targets concern<br />
growth in revenue <strong>and</strong> operating margin <strong>and</strong> are the same as those used<br />
to determine senior management bonuses. Vested shares are subject to a<br />
two-year lock-up.<br />
Further information on the performance share plan is provided in the table below:<br />
At 31 December <strong>2010</strong> Dates Number of shares<br />
Share price at<br />
Type of option Grant date* Vesting date End of lock-up Granted Vested Cancelled Outst<strong>and</strong>ing grant date**<br />
Performance shares 12/06/2009 12/06/2011 12/06/2013 50,472 0 451 50,021 30.08<br />
Performance shares 18/06/<strong>2010</strong> 18/06/2012 18/06/2014 58,363 0 0 58,363 55.00<br />
* The grant date corresponds to the date of the Board Meeting when the performance share grants were decided.<br />
** Opening price on the day of the Board of Directors’ Meeting.<br />
The fair value of performance shares includes a discount to reflect the impact<br />
of the lock-up period. The measurement method used to determine this<br />
discount is based on a strategy that consists of selling the shares under<br />
a four-year forward contract (corresponding to the vesting/lock-up period)<br />
<strong>and</strong> immediately purchasing an equivalent number of shares free of any<br />
restrictions, with the purchase financed by debt repayable at the end of the<br />
lock-up using the proceeds from the forward sale <strong>and</strong> dividends received<br />
during the lock-up period.<br />
The main assumptions applied to determine the fair value of performance shares are as follows:<br />
<strong>2010</strong> plan 2009 plan<br />
ASSUMPTIONS<br />
Share price on the grant date (in €) 55.00 30.80<br />
Four-year risk-free interest rate 3.28% 2.50%<br />
Average interest rate on a four-year general purpose loan 6.88% 6.90%<br />
Dividend rate 2.36% 3.28%<br />
INITIAL VALUE (IN € MILLIONS) 2.7 1.2<br />
COST RECOGNISED IN EMPLOYEE BENEFITS EXPENSE IN <strong>2010</strong> (IN € MILLIONS) 0.8 0.5<br />
19.3. RESERVES AND RETAINED EARNINGS<br />
(BEFORE APPROPRIATION OF PROFIT)<br />
Reserves <strong>and</strong> retained earnings include the reserves recorded in the<br />
balance sheet of SEB S.A. (including €747 million available for distribution<br />
at 31 December <strong>2010</strong>, €753 million at 31 December 2009 <strong>and</strong> €742 million<br />
at 31 December 2008), <strong>and</strong> SEB S.A.’s share of the post-acquisition retained<br />
earnings of consolidated subsidiaries.<br />
SEB S.A.’s share of the retained earnings of foreign subsidiaries is considered<br />
as being permanently reinvested <strong>and</strong> withholding taxes or additional taxes on<br />
distributed income are recognised only when distribution of these amounts<br />
is planned or considered probable.<br />
19.4. TREASURY STOCK<br />
The Group’s share buyback policy is to acquire shares:<br />
for cancellation in order to reduce the Company’s capital;<br />
for allocation to employees, managers or senior executives of the<br />
Company or of related companies upon exercise of stock options;<br />
for delivery on redemption, conversion, exchange or exercise of share<br />
equivalents.<br />
Share buybacks are carried out based on market opportunities <strong>and</strong> only<br />
when the Group has sufficient cash to fund the transactions.<br />
In <strong>2010</strong>, the Group bought back 264,329 SEB shares on the market at a<br />
weighted average price of €56.54 <strong>and</strong> sold 1,433,074 shares on the market<br />
at an average price of €33.76. The after-tax loss on the sales, in the amount<br />
of €9 million, was recognised directly in equity without affecting profit for<br />
the period.<br />
At 31 December <strong>2010</strong>, the Group held 1,980,698 shares in treasury, acquired<br />
at an average price of €31.14.<br />
92 FINANCIAL REPORT AND REGISTRATION DOCUMENT <strong>2010</strong> GROUPE SEB
3<br />
CONSOLIDATED FINANCIAL STATEMENTS<br />
NOTES TO THE CONSOLIDATED FINANCIAL STATEMENTS<br />
Movements in <strong>2010</strong>, 2009 <strong>and</strong> 2008 were as follows:<br />
(in number of shares) <strong>2010</strong> 2009 2008<br />
Shares held in treasury at 1 January 3,149,443 4,376,100 2,983,515<br />
Purchases<br />
Buyback plan 149,072 1,518,500<br />
Liquidity contract 264,329 578,136 438,302<br />
Sales<br />
Shares sold on the market (279,525) (570,601) (433,718)<br />
Shares allocated on exercise of stock options (1,153,549) (383,264) (130,499)<br />
SHARES CANCELLED DURING THE PERIOD (1,000,000)<br />
SHARES HELD IN TREASURY AT 31 DECEMBER 1,980,698 3,149,443 4,376,100<br />
NOTE 20<br />
NON-CONTROLLING INTERESTS<br />
Changes in non-controlling interests are as follows:<br />
(in € millions) <strong>2010</strong> 2009 2008<br />
AT 1 JANUARY 138.8 131.6<br />
Non-controlling interests in profit 23.2 16.8 11.2<br />
Dividends paid (4.7) (4.8)<br />
Exercise of stock options 1.3<br />
Non-controlling interests in share issues by subsidiaries 4.3<br />
Changes in scope of consolidation 100.2<br />
Translation adjustment 15.8 (4.8) 14.6<br />
3<br />
AT 31 DECEMBER 173.1 138.8 131.6<br />
Non-controlling interests since 31 December 2008 concern ZJ Supor <strong>and</strong><br />
the <strong>2010</strong> change mainly reflected changes in ZJ Supor’s retained earnings,<br />
corresponding essentially to recognition of profit for the period <strong>and</strong> the effect<br />
of translating the Company’s financial statements. In the future, changes may<br />
occur exceptionally as a result of purchases, sales or any other voluntary<br />
adjustments to the Group’s interest in ZJ Supor.<br />
There were no non-controlling interests at 31 December 2007.<br />
NOTE 21<br />
PROVISIONS<br />
Provisions are classified as short-term or long-term according to whether the obligation is expected to be settled within or beyond one year.<br />
Provision movements (other than provisions for pensions <strong>and</strong> other post-employment benefits) were as follows:<br />
<strong>2010</strong> 2009 2008<br />
(in € millions)<br />
Long-term Short-term Long-term Short-term Long-term Short-term<br />
Pension <strong>and</strong> other post-employment benefit<br />
obligations (Note 22) 78.0 6.0 76.4 7.6 72.2 12.3<br />
Product warranties (Note 21.1) 3.0 31.8 3.4 35.6 1.1 38.3<br />
Claims <strong>and</strong> litigation <strong>and</strong> other contingencies<br />
(Note 21.2) 25.0 25.5 17.5 14.4 13.4 16.3<br />
Restructuring provisions (Note 21.3) 14.0 15.0 14.0 29.3 15.6 10.3<br />
TOTAL 120.0 78.3 111.3 86.9 102.3 77.2<br />
GROUPE SEB<br />
FINANCIAL REPORT AND REGISTRATION DOCUMENT <strong>2010</strong><br />
93
3 NOTES<br />
CONSOLIDATED FINANCIAL STATEMENTS<br />
TO THE CONSOLIDATED FINANCIAL STATEMENTS<br />
(in € millions) 1 January <strong>2010</strong> Increases Reversals Utilisations<br />
Other<br />
movements (a)<br />
31 December<br />
<strong>2010</strong><br />
Product warranties (Note 21.1) 39.0 24.7 1.1 26.4 (1.3) 34.9<br />
Claims <strong>and</strong> litigation <strong>and</strong> other<br />
contingencies (Note 21.2) 32.0 25.1 1.7 9.7 4.7 50.4<br />
Restructuring provisions (Note 21.3) 43.3 8.4 4.5 18.8 (0.6) 29.0<br />
TOTAL 114.3 58.2 7.3 54.9 (1.9) 114.3<br />
(a) “Other movements” include translation adjustments <strong>and</strong> the effect of changes in the scope of consolidation.<br />
(in € millions) 1 January 2009 Increases Reversals Utilisations<br />
Other<br />
movements (a)<br />
31 December<br />
2009<br />
Product warranties (Note 21.1) 39.4 32.5 1.7 31.2 39.0<br />
Claims <strong>and</strong> litigation <strong>and</strong> other<br />
contingencies (Note 21.2) 29.7 24.1 6.1 15.4 (0.3) 32.0<br />
Restructuring provisions (Note 21.3) 26.0 27.5 1.2 10.2 1.2 43.3<br />
TOTAL 95.1 84.1 9.0 56.8 0.9 114.3<br />
(a) “Other movements” include translation adjustments <strong>and</strong> the effect of changes in the scope of consolidation.<br />
(in € millions) 1 January 2008 Increases Reversals Utilisations<br />
Other<br />
movements (a)<br />
31 December<br />
2008<br />
Product warranties (Note 21.1) 34.4 37.3 32.4 0.1 39.4<br />
Claims <strong>and</strong> litigation <strong>and</strong> other<br />
contingencies (Note 21.2) 32.8 10.1 10.9 4.7 2.4 29.7<br />
Restructuring provisions (Note 21.3) 43.6 11.0 2.9 24.9 (0.8) 26.0<br />
TOTAL 110.8 58.4 13.8 62.0 1.7 95.1<br />
(a) “Other movements” include translation adjustments <strong>and</strong> the effect of changes in the scope of consolidation.<br />
21.1. PRODUCT WARRANTIES<br />
Provisions are recorded for the estimated cost of repairing or replacing<br />
products sold under warranty to customers <strong>and</strong> consumers. The warranty,<br />
which is either legal or contractual, is generally for a period of one or two years.<br />
Provisions for product recalls are recorded as soon as the recall is decided.<br />
21.2. CLAIMS AND LITIGATION AND OTHER<br />
CONTINGENCIES<br />
Certain subsidiaries are involved in claims <strong>and</strong> litigation with third parties. The<br />
corresponding provisions are determined in accordance with the principle<br />
described in Note 1.4.<br />
At 31 December <strong>2010</strong>, the main provisions were as follows:<br />
(in € millions) <strong>2010</strong> 2009 2008<br />
Supplier claims <strong>and</strong> litigation 1.9 2.6 1.5<br />
Local government claims, litigation <strong>and</strong> contingencies 13.5 6.4 8.6<br />
Commercial claims, litigation <strong>and</strong> contingencies 3.6 1.1 2.3<br />
Employee claims, litigation <strong>and</strong> contingencies 14.2 15.1 11.3<br />
Sales returns 1.0 3.2 5.7<br />
Other claims, litigation <strong>and</strong> contingencies 16.2 3.5 0.3<br />
TOTAL 50.4 31.9 29.7<br />
21.3. RESTRUCTURING PROVISIONS<br />
Restructuring provisions break down as follows:<br />
(in € millions) <strong>2010</strong> 2009 2008<br />
Severance costs 22.8 36.8 17.0<br />
Site closure costs 6.2 6.5 9.0<br />
TOTAL 29.0 43.3 26.0<br />
The short-term portion of the <strong>2010</strong> restructuring provision amounted to<br />
€15.0 million. The remaining €14.0 million concern costs expected to be<br />
incurred over the next one to five years, mainly for early retirement schemes<br />
<strong>and</strong> for rent on sites no longer being used.<br />
94 FINANCIAL REPORT AND REGISTRATION DOCUMENT <strong>2010</strong> GROUPE SEB
3<br />
CONSOLIDATED FINANCIAL STATEMENTS<br />
NOTES TO THE CONSOLIDATED FINANCIAL STATEMENTS<br />
NOTE 22<br />
EMPLOYEE BENEFITS<br />
22.1. ASSUMPTIONS<br />
Provisions for pension <strong>and</strong> other post-employment benefi t obligations,<br />
determined as explained in Note 1.4, mainly concern France <strong>and</strong> Germany.<br />
The obligations are estimated by qualified actuaries using a certain number<br />
of assumptions. These assumptions are revised once a year.<br />
Discount rates are determined based on the yields of investment grade<br />
corporate bonds with maturities that match the remaining life of the<br />
obligations at the measurement date.<br />
Assumptions France <strong>2010</strong> Germany <strong>2010</strong><br />
Economic assumptions<br />
Rate of salary increases 3.00% 2.50%<br />
Discount rate 4.25% 4.25%<br />
Expected return on plan assets 4.00%<br />
Average remaining service life of participating employees 7 to 9 years<br />
Demographic assumptions<br />
Retirement age 60 to 65 (a) RRG 2007<br />
Staff turnover 0% to 11%<br />
Mortality tables INSEE TV 2006-2008 HEUBECK 2005 G<br />
(a) Depending on the age of employees <strong>and</strong> their category (management or other).<br />
Assumptions France 2009 Germany 2009<br />
Economic assumptions<br />
Rate of salary increases 3% 2.50%<br />
Discount rate 5.25% 5.25%<br />
Expected return on plan assets 4.50%<br />
Average remaining service life of participating employees 7 to 10 years<br />
Demographic assumptions<br />
Retirement age 60 to 65 (a) RRG 2007<br />
Staff turnover 0% to 11% (a)<br />
Mortality tables INSEE TV 2004-2006 HEUBECK 2005 G<br />
3<br />
(a) Depending on the age of employees <strong>and</strong> their category (management or other).<br />
Assumptions France 2008 Germany 2008<br />
Economic assumptions<br />
Rate of salary increases 3.00% 2.00%<br />
Discount rate 5.60% 6.10%<br />
Expected return on plan assets 4.75%<br />
Average remaining service life of participating employees 8 to 10 years<br />
Demographic assumptions<br />
Retirement age 60 to 65 (a) RRG 2007<br />
Staff turnover 0% to 7% (a)<br />
Mortality tables INSEE TV 2004-2006 HEUBECK 2005 G<br />
(a) Depending on the age of employees <strong>and</strong> their category (management or other).<br />
GROUPE SEB<br />
FINANCIAL REPORT AND REGISTRATION DOCUMENT <strong>2010</strong><br />
95
3 NOTES<br />
CONSOLIDATED FINANCIAL STATEMENTS<br />
TO THE CONSOLIDATED FINANCIAL STATEMENTS<br />
22.2. ANALYSIS OF PENSION AND OTHER POST-EMPLOYMENT BENEFIT OBLIGATIONS<br />
The total obligation breaks down as follows:<br />
<strong>2010</strong><br />
(in € millions)<br />
France Germany Other countries Total<br />
Projected benefit obligation based on final salaries 82.6 62.2 25.6 170.4<br />
Present value of plan assets (32.8) (2.5) (13.8) (49.1)<br />
DEFICIT 49.8 59.7 11.8 121.3<br />
Unrecognised gains <strong>and</strong> (losses) (26.6) (7.8) (2.9) (37.3)<br />
Initial benefit obligation<br />
Unrecognised past service cost<br />
Recognised liability 23.2 51.9 8.9 84.0<br />
Recognised asset<br />
NET 23.2 51.9 8.9 84.0<br />
2009<br />
(in € millions)<br />
France Germany Other countries Total<br />
Projected benefit obligation based on final salaries 68.7 56.7 20.0 145.4<br />
Present value of plan assets (26.2) (2.3) (10.8) (39.3)<br />
DEFICIT 42.5 54.4 9.2 106.1<br />
Unrecognised gains <strong>and</strong> (losses) (19.6) (1.6) (0.9) (22.1)<br />
Initial benefit obligation<br />
Unrecognised past service cost<br />
Recognised liability 22.9 52.8 8.3 84.0<br />
Recognised asset<br />
NET 22.9 52.8 8.3 84.0<br />
2008<br />
(in € millions)<br />
France Germany Other countries Total<br />
Projected benefit obligation based on final salaries 67.7 52.5 18.9 139.1<br />
Present value of plan assets (24.4) (2.4) (9.0) (35.8)<br />
DEFICIT 43.3 50.1 9.9 103.2<br />
Unrecognised gains <strong>and</strong> (losses) (21.2) 3.1 (0.6) (18.7)<br />
Initial benefit obligation<br />
Unrecognised past service cost<br />
Recognised liability 22.1 53.2 9.3 84.4<br />
Recognised asset<br />
NET 22.1 53.2 9.3 84.4<br />
Obligations for the payment of jubilees, calculated using the same<br />
assumptions as for pension obligations, amounted to €6.0 million at<br />
31 December <strong>2010</strong>, €5.7 million at 31 December 2009 <strong>and</strong> €5.5 million at<br />
31 December 2008.<br />
96 FINANCIAL REPORT AND REGISTRATION DOCUMENT <strong>2010</strong> GROUPE SEB
3<br />
CONSOLIDATED FINANCIAL STATEMENTS<br />
NOTES TO THE CONSOLIDATED FINANCIAL STATEMENTS<br />
22.3. RECOGNISED COST<br />
The cost recognised in the income statement for pension <strong>and</strong> other post-employment benefit plans breaks down as follows:<br />
<strong>2010</strong><br />
(in € millions)<br />
France Germany Other countries Total<br />
Service cost 4.2 0.3 1.2 5.7<br />
Interest cost 3.5 2.9 0.6 7.0<br />
Expected return on plan assets (1.2) (0.5) (1.7)<br />
Recognised (gains) <strong>and</strong> losses <strong>and</strong> other 1.9 0.1 (0.1) 1.9<br />
Cost for the period 8.4 3.3 1.2 12.9<br />
2009<br />
(in € millions)<br />
France Germany Other countries Total<br />
Service cost 3.6 0.3 1.1 5.0<br />
Interest cost 3.6 3.1 0.5 7.2<br />
Expected return on plan assets (1.2) (0.5) (1.7)<br />
Recognised (gains) <strong>and</strong> losses <strong>and</strong> other 2.3 0.2 2.5<br />
Cost for the period 8.3 3.4 1.3 13.0<br />
2008<br />
(in € millions)<br />
France Germany Other countries Total<br />
Service cost 3.7 0.4 1.2 5.3<br />
Interest cost 3.2 2.8 1.1 7.1<br />
Expected return on plan assets (1.2) (0.5) (1.7)<br />
Recognised (gains) <strong>and</strong> losses <strong>and</strong> other 0.9 0.1 1.0<br />
Cost for the period 6.7 3.2 1.9 11.8<br />
3<br />
22.4. MOVEMENTS IN PROVISIONS<br />
Movements in provisions for pension <strong>and</strong> other post-employment benefit obligations break down as follows:<br />
(in € millions) <strong>2010</strong> 2009 2008<br />
Net at 1 January 84.0 84.4 84.2<br />
Cost for the period 12.9 13.0 11.7<br />
Contributions paid (14.2) (14.3) (13.2)<br />
Other movements 1.3 0.9 1.7<br />
NET AT 31 DECEMBER 84.0 84.0 84.4<br />
GROUPE SEB<br />
FINANCIAL REPORT AND REGISTRATION DOCUMENT <strong>2010</strong><br />
97
3 NOTES<br />
CONSOLIDATED FINANCIAL STATEMENTS<br />
TO THE CONSOLIDATED FINANCIAL STATEMENTS<br />
22.5. MOVEMENTS IN PENSION AND OTHER POST-EMPLOYMENT BENEFIT OBLIGATIONS<br />
<strong>2010</strong> PENSION AND OTHER POST-EMPLOYMENT BENEFIT OBLIGATIONS<br />
(in € millions) France Other countries Total<br />
PROJECTED BENEFIT OBLIGATION AT 1 JANUARY <strong>2010</strong> 68.7 76.7 145.4<br />
Service cost 4.2 1.5 5.7<br />
Interest cost 3.5 3.5 7.0<br />
Benefits paid (4.5) (5.1) (9.6)<br />
Plan amendments 2.2 0.1 2.3<br />
Changes in assumptions 8.9 6.3 15.2<br />
Curtailments/settlements<br />
Actuarial gains <strong>and</strong> losses <strong>and</strong> other (0.4) 4.8 4.4<br />
PROJECTED BENEFIT OBLIGATION AT 31 DECEMBER <strong>2010</strong> 82.6 87.8 170.4<br />
2009 PENSION AND OTHER POST-EMPLOYMENT BENEFIT OBLIGATIONS<br />
(in € millions) France Other countries Total<br />
PROJECTED BENEFIT OBLIGATION AT 1 JANUARY 2009 67.7 71.4 139.1<br />
Service cost 3.6 1.4 5.0<br />
Interest cost 3.6 3.6 7.2<br />
Benefits paid (10.0) (4.7) (14.7)<br />
Plan amendments 0.5 0.1 0.6<br />
Changes in assumptions 4.8 4.6 9.4<br />
Curtailments/settlements (0.2) (0.2)<br />
Actuarial gains <strong>and</strong> losses <strong>and</strong> other (1.5) 0.5 (1.0)<br />
PROJECTED BENEFIT OBLIGATION AT 31 DECEMBER 2009 68.7 76.7 145.4<br />
2008 PENSION AND OTHER POST-EMPLOYMENT BENEFIT OBLIGATIONS<br />
(in € millions) France Other countries Total<br />
PROJECTED BENEFIT OBLIGATION AT 1 JANUARY 2008 66.8 73.2 140.0<br />
Service cost 3.7 1.6 5.3<br />
Interest cost 3.2 3.9 7.1<br />
Benefits paid (6.4) (5.3) (11.7)<br />
Plan amendments<br />
Changes in assumptions (2.3) (2.3)<br />
Curtailments/settlements<br />
Actuarial gains <strong>and</strong> losses <strong>and</strong> other 2.7 (2.0) 0.7<br />
PROJECTED BENEFIT OBLIGATION AT 31 DECEMBER 2008 67.7 71.4 139.1<br />
98 FINANCIAL REPORT AND REGISTRATION DOCUMENT <strong>2010</strong> GROUPE SEB
3<br />
CONSOLIDATED FINANCIAL STATEMENTS<br />
NOTES TO THE CONSOLIDATED FINANCIAL STATEMENTS<br />
22.6. ANALYSIS OF PLAN ASSETS<br />
CHANGE IN PLAN ASSETS IN <strong>2010</strong><br />
(in € millions) France Other countries Total<br />
PLAN ASSETS AT 1 JANUARY <strong>2010</strong> 26.2 13.1 39.3<br />
Expected return on plan assets 3.1 0.5 3.6<br />
Contributions paid 3.5 1.3 4.8<br />
Benefits paid (0.3) (0.3)<br />
Actuarial gains <strong>and</strong> losses <strong>and</strong> other 1.7 1.7<br />
PLAN ASSETS AT 31 DECEMBER <strong>2010</strong> 32.8 16.3 49.1<br />
CHANGE IN PLAN ASSETS IN 2009<br />
(in € millions) France Other countries Total<br />
PLAN ASSETS AT 1 JANUARY 2009 24.4 11.4 35.8<br />
Expected return on plan assets 3.3 0.6 3.9<br />
Contributions paid 4.0 1.4 5.4<br />
Benefits paid (5.5) (0.3) (5.8)<br />
Actuarial gains <strong>and</strong> losses <strong>and</strong> other<br />
PLAN ASSETS AT 31 DECEMBER 2009 26.2 13.1 39.3<br />
CHANGE IN PLAN ASSETS IN 2008<br />
(in € millions) France Other countries Total<br />
PLAN ASSETS AT 1 JANUARY 2008 27.3 12.6 39.9<br />
Expected return on plan assets (4.7) 0.5 (4.2)<br />
Contributions paid 6.2 1.6 7.8<br />
Benefits paid (4.4) (0.3) (4.7)<br />
Actuarial gains <strong>and</strong> losses <strong>and</strong> other (3.0) (3.0)<br />
PLAN ASSETS AT 31 DECEMBER 2008 24.4 11.4 35.8<br />
3<br />
Plan assets in France are managed by an insurance company <strong>and</strong> are<br />
invested as follows:<br />
approximately 15% in the general assets of the insurance company,<br />
primarily composed of government bonds, corporate bonds mostly rated<br />
AAA or AA, shares in international blue-chip companies (managed directly)<br />
<strong>and</strong> high-yield office property;<br />
approximately 50% in corporate bond funds;<br />
the balance in equity funds.<br />
The actual return on plan assets for <strong>2010</strong> should be in line with the expected<br />
rate of 4%. Actuarial gains <strong>and</strong> losses generated in 2011 are not expected<br />
to be material.<br />
Plan assets in other countries primarily comprise funds invested with an<br />
insurer amounting to €11.6 million, relating to the obligations of <strong>Groupe</strong><br />
SEB Nederl<strong>and</strong>.<br />
22.7. EARLY RETIREMENT SCHEMES<br />
As part of the employee support measures implemented in connection with<br />
the industrial reorganisation carried out in France (see Note 6), in mid-2006<br />
<strong>Groupe</strong> SEB offered eligible employees the possibility of early retirement.<br />
The programme was in addition to the early retirement scheme for workers<br />
exposed to asbestos at the Fresnay site, which formed part of the assets<br />
acquired from Moulinex S.A. in 2001. A total of 149 employees benefited<br />
from the “asbestos scheme” as of 31 December <strong>2010</strong>.<br />
A provision was recorded at 31 December 2006 to cover the Group’s<br />
obligations under the programme, discounted at a rate of 3.75% as the<br />
amounts will be paid out in the medium term. At 31 December <strong>2010</strong>, the<br />
provision amounted to €9.6 million, versus €11.1 million at 31 December<br />
2009 <strong>and</strong> €14.5 million at 31 December 2008 (see Note 21.3).<br />
GROUPE SEB<br />
FINANCIAL REPORT AND REGISTRATION DOCUMENT <strong>2010</strong><br />
99
3 NOTES<br />
CONSOLIDATED FINANCIAL STATEMENTS<br />
TO THE CONSOLIDATED FINANCIAL STATEMENTS<br />
NOTE 23<br />
TRADE AND OTHER PAYABLES<br />
(in € millions) <strong>2010</strong> 2009 2008<br />
TRADE PAYABLES 494.4 398.0 366.3<br />
Accrued taxes <strong>and</strong> employee benefits expense 247.9 198.9 177.8<br />
Due to suppliers of fixed assets 12.5 8.8 10.5<br />
Other payables 14.1 11.7 6.8<br />
OTHER PAYABLES 274.5 219.4 195.1<br />
At 31 December <strong>2010</strong>, trade <strong>and</strong> other payables broke down as follows:<br />
Current Non-current Total<br />
TRADE PAYABLES 494.4 494.4<br />
Accrued taxes <strong>and</strong> employee benefits expense 225.0 22.9 247.9<br />
Due to suppliers of fixed assets 12.5 12.5<br />
Other payables 13.3 0.8 14.1<br />
OTHER PAYABLES 250.8 23.7 274.5<br />
Non-current accrued taxes <strong>and</strong> employee benefits expense correspond mainly to employee time savings accounts in France.<br />
NOTE 24<br />
BORROWINGS<br />
24.1. TOTAL BORROWINGS<br />
(in € millions) <strong>2010</strong> 2009 2008<br />
Bank borrowings 171.0 274.6 193.0<br />
Finance lease liabilities 1.6 1.7 2.0<br />
Other debt 1.9 2.3 1.9<br />
Non-discretionary profit sharing liability 25.4 22.5 16.6<br />
LONG-TERM BORROWINGS 199.9 301.1 213.5<br />
Bank borrowings 53.8 113.3 246.0<br />
Commercial paper 100.0 100.0 394.0<br />
Current portion of long-term borrowings 18.2 33.4 21.5<br />
SHORT-TERM BORROWINGS 172.0 246.7 661.5<br />
TOTAL BORROWINGS 371.9 547.8 875.0<br />
At 31 December <strong>2010</strong>, the Group’s borrowings were comprised of short-term<br />
<strong>and</strong> long-term borrowings.<br />
Bank borrowings consist of:<br />
a €20 million credit line set up in France, of which €10 million due beyond<br />
one year;<br />
a Schuldschein loan for €113.5 million due in 2013;<br />
a Schuldschein loan for €47.5 million due in 2015.<br />
At 31 December <strong>2010</strong>, the weighted average interest rate on long-term<br />
borrowings denominated in euros was 4.38%, compared with 3.4% at<br />
31 December 2009.<br />
A traditional source of financing for the Group is its €600 million commercial<br />
paper programme, which has an A2 rating from St<strong>and</strong>ard & Poor’s.<br />
Outst<strong>and</strong>ing commercial paper under this programme totalled €100 million<br />
at the year-end.<br />
100 FINANCIAL REPORT AND REGISTRATION DOCUMENT <strong>2010</strong> GROUPE SEB
3<br />
CONSOLIDATED FINANCIAL STATEMENTS<br />
NOTES TO THE CONSOLIDATED FINANCIAL STATEMENTS<br />
CHARACTERISTICS OF BORROWINGS (NOMINAL AMOUNTS)<br />
At 31 December <strong>2010</strong><br />
(in € millions)<br />
Issuing<br />
currency<br />
Due Outst<strong>and</strong>ing<br />
balance<br />
in less than<br />
1 year<br />
Due<br />
in 1 to 5<br />
years<br />
in more<br />
than 5 years<br />
Original interest<br />
rate<br />
Rate after hedging<br />
French loan EUR 2012 20.0 10.0 10.0 Floating Euribor Fixed<br />
Schuldschein loan EUR 2013 55.0 55.0 Fixed<br />
Schuldschein loan EUR 2013 58.5 58.5 Floating Euribor<br />
Schuldschein loan EUR 2015 30.0 30.0 Fixed<br />
Schuldschein loan EUR 2015 17.5 17.5 Floating Euribor<br />
Commercial paper EUR 2011 100.0 100.0 Floating Eonia Floating (a)<br />
Other bank borrowings, incl.<br />
overdrafts - 59.6 57.7 1.9 Floating<br />
Finance lease liabilities - - 2.7 1.1 1.6<br />
Non-discretionary profit<br />
sharing liability EUR - 28.6 3.2 25.4<br />
TOTAL 371.9 172.0 199.9<br />
(a) A portion of issued commercial paper is hedged by floating-rate cross-currency swaps in order to cover subsidiaries’ financing needs in their functional currency. Consequently,<br />
interest rates on this financing are those applicable to borrowings in the main currencies concerned, i.e. US dollars, pounds sterling <strong>and</strong> Mexican pesos (see Note 26.2).<br />
All commercial paper is due in less than three months.<br />
LOAN MATURITIES (UNDISCOUNTED NOMINAL AMOUNTS, INCLUDING ACCRUED INTEREST)<br />
At 31 December <strong>2010</strong><br />
(in € millions) Issuing currency Due<br />
Scheduled<br />
repayments<br />
in less than 1 year in 1 to 5 years<br />
French loan EUR 2012 20.4 10.3 10.1<br />
Schuldschein loan EUR 2013 65.1 3.4 61.7<br />
Schuldschein loan EUR 2013 62.2 1.3 60.9<br />
Schuldschein loan EUR 2015 39.5 1.9 37.6<br />
Schuldschein loan EUR 2015 19.7 0.5 19.2<br />
TOTAL 206.9 17.4 189.5<br />
Due<br />
in more than<br />
5 years<br />
3<br />
CONFIRMED CREDIT FACILITIES<br />
The Group also has unused, confirmed credit facilities that break down as follows by maturity:<br />
Confirmed credit<br />
At 31 December <strong>2010</strong> (in € millions)<br />
facilities <strong>2010</strong>*<br />
2011 777<br />
2012 694<br />
2013 557<br />
2014 71<br />
2015 48<br />
* Unused confirmed lines of credit at 31 December <strong>2010</strong>, of which:<br />
• a syndicated credit facility for €456.1 million, expiring in June 2011;<br />
• a bank line of credit set up in 2007 for €30 million, expiring in December 2011.<br />
The syndicated credit facility includes an option to extend the expiry date by two years until 2013.<br />
None of these credit lines include any acceleration clauses.<br />
GROUPE SEB<br />
FINANCIAL REPORT AND REGISTRATION DOCUMENT <strong>2010</strong><br />
101
3 NOTES<br />
CONSOLIDATED FINANCIAL STATEMENTS<br />
TO THE CONSOLIDATED FINANCIAL STATEMENTS<br />
24.2. NET DEBT<br />
(in € millions) <strong>2010</strong> 2009 2008<br />
Long-term borrowings 199.9 301.1 213.5<br />
Short-term borrowings 172.0 246.7 661.4<br />
TOTAL BORROWINGS 371.9 547.8 874.9<br />
Cash <strong>and</strong> cash equivalents, net (236.6) (307.8) (224.6)<br />
Derivative instruments, net (4.2) 3.4 (1.3)<br />
NET DEBT 131.1 243.4 649.0<br />
Net debt corresponds to total long <strong>and</strong> short-term borrowings less cash<br />
<strong>and</strong> cash equivalents <strong>and</strong> derivative instruments used for Group financing<br />
purposes that are readily convertible into cash.<br />
At 31 December <strong>2010</strong>, no borrowings were subject to acceleration clauses.<br />
Only two medium-long-term loans in France were subject to debt covenants<br />
that could have an impact on the interest rate of the debt. Interest paid in <strong>2010</strong><br />
was determined in the highest tranche provided for in the loan agreement.<br />
Shifting to a different tranche would enable the Group to reduce its interest<br />
payments. The amount of the saving would be less than €0.1 million.<br />
NOTE 25<br />
FAIR VALUE OF FINANCIAL INSTRUMENTS<br />
25.1. FINANCIAL INSTRUMENTS<br />
<strong>2010</strong> <strong>Financial</strong> instruments by category<br />
At fair value<br />
through<br />
Carrying<br />
profit (excl. Available Loans <strong>and</strong><br />
(in € millions)<br />
amount Fair value derivatives) for sale receivables<br />
ASSETS<br />
Investments in non-consolidated companies 0.5 0.5 0.5<br />
Other non-current financial assets 7.9 7.9 7.9<br />
Other non-current assets 4.2 4.2 4.2<br />
Trade receivables 733.9 733.9 733.9<br />
Other current receivables, excl. prepaid<br />
expenses 48.2 48.2 48.2<br />
Held to<br />
maturity<br />
Derivative<br />
instruments<br />
Derivative instruments 16.6 16.6 16.6<br />
Cash <strong>and</strong> cash equivalents 236.6 236.6 236.6<br />
TOTAL FINANCIAL ASSETS 1,047.9 1,047.9 236.6 0.5 794.2 16.6<br />
LIABILITIES<br />
Long-term borrowings 199.9 212.7 212.7<br />
Other non-current liabilities 23.7 23.7 23.7<br />
Trade payables 494.4 494.4 494.4<br />
Other current liabilities 250.8 250.8 250.8<br />
Derivative instruments 6.1 6.1 6.1<br />
Short-term borrowings 172.0 172.0 172.0<br />
TOTAL FINANCIAL LIABILITIES 1,146.9 1,159.7 1,153.6 6.1<br />
102 FINANCIAL REPORT AND REGISTRATION DOCUMENT <strong>2010</strong> GROUPE SEB
3<br />
CONSOLIDATED FINANCIAL STATEMENTS<br />
NOTES TO THE CONSOLIDATED FINANCIAL STATEMENTS<br />
(in € millions)<br />
ASSETS<br />
Carrying<br />
amount<br />
2009 <strong>Financial</strong> instruments by category<br />
Fair value<br />
At fair value<br />
through<br />
profit (excl.<br />
derivatives)<br />
Available for<br />
sale<br />
Loans <strong>and</strong><br />
receivables<br />
Held to<br />
maturity<br />
Derivative<br />
instruments<br />
Investments in non-consolidated companies 0.5 0.5 0.5<br />
Other non-current financial assets 7.3 7.3 7.3<br />
Other non-current assets 5.0 5.0 5.0<br />
Trade receivables 627.1 627.1 627.1<br />
Other current receivables,<br />
excl. prepaid expenses 44.3 44.3 44.3<br />
Derivative instruments 5.2 5.2 5.2<br />
Cash <strong>and</strong> cash equivalents 307.8 307.8 307.8<br />
TOTAL FINANCIAL ASSETS 997.2 997.2 307.8 0.5 683.7 5.2<br />
LIABILITIES<br />
Long-term borrowings 301.1 312.1 312.1<br />
Other non-current liabilities 23.7 23.7 23.7<br />
Trade payables 398.0 398.0 398.0<br />
Other current liabilities 195.7 195.7 195.7<br />
Derivative instruments 13.8 13.8 13.8<br />
Short-term borrowings 246.7 246.7 246.7<br />
TOTAL FINANCIAL LIABILITIES 1,179.0 1,190.0 1,176.2 13.8<br />
2008 <strong>Financial</strong> instruments by category<br />
At fair value<br />
through<br />
Carrying<br />
profit (excl. Available for Loans <strong>and</strong><br />
(in € millions)<br />
amount Fair value derivatives)<br />
sale receivables<br />
ASSETS<br />
Investments in non-consolidated companies 0.7 0.7 0.7<br />
Other non-current financial assets 9.9 9.9 9.9<br />
Other non-current assets 3.2 3.2 3.2<br />
Trade receivables 645.6 645.6 645.6<br />
Other current receivables,<br />
excl. prepaid expenses 46.0 46.0 46.0<br />
Held to<br />
maturity<br />
Derivative<br />
instruments<br />
Derivative instruments 12.0 12.0 12.0<br />
Cash <strong>and</strong> cash equivalents 224.6 224.6 224.6<br />
TOTAL FINANCIAL ASSETS 942.0 942.0 224.6 0.7 704.7 12.0<br />
LIABILITIES<br />
Long-term borrowings 213.5 213.5 213.5<br />
Other non-current liabilities 36.4 36.4 36.4<br />
Trade payables 366.3 366.3 366.3<br />
Other current liabilities 158.8 158.8 158.8<br />
Derivative instruments 51.2 51.2 51.2<br />
Short-term borrowings 661.5 660.6 660.6<br />
3<br />
TOTAL FINANCIAL LIABILITIES 1,487.7 1,486.8 1,435.6 51.2<br />
The fair value of trade <strong>and</strong> other receivables (classified as held-to-maturity<br />
investments) is equivalent to their carrying amount, in view of their short<br />
maturities.<br />
Non-current financial assets consist mainly of investments in non-consolidated<br />
companies, certain receivables related to those investments <strong>and</strong> operating<br />
receivables due beyond one year.<br />
<strong>Financial</strong> assets that are not quoted in an active market are recognised in the<br />
balance sheet at cost, which is representative of their fair value.<br />
Borrowings that are not quoted in an active market are measured by the<br />
discounted cash flows method, applied separately to each individual facility,<br />
based on market rates observed at the period-end for similar facilities <strong>and</strong><br />
the average spread obtained by the Group for its own issues.<br />
Other fi nancial liabilities consist mainly of accrued taxes <strong>and</strong> employee<br />
benefits expense, which are due within one year.<br />
GROUPE SEB<br />
FINANCIAL REPORT AND REGISTRATION DOCUMENT <strong>2010</strong><br />
103
3 NOTES<br />
CONSOLIDATED FINANCIAL STATEMENTS<br />
TO THE CONSOLIDATED FINANCIAL STATEMENTS<br />
25.2. DERIVATIVE INSTRUMENTS<br />
The fair value of derivative instruments is as follows:<br />
(in € millions)<br />
Nominal<br />
amount<br />
<strong>2010</strong> 2009<br />
Assets Liabilities Assets Liabilities<br />
Fair value<br />
Nominal<br />
amount<br />
Fair value<br />
Nominal<br />
amount<br />
Fair value<br />
FAIR VALUE HEDGES 20.5 0.7<br />
Nominal<br />
amount<br />
Fair value<br />
Forward sales of foreign currencies 38.9 1.3 14.9 (0.3) 77.4 1.3 51.9 (1.5)<br />
Forward purchases of foreign currencies 3.5 0.4 44.6 (1.3)<br />
TOTAL 1.7 (1.6) 2.0 (1.5)<br />
SUPERHEDGES AND TRADING TRANSACTIONS<br />
Currency swaps <strong>and</strong> other hedges<br />
EUR 5.5 (0.1) 6.8 (0.2)<br />
GBP 20.0 0.2 4.9 (0.1) 9.0 (0.1)<br />
HUF 44.2 0.8<br />
MXN 22.0 0.5 6.7 0.1 3.0 (0.1)<br />
RUB 21.5 0.6<br />
USD 244.3 4.9 63.0 (0.4) 13.0 2.5 254.2 (3.2)<br />
Other currencies 17.1 1.0<br />
TOTAL 8.0 (0.6) 2.6 (3.6)<br />
CASH FLOW HEDGES<br />
Forward purchases <strong>and</strong> sales of foreign currencies 57.4 2.8 18.9 (0.7)<br />
Floating/fixed rate swaps 60.0 (0.3)<br />
Aluminium derivatives 26.6 3.1 21.6 (2.9) 58.1 (8.5)<br />
Nickel derivatives 4.3 1.0 3.6 0.6 0.5 (0.1)<br />
Copper derivatives 2.8 (0.1)<br />
TOTAL 6.9 (3.9) 0.6 (8.7)<br />
TOTAL DERIVATIVE INSTRUMENTS 16.6 (6.1) 5.2 (13.8)<br />
NET IMPACT ON EQUITY<br />
(INCLUDING FAIR VALUE ADJUSTMENTS<br />
RECOGNISED IN PROFIT) 10.5 (8.6)<br />
The only derivatives with maturities beyond one year are cash flow hedges. The non-current portion of the fair value of these hedges is as follows:<br />
At 31 December <strong>2010</strong><br />
Expiring in less than<br />
1 year Expiring in 1 to 5 years<br />
Expiring in more than<br />
5 years Total<br />
Floating/fixed rate swaps (0.3) (0.3)<br />
Aluminium derivatives (0.4) 0.6 0.2<br />
Nickel derivatives 0.9 0.1 1.0<br />
Copper derivatives<br />
TOTAL 0.5 0.4 0.9<br />
The fair value of derivative instruments is determined by the discounted cash flows method using forward exchange rates, market interest rates <strong>and</strong> aluminium<br />
prices at 31 December <strong>2010</strong>.<br />
104 FINANCIAL REPORT AND REGISTRATION DOCUMENT <strong>2010</strong> GROUPE SEB
3<br />
CONSOLIDATED FINANCIAL STATEMENTS<br />
NOTES TO THE CONSOLIDATED FINANCIAL STATEMENTS<br />
25.3. INFORMATION ON ASSETS AND FINANCIAL LIABILITIES MEASURED AT FAIR VALUE<br />
In accordance with the amended IFRS 7, fair value measurements are<br />
classifi ed using a fair value hierarchy that refl ects the signifi cance of the<br />
inputs used in making the measurements. The hierarchy breaks down into<br />
three levels, as follows:<br />
level 1: quoted prices in active markets for the same instrument;<br />
level 2: quoted prices in active markets for similar assets or liabilities or<br />
other valuation techniques for which all significant inputs are based on<br />
observable market data;<br />
level 3: valuation techniques for which any significant input is not based<br />
on observable market data.<br />
31 December <strong>2010</strong><br />
(in € millions)<br />
Total Level 1 Level 2 Level 3<br />
ASSETS<br />
Derivative instruments 16.5 16.5<br />
Cash <strong>and</strong> cash equivalents 236.6 236.6<br />
TOTAL FINANCIAL ASSETS MEASURED<br />
AT FAIR VALUE 253.1 236.6 16.5 0.0<br />
LIABILITIES<br />
Derivative instruments 6.0 6.0<br />
TOTAL FINANCIAL LIABILITIES MEASURED<br />
AT FAIR VALUE 6.0 0.0 6.0 0.0<br />
The portfolio of derivatives used by the Group to manage risk mainly<br />
includes forward currency contracts, interest rate <strong>and</strong> currency swaps <strong>and</strong><br />
commodities options. These instruments are classified as Level 2, as their fair<br />
value is calculated using internal valuation models based on observable data.<br />
NOTE 26<br />
MARKET RISK MANAGEMENT<br />
3<br />
26.1. RISK MANAGEMENT<br />
Risks are managed by Corporate Finance, based on financial market<br />
conditions <strong>and</strong> in accordance with procedures established by the Group.<br />
Hedging transactions are carried out in the financial markets with a<br />
limited number of high-quality partners in order to avoid counterparty risk.<br />
Subsidiaries’ risks are hedged at corporate level when this is allowed under<br />
the laws <strong>and</strong> regulations of the country concerned <strong>and</strong> when the hedges<br />
can be arranged on the financial markets.<br />
Subsidiaries that are prevented from hedging financial risks through<br />
Corporate Finance due to local laws <strong>and</strong> regulations enter into hedging<br />
transactions directly with local banks in compliance with Group procedures<br />
<strong>and</strong> policies.<br />
26.2. MARKET RISKS<br />
26.2.1. Currency risks<br />
The majority of Group sales are billed in currencies other than the euro,<br />
mainly the US dollar, Russian ruble, Brazilian real <strong>and</strong> Japanese yen.<br />
Most billing currencies correspond to the functional currencies of the<br />
subsidiaries concerned <strong>and</strong> do not give rise to any transactional currency<br />
risk at the local level.<br />
Similarly, goods purchased for resale billed in US dollars are bought from<br />
Asian suppliers by SEB Asia whose functional currency is also the US dollar.<br />
The main sources of transactional currency risks therefore arise from:<br />
intra-group billings between two Group companies with different functional<br />
currencies, as follows:<br />
exports by manufacturing subsidiaries in the euro zone billed in the<br />
local currency of the marketing subsidiaries,<br />
imports of goods from SEB Asia billed in US dollars by marketing<br />
subsidiaries whose functional currency is not the US dollar;<br />
purchases of industrial components from external suppliers by the<br />
manufacturing subsidiaries, that are billed in a currency other than their<br />
functional currency (for example, components purchases by French<br />
subsidiaries that are billed in US dollars).<br />
These risks are managed at Group level by SEB S.A., which acts as the<br />
subsidiaries’ sole counterparty except where this is not possible due to<br />
local regulations. The resulting balance sheet currency positions in the main<br />
currencies are partly hedged by means of forward sales <strong>and</strong> purchases of<br />
foreign currency against the euro. Part of SEB Asia’s US dollar billings to<br />
subsidiaries is hedged. In <strong>2010</strong>, 2009 <strong>and</strong> 2008 the Group was a net buyer<br />
of US dollars.<br />
The Group’s overall currency risk management policy sets very strict rules<br />
for the hedging of currency risks associated with highly probable future<br />
transactions.<br />
GROUPE SEB<br />
FINANCIAL REPORT AND REGISTRATION DOCUMENT <strong>2010</strong><br />
105
3 NOTES<br />
CONSOLIDATED FINANCIAL STATEMENTS<br />
TO THE CONSOLIDATED FINANCIAL STATEMENTS<br />
ANALYSIS OF CURRENCY RISKS ON INTER-COMPANY TRANSACTIONS<br />
The Group’s net exposure to transactional currency risks primarily concerns the following currencies (excluding the functional currencies of Group companies):<br />
At 31 December <strong>2010</strong> (in € millions) USD HUF JPY RUB Other<br />
Total assets 24 8 22 38<br />
Total liabilities (63)<br />
Future transactions<br />
NET POSITION BEFORE HEDGING (63) 24 8 22 38<br />
Forward purchases of foreign currencies 111<br />
Forward sales of foreign currencies (20) (27) (9) (28)<br />
NET POSITION AFTER HEDGING 48 4 (19) 13 10<br />
At 31 December 2009 (in € millions) USD GBP HUF JPY Other<br />
Total assets 4 20 6 38<br />
Total liabilities (48)<br />
Future transactions 64<br />
NET POSITION BEFORE HEDGING (48) 4 20 70 38<br />
Forward purchases of foreign currencies 20<br />
Forward sales of foreign currencies (4) (15) (69) (32)<br />
NET POSITION AFTER HEDGING (28) 0 5 1 6<br />
At 31 December 2008 (in € millions) USD GBP HUF JPY Other<br />
Total assets 5 14 15 51<br />
Total liabilities (34) (1)<br />
Future transactions (29) 4 2 0 6<br />
NET POSITION BEFORE HEDGING (63) 9 16 15 56<br />
Forward purchases of foreign currencies 53<br />
Forward sales of foreign currencies (8) (15) 0 (12)<br />
NET POSITION AFTER HEDGING (10) 1 1 15 44<br />
At 31 December <strong>2010</strong>, the euro was trading at USD 1.336, GBP 0.861, HUF<br />
277.95 <strong>and</strong> JPY 108.65.<br />
The appreciation of these currencies, assuming all other variables remained<br />
the same, would have a positive impact on profit, except for the Japanese<br />
yen, whose appreciation would result in an expense.<br />
At 31 December <strong>2010</strong>, the sensitivity analysis of the net position after hedging was as follows:<br />
(in € millions) USD HUF JPY RUB Other<br />
Hypothetical currency appreciation 1% 1% 1% 1% 1%<br />
IMPACT ON PROFIT 0.5 0.0 (0.2) 0.1 0.1<br />
CURRENCY RISKS ON FINANCING<br />
SEB S.A. is the main provider of fi nancing for its subsidiaries. Current<br />
account advances are made in the subsidiaries’ functional currency. As<br />
SEB S.A. raises long-term financing in euros, it is exposed to currency risks<br />
on these advances. To hedge these risks, the Company borrows or lends<br />
funds in the subsidiary’s currency, according to whether the current account<br />
balance is a debit or a credit, or uses currency swaps to refinance its debt<br />
in the subsidiary’s local currency. Currency risks on financing are therefore<br />
systematically hedged.<br />
106 FINANCIAL REPORT AND REGISTRATION DOCUMENT <strong>2010</strong> GROUPE SEB
3<br />
CONSOLIDATED FINANCIAL STATEMENTS<br />
NOTES TO THE CONSOLIDATED FINANCIAL STATEMENTS<br />
The Group does not however apply hedge accounting to these transactions.<br />
At 31 December <strong>2010</strong> (in € millions) USD Other<br />
Total assets 265 84<br />
Total liabilities 30 14<br />
NET POSITION BEFORE HEDGING 235 70<br />
Hedging positions (225) (37)<br />
NET POSITION AFTER HEDGING 10 33<br />
At 31 December 2009 (in € millions) USD GBP Other<br />
Total assets 290 8 25<br />
Total liabilities 62 8<br />
NET POSITION BEFORE HEDGING 228 8 17<br />
Hedging positions (267) (9) (17)<br />
NET POSITION AFTER HEDGING (39) (1) 0<br />
At 31 December 2008 (in € millions) USD GBP Other<br />
Total assets 340 15 53<br />
Total liabilities 138 2<br />
NET POSITION BEFORE HEDGING 202 15 51<br />
Hedging positions (209) (15) (12)<br />
NET POSITION AFTER HEDGING (7) 0 39<br />
The appreciation or depreciation of these currencies, assuming all other variables remained the same, would have an impact on profit.<br />
At 31 December <strong>2010</strong>, the sensitivity analysis of the net position after hedging was as follows:<br />
(in € millions) USD Other<br />
Hypothetical currency appreciation 1% 1%<br />
3<br />
IMPACT ON PROFIT 0.1 0.3<br />
CURRENCY RISKS ON NET INVESTMENTS IN FOREIGN OPERATIONS<br />
<strong>Groupe</strong> SEB is also exposed to currency risks on its net investment in foreign<br />
operations, corresponding to the impact of changes in exchange rates for<br />
the subsidiaries’ functional currencies on SEB S.A.’s share in their net assets.<br />
These risks are not hedged.<br />
26.2.2 Interest rate risks<br />
Group policy consists of hedging interest rate risks based on trends in market interest rates <strong>and</strong> changes in the Group’s overall debt structure. These risks<br />
are not hedged systematically.<br />
The following table analyses financial assets <strong>and</strong> liabilities at 31 December <strong>2010</strong>, based on interest rate re-set dates:<br />
Overnight to 1 year 1 to 5 years More than 5 years<br />
At 31 December <strong>2010</strong> (in € millions)<br />
Floating rate Fixed rate Fixed rate Fixed rate<br />
Total assets 236.6<br />
Total liabilities (266.9) (10.0) (95.0)<br />
NET POSITION AFTER HEDGING (30.3) (10.0) (95.0)<br />
Interest payable between January 2007 <strong>and</strong> March 2012 is hedged by a floating/fixed rate swap. This swap qualifies for hedge accounting under IAS 39.<br />
At 31 December <strong>2010</strong><br />
(in € millions) Expiring within one year <strong>2010</strong> Expiring in 1 to 5 years Expiring beyond 5 years<br />
Floating/fixed rate swap 10 10 0<br />
GROUPE SEB<br />
FINANCIAL REPORT AND REGISTRATION DOCUMENT <strong>2010</strong><br />
107
3 NOTES<br />
CONSOLIDATED FINANCIAL STATEMENTS<br />
TO THE CONSOLIDATED FINANCIAL STATEMENTS<br />
Based on gross debt at 31 December <strong>2010</strong>, assuming debt remains constant<br />
throughout the year <strong>and</strong> is denominated in the same currencies as at<br />
that date, a 1-point increase in interest rates would lead to an estimated<br />
€2.5 million increase in interest expense <strong>and</strong> would have no material impact<br />
on net debt.<br />
The impact of the interest rate swap on equity at 31 December <strong>2010</strong> would<br />
be as follows:<br />
(in € millions) <strong>2010</strong><br />
FAIR VALUE AT 1 JANUARY (0.6)<br />
Change in fair value 0.3<br />
Amount reclassified into profit (0.1)<br />
FAIR VALUE AT 31 DECEMBER (0.3)<br />
The ineffective portion recognised in profit is not material.<br />
26.2.3. Commodity risks<br />
Commodity risks arising from changes in the prices of certain raw materials<br />
used by the Group – mainly aluminium, copper <strong>and</strong> nickel used to produce<br />
stainless steel – are hedged by derivative instruments. The Group anticipates<br />
its needs for the coming year <strong>and</strong> hedges them on a conservative basis,<br />
covering 70% of its estimated purchases for the next twelve months.<br />
At 31 December <strong>2010</strong>, 22,967 tonnes of aluminium purchases, 300 tonnes<br />
of nickel purchases <strong>and</strong> 110 tonnes of copper purchases were hedged.<br />
Prices are fixed in advance using zero-premium collars, swaps <strong>and</strong> average<br />
monthly price options.<br />
These hedges of raw material purchases are qualified as cash flow hedges<br />
under IAS 39 when the criteria listed in Note 1.4.4 are met.<br />
At 31 December <strong>2010</strong>, remeasurement of commodity hedges at fair value led<br />
to the recognition in equity of an unrealised gain of €1.2 million. At year-end<br />
2009 <strong>and</strong> 2008, unrealised losses amounted to €8.1 million <strong>and</strong> €44.9 million<br />
respectively.<br />
Derivatives that expired in <strong>2010</strong> led to a loss of €3.8 million versus a<br />
€20.4 million loss in 2009. Gains on hedged metal purchases amounted to<br />
€15.5 million compared with a gain of €14.1 million in 2009.<br />
SENSITIVITY ANALYSIS<br />
A 10% increase or decrease in metal prices at 31 December <strong>2010</strong> would<br />
have had a €4.9 million positive or negative impact on equity, assuming all<br />
other variables remained constant.<br />
A 10% increase or decrease in metal prices versus their average prices in<br />
<strong>2010</strong> would have had a €9.2 million positive or negative impact on operating<br />
margin.<br />
26.2.4. Equity risk <strong>and</strong> treasury stock<br />
The Group does, however, hold a portfolio of SEB shares, purchased in<br />
connection with:<br />
a liquidity contract set up in order to ensure that there is a sufficiently liquid<br />
market for SEB shares <strong>and</strong> to stabilise the share price; <strong>and</strong><br />
the share buyback programme, mainly for allocation on exercise of<br />
employee stock options.<br />
Treasury stock is deducted directly from equity. Profits <strong>and</strong> losses from sales<br />
of treasury stock are also recognised in equity.<br />
Based on the closing share price on 31 December <strong>2010</strong> (€77.73), the fair<br />
value of shares held in treasury at that date stood at €154 million. A 10%<br />
increase or decrease in the share price would therefore have led to a<br />
€15.4 million change in the fair value of treasury stock.<br />
ZJ Supor, which is 51.31%-owned by <strong>Groupe</strong> SEB, is listed on the Shenzen<br />
stock exchange. At 31 December <strong>2010</strong>, ZJ Supor’s share price was<br />
RMB 23.9, valuing <strong>Groupe</strong> SEB’s investment at €802.4 million. The change in<br />
the Supor share price had no impact on <strong>Groupe</strong> SEB’s consolidated financial<br />
statements, as ZJ Supor is fully consolidated. Similarly, the change in the<br />
share price had no impact on the Company accounts of SEB Internationale<br />
because its interest in ZJ Supor is classified as a long-term investment <strong>and</strong><br />
is not marked to market.<br />
26.3. LIQUIDITY RISK<br />
To manage the liquidity risk that may arise due to financial liabilities reaching<br />
maturity or needing to be settled early, the Group implements a financing<br />
strategy based on:<br />
maintaining cash <strong>and</strong> cash equivalents at a certain level at all<br />
times (€236.6 million at 31 December <strong>2010</strong>);<br />
a €600 million commercial paper programme, with €100 million outst<strong>and</strong>ing<br />
at 31 December <strong>2010</strong>;<br />
other debt facilities, including:<br />
€20 million in medium-term loans, repayable in annual instalments until 2012,<br />
a €456.1 million syndicated credit facility expiring in 2011, which had<br />
not been drawn down at 31 December <strong>2010</strong>,<br />
a €30 million bank line of credit expiring in 2011, that had not been<br />
drawn down at 31 December <strong>2010</strong>,<br />
a Schuldschein loan, repayable in two instalments in 2013 <strong>and</strong> 2015<br />
for €113.5 million <strong>and</strong> €47.5 million, respectively.<br />
Cash <strong>and</strong> cash equivalents <strong>and</strong> debt are discussed in Note 18 <strong>and</strong> Note 24,<br />
respectively.<br />
With currency swaps, the notional amounts are exchanged at maturity, while<br />
with interest rate swaps, only the interest differential is paid or received.<br />
It is not Group policy to hold significant portfolios of equities or equity funds.<br />
108 FINANCIAL REPORT AND REGISTRATION DOCUMENT <strong>2010</strong> GROUPE SEB
3<br />
CONSOLIDATED FINANCIAL STATEMENTS<br />
NOTES TO THE CONSOLIDATED FINANCIAL STATEMENTS<br />
26.4. CREDIT RISK<br />
At 31 December <strong>2010</strong>, trade receivables broke down as follows based on their age:<br />
(in € millions)<br />
Current<br />
0-90 days<br />
Past due<br />
91-180 days Over 181 days<br />
Total<br />
Net trade receivables 581.4 148.6 1.8 2.1 733.9<br />
To avoid default risks, <strong>Groupe</strong> SEB sets individual credit limits that<br />
are regularly updated based on the customer’s financial position <strong>and</strong><br />
payment history.<br />
The Group’s main customers are well-known international retailers. In <strong>2010</strong>,<br />
no single customer accounted for more than 8% of total revenue.<br />
For more than fi ve years, the risk of losses has been covered by credit<br />
insurance taken out with Coface. At 31 December <strong>2010</strong>, 74% of net trade<br />
receivables were covered by insurance that would apply in the event of<br />
non-recovery.<br />
NOTE 27<br />
ENVIRONMENTAL EXPENDITURE<br />
Environmental expenditure amounted to €4.7 million in <strong>2010</strong>, compared with<br />
€4.5 million in 2009 <strong>and</strong> €4.3 million in 2008.<br />
These amounts include routine environmental management system costs,<br />
covering areas such as water <strong>and</strong> waste management. They do not include<br />
taxes on packaging or the cost of disposing of waste electrical <strong>and</strong> electronic<br />
equipment.<br />
The main costs are presented below, including the breakdown between<br />
amounts recognised as expenses <strong>and</strong> as capital expenditure.<br />
<strong>2010</strong> 2009 2008<br />
(in € millions)<br />
Expenses<br />
Capital<br />
expenditure Total Expenses<br />
Capital<br />
expenditure Total Expenses<br />
Capital<br />
expenditure Total<br />
Ambient air quality 0.3 0.1 0.4 0.3 0.2 0.5 0.3 0.2 0.5<br />
Waste water management <strong>and</strong><br />
water saving systems 1.0 0.4 1.4 0.9 0.4 1.3 0.7 0.2 0.9<br />
Waste management 1.6 1.6 1.5 1.5 1.7 0.1 1.8<br />
Soil protection <strong>and</strong><br />
decontamination 0.1 0.3 0.4 0.1 0.1 0.2 0.1 0.2 0.3<br />
Other environmental protection<br />
measures 0.7 0.2 0.9 0.9 0.1 1.0 0.7 0.1 0.8<br />
3<br />
TOTAL 3.7 1.0 4.7 3.7 0.8 4.5 3.5 0.8 4.3<br />
There were no provisions for environmental risks at year-end <strong>2010</strong>, 2009 or 2008.<br />
GROUPE SEB<br />
FINANCIAL REPORT AND REGISTRATION DOCUMENT <strong>2010</strong><br />
109
3 NOTES<br />
CONSOLIDATED FINANCIAL STATEMENTS<br />
TO THE CONSOLIDATED FINANCIAL STATEMENTS<br />
NOTE 28<br />
OFF-BALANCE SHEET COMMITMENTS<br />
28.1. SPECIFIC COMMITMENTS<br />
Specific commitments are discussed in the following notes:<br />
Note 22: Pension <strong>and</strong> other post-employment benefit obligations;<br />
Note 24: Borrowings;<br />
Note 25: Fair value of financial instruments.<br />
28.2. COMMITMENTS ARISING IN THE ORDINARY COURSE OF BUSINESS<br />
COMMITMENTS RELATED TO OPERATING ACTIVITIES<br />
(in € millions) <strong>2010</strong> 2009 2008<br />
Firm orders for property, plant <strong>and</strong> equipment 14.8 16.3 14.6<br />
Guarantees <strong>and</strong> bonds given 2.9 2.7 4.9<br />
Commitments under non-cancellable operating leases 115.1 89.4 67.7<br />
Miscellaneous financial commitments 1.2 1.3 11.3<br />
TOTAL COMMITMENTS GIVEN 134 109.7 98.5<br />
Guarantees received from customers (credit insurance) 544.7 442.8 424.7<br />
Miscellaneous financial commitments 1.2 1.3 8.9<br />
TOTAL COMMITMENTS RECEIVED 545.9 444.1 433.6<br />
It is not the Group’s policy to sell receivables to factoring companies<br />
or banks.<br />
The French companies in the Group are committed to funding Fondation<br />
<strong>Groupe</strong> SEB over several years. At 31 December <strong>2010</strong>, their remaining<br />
commitment amounted to €0.6 million (€1.2 million in 2009).<br />
NOTE 29<br />
CONTINGENT ASSETS AND LIABILITIES<br />
29.1. CONTINGENT ASSETS<br />
Supplier dispute<br />
A provision for contingencies was set aside following a dispute with a<br />
Chinese supplier concerning a shipment (see Note 6.3). The Group’s<br />
maximum exposure is estimated at €5 million, but the entire claim is being<br />
contested <strong>and</strong> the related legal proceedings are expected to be lengthy.<br />
Pentalpha dispute<br />
In April 2006, a jury in New York returned a verdict in favour of <strong>Groupe</strong><br />
SEB in relation to a patent infringement suit fi led in 2000 against Hong<br />
Kong companies Pentalpha Enterprises Ltd. <strong>and</strong> Global-Tech Appliances,<br />
Inc. (hereinafter referred to as Pentalpha), concerning a deep fryer marketed<br />
in the United States. This New York District Court ruling on 9 October 2008<br />
found that <strong>Groupe</strong> SEB was entitled to a reasonable royalty payment of<br />
$4.7 million. Pentalpha challenged this ruling by filing:<br />
an appeal before the Court of Appeals for the Federal Circuit (CAFC)<br />
in Washington, which fully upheld the District Court ruling on<br />
5 February <strong>2010</strong>;<br />
a suit against the SEB patent with the US Patent <strong>and</strong> Trademark<br />
Offi ce (USPTO). The suit was overruled as the USPTO upheld all the<br />
claims of the SEB patent in December 2009.<br />
Pentalpha then submitted a request for the CAFC to review its decision.<br />
Pentalpha has also submitted a $1 million claim against SEB <strong>and</strong> its lawyer<br />
before the New York State Court for inaccurate <strong>and</strong> misleading statements<br />
made during the patent case.<br />
The CAFC rejected Pentalpha’s request for a review of its conviction for<br />
patent infringement <strong>and</strong> on 10 August <strong>2010</strong> <strong>Groupe</strong> SEB received the<br />
€5.1 million in damages that had been held in escrow during the proceedings.<br />
On 25 June <strong>2010</strong>, however, Pentalpha asked the Supreme Court of the<br />
United States to hear its appeal of the CAFC decision.<br />
<strong>Groupe</strong> SEB has not recognised any amounts in the financial statements in<br />
relation to this dispute pending the outcome of these various proceedings.<br />
In the past twelve months, apart from what is refl ected in the fi nancial<br />
statements <strong>and</strong> described in the accompanying notes, there have been<br />
no other government, legal or arbitration proceedings (including any such<br />
proceedings which are pending or threatened of which the Group is aware)<br />
which may have or have had in the recent past signifi cant effects on the<br />
Group <strong>and</strong>/or its financial position or profitability.<br />
110 FINANCIAL REPORT AND REGISTRATION DOCUMENT <strong>2010</strong> GROUPE SEB
3<br />
CONSOLIDATED FINANCIAL STATEMENTS<br />
NOTES TO THE CONSOLIDATED FINANCIAL STATEMENTS<br />
29.2. CONTINGENT LIABILITIES<br />
Recycling end-of-life products<br />
European directive 2002/96/EC on waste electrical <strong>and</strong> electronic equipment<br />
adopted in February 2003 requires Member States to recycle end-of-life<br />
household appliances. This directive was transposed into the national laws<br />
of EU member countries during 2006. The directive states that household<br />
appliance manufacturers <strong>and</strong> importers are responsible for fi nancing the<br />
cost of collecting, sorting <strong>and</strong> reusing/recycling end-of-life electrical <strong>and</strong><br />
electronic equipment. Concerning products sold to private households<br />
before the directive was transposed into national legislation (historical waste),<br />
the directive requires that all producers contribute to fi nancing the costs<br />
in proportion to their respective share of the equipment put on the market<br />
during a “reference period”, generally the year the waste was collected <strong>and</strong><br />
recycled. This system is known as “one for one” (one product recycled for<br />
every one sold) or “pay as you go”.<br />
IFRIC interpretation no. 6 adopted by the European Union in a regulation<br />
published in the Official Journal of the European Communities on 27 January<br />
2006, which was early adopted by <strong>Groupe</strong> SEB in 2005, states that no<br />
provision is required for historical waste, other than in respect of recycling<br />
costs incurred during the reference period. As these costs are or will be offset<br />
in most countries by an environmental charge payable by the consumer until<br />
2011, the net cost of recycling historical waste will not have a material impact<br />
on the Group’s income statement.<br />
Concerning the treatment of products put on the market after the date of<br />
transposition (13 August 2005 in the case of France), the directive states<br />
that producers are individually responsible for guaranteeing financing for the<br />
recovery <strong>and</strong> recycling of the related waste.<br />
To meet these obligations, <strong>Groupe</strong> SEB has joined collective pay-as-yougo<br />
schemes similar to those in place for financing historical waste.<br />
These schemes are managed by coordinating organisations, such as<br />
Eco-Systèmes S.A.S. in France, in which <strong>Groupe</strong> SEB plays an active role.<br />
The financial guarantees generally take the form of advances to these<br />
organisations, based on the expected costs. While joining these schemes<br />
does not exempt <strong>Groupe</strong> SEB from its individual liability, no provision (within<br />
the meaning of IAS 37) is recognised as new products are brought to market,<br />
because a producer can withdraw from the market concerned without<br />
having to individually fulfil its guarantee obligations, leaving the remaining<br />
producers to jointly cover the costs of recycling. For this reason, provisions<br />
are recognised not when a product is introduced but when it has been on the<br />
market during the period of reference. The provisions recorded corresponded<br />
solely to the payment notices issued by the above organisations relating to<br />
the Group’s contributions. These organisations can make adjustments during<br />
later periods based on the actual amounts of the Group s contributions.<br />
Costs of recycling “new waste” are expected to rise in coming years with<br />
the probable increase in return rates <strong>and</strong> gradual introduction of recycling<br />
schemes. These costs will also reflect average product life cycles, changes<br />
in sorted collection logistics costs <strong>and</strong> technological improvements related<br />
to product design <strong>and</strong> recycling techniques.<br />
Statutory employee training rights<br />
Employees of <strong>Groupe</strong> SEB in France with permanent contracts are entitled to<br />
20 hours’ training per year, which may be carried forward for up to six years.<br />
If all or part of this entitlement is not used within six years, it is capped at<br />
120 hours. The costs of supplying training as a result of this entitlement <strong>and</strong><br />
of the training allowances paid to employees who follow courses outside<br />
working hours are covered by the employer. As the decision to incur these<br />
costs is made by Group management <strong>and</strong> they relate to employee services to<br />
be received in future periods, they are expensed as incurred. At 31 December<br />
<strong>2010</strong> the total amount of unused training hours accumulated by <strong>Groupe</strong><br />
SEB employees stood at 590,810 versus 593,294 at 31 December 2009 <strong>and</strong><br />
552,678 at 31 December 2008.<br />
3<br />
NOTE 30<br />
RELATED PARTY TRANSACTIONS<br />
30.1. TRANSACTIONS WITH NON-CONSOLIDATED COMPANIES<br />
The consolidated financial statements include transactions carried out in the normal course of business with associates <strong>and</strong> non-consolidated companies.<br />
All of these transactions are carried out on arm’s length terms.<br />
(in € millions) <strong>2010</strong> 2009 2008<br />
Revenue 2.8 1.8 10.9<br />
Other income 2.2<br />
Purchases<br />
Other non-current financial assets 0.2 3.2<br />
Trade receivables 0.7 0.2 3.3<br />
Trade payables<br />
GROUPE SEB<br />
FINANCIAL REPORT AND REGISTRATION DOCUMENT <strong>2010</strong><br />
111
3 NOTES<br />
CONSOLIDATED FINANCIAL STATEMENTS<br />
TO THE CONSOLIDATED FINANCIAL STATEMENTS<br />
30.2. MANAGEMENT REMUNERATION AND BENEFITS<br />
Details of members of the Board of Directors <strong>and</strong> the Executive Committee, including members who retired in <strong>2010</strong>, are provided in the corporate governance<br />
section of this document. The following table provides an analysis of the remuneration <strong>and</strong> benefi ts paid to the members of the Board of Directors <strong>and</strong><br />
the Executive Committee in <strong>2010</strong>, 2009 <strong>and</strong> 2008:<br />
(in € millions) <strong>2010</strong> 2009 2008<br />
SHORT-TERM BENEFITS<br />
Fixed remuneration 2.5 2.7 2.4<br />
Variable remuneration 2.0 2.1 2.5<br />
Directors’ fees 0.4 0.4 0.4<br />
OTHER BENEFITS<br />
Post-employment benefits 1.7 2.4 2.0<br />
Share-based payments (stock options) 2.0 2.7 1.8<br />
TOTAL 8.6 10.3 9.1<br />
Thierry de La Tour d’Artaise will not be entitled to any compensation for loss<br />
of office when he ceases to be a corporate officer.<br />
His employment contract, signed when he joined the Group in 1994 <strong>and</strong> last<br />
amended when he was appointed Chief Executive Officer, was suspended<br />
on 1 March 2005 for the duration of his term as corporate officer.<br />
In the same way as for other Executive Committee members, the contract<br />
stipulates that in the event of termination of his employment contract at<br />
<strong>Groupe</strong> SEB’s initiative, except as a result of gross negligence or serious<br />
misconduct, or at his own initiative following a change of control of <strong>Groupe</strong><br />
SEB, Thierry de La Tour d’Artaise will be eligible for a total termination benefit<br />
equal to two years’ remuneration. Following adoption of France’s TEPA Act,<br />
an addendum to this contract was signed making the termination benefit<br />
subject to performance conditions. The revised contract stipulates that the<br />
termination benefit, set at a maximum of two years’ gross salary <strong>and</strong> bonus,<br />
will be adjusted based on actual performance in relation to targets over<br />
Thierry de La Tour d’Artaise’s last four years of service, as follows:<br />
if average actual performance falls short of the targets by 50% or more,<br />
no termination benefit will be paid.<br />
if average actual performance represents 50% to 100% of the targets,<br />
between 75% <strong>and</strong> 100% of the termination benefit will be paid.<br />
if average actual performance exceeds the targets, the termination benefit<br />
will be paid in full.<br />
The Board of Directors may, at its discretion, reduce the termination benefit<br />
by as much as 50% if the Group reports a loss for the year preceding the<br />
one in which Thierry de La Tour d’Artaise is removed from office, provided<br />
that the termination benefi t does not represent less than his salary <strong>and</strong><br />
bonus for his final year of service if average actual performance is at least<br />
equal to 50% of targets.<br />
His employment contract does not contain any no-compete clause.<br />
Thierry de La Tour d’Artaise was re-appointed on 13 May 2008. In accordance<br />
with the October 2008 AFEP-MEDEF Code, the Board of Directors therefore<br />
decided to review the situation in 2012, when his term of offi ce is due<br />
to expire.<br />
NOTE 31<br />
SUBSEQUENT EVENTS<br />
Acquisition of the Imusa Group<br />
Following approval by Colombian competition authorities in early December,<br />
<strong>Groupe</strong> SEB signed a contract on 17 December <strong>2010</strong> with the main<br />
shareholders of Colombia-based Imusa to acquire a majority interest in the<br />
Company.<br />
Specialised in small household equipment, Imusa manufactures <strong>and</strong> markets<br />
cookware, which accounts for two-thirds of its sales, as well as plastic food<br />
containers <strong>and</strong> household products. The Company holds forefront positions<br />
in Colombia <strong>and</strong> has exp<strong>and</strong>ed its business to foreign markets, in particular<br />
other Latin American countries <strong>and</strong> the United States.<br />
In <strong>2010</strong>, Imusa reported €89 million in revenue, an increase of more than<br />
30% compared with 2009 at constant exchange rates.<br />
Because Imusa is listed on the Bogota Stock Exchange, albeit with a narrow<br />
market <strong>and</strong> a small float representing around 6% of the shares, a delisting<br />
offer has been initiated at the conclusion of which <strong>Groupe</strong> SEB expects to<br />
hold at least 94.17% of the Company’s capital.<br />
Given the time required to comply with stock market regulations, the<br />
transaction should be completed at end February 2011. It had no impact<br />
on the <strong>2010</strong> consolidated financial statements.<br />
Sale of Plant 3 in Brazil<br />
In August 2008, <strong>Groupe</strong> SEB do Brasil signed an agreement to sell Plant 3<br />
in São Paulo, Brazil. The sale was conditional upon the Group providing the<br />
purchaser with a decontamination certificate. The site was decontaminated<br />
in 2009 <strong>and</strong> <strong>2010</strong>.<br />
On 4 February 2011, <strong>Groupe</strong> SEB do Brasil received a partial payment<br />
of €14.8 million in respect of the sale. The balance of €1.8 million<br />
has been retained by the purchaser in guarantee of full <strong>and</strong> complete<br />
decontamination of the surrounding l<strong>and</strong>. The site’s carrying amount,<br />
including decontamination expenses, was €3.2 million at 31 December <strong>2010</strong>.<br />
The capital gain will therefore amount to €14.8 million <strong>and</strong> will be recognised<br />
in the 2011 financial statements.<br />
112 FINANCIAL REPORT AND REGISTRATION DOCUMENT <strong>2010</strong> GROUPE SEB
3<br />
CONSOLIDATED FINANCIAL STATEMENTS<br />
NOTES TO THE CONSOLIDATED FINANCIAL STATEMENTS<br />
Renegotiation of the syndicated loan<br />
The unused €456.1 million syndicated loan due in 2011 was renegotiated with<br />
the banking pool, which comprises BNP Paribas, Citibank, Commerzbank,<br />
Crédit Agricole, HSBC, Natixis <strong>and</strong> Société Générale. The new loan has a<br />
nominal amount of €560 million <strong>and</strong> a five-year term.<br />
Acquisition of an additional interest in Supor<br />
<strong>Groupe</strong> SEB, which already owned 51.3% of Chinese company Supor, has<br />
decided to acquire an additional 20% from the founder shareholders.<br />
The Group has signed an agreement to purchase 115,450,400 Supor shares<br />
at RMB 30 per share, making a total of RMB 3,464 million (approximately<br />
€385 million). The deal was approved by Supor’s Board of Directors on<br />
16 February <strong>and</strong> will be submitted to Supor’s shareholders for approval at<br />
a General Meeting scheduled for 4 March 2011. <strong>Groupe</strong> SEB will then have<br />
to obtain approval from the Chinese authorities, notably the MOFCOM <strong>and</strong><br />
the CSRC. The entire process could take several months.<br />
To the best of <strong>Groupe</strong> SEB’s knowledge, no other significant event has taken<br />
place since 31 December <strong>2010</strong> that would have a material impact on the<br />
Group’s consolidated financial statements.<br />
NOTE 32<br />
LIST OF CONSOLIDATED COMPANIES AT 31 DECEMBER<br />
<strong>2010</strong> (SHOWING THE % INTEREST HELD BY THE GROUP)<br />
32.1. FULLY CONSOLIDATED COMPANIES<br />
Company Core business (b) Headquarters Siren no. % control % interest<br />
FRANCE<br />
SEB S.A. (a) Parent company France 300 349 636<br />
Calor S.A.S. (a) * France 956 512 495 100 100<br />
S.A.S. SEB (a) * France 302 412 226 100 100<br />
Tefal S.A.S. (a) * France 301 520 920 100 100<br />
Rowenta France S.A.S. (a) * France 301 859 880 100 100<br />
<strong>Groupe</strong> SEB Moulinex S.A.S. (a) * France 407 982 214 100 100<br />
SIS S.A.S. (a) *** France 399 014 216 100 100<br />
SEB Développement S.A.S. (a) *** France 16 950 842 100 100<br />
<strong>Groupe</strong> SEB France S.A.S. (a) ** France 440 410 637 100 100<br />
<strong>Groupe</strong> SEB Retailing (a) ** France 440 410 884 100 100<br />
SEB Internationale SAS (a) Holding company France 301 189 718 100 100<br />
<strong>Groupe</strong> SEB Export (a) ** France 421 266 271 100 100<br />
3<br />
OTHER EU COUNTRIES<br />
Rowenta Werke GmbH * Germany 100 100<br />
Krups GmbH ** Germany 100 100<br />
<strong>Groupe</strong> SEB Deutschl<strong>and</strong> GmbH ** Germany 100 100<br />
Rowenta Deutschl<strong>and</strong> GmbH Holding company Germany 100 100<br />
SEB Osterreich HmbH ** Austria 100 100<br />
<strong>Groupe</strong> SEB Belgium S.A. NV ** Belgium 100 100<br />
<strong>Groupe</strong> SEB Nordik AS ** Denmark 100 100<br />
<strong>Groupe</strong> SEB Iberica S.A. ** Spain 100 99.8<br />
<strong>Groupe</strong> SEB UK Ltd. ** United Kingdom 100 100<br />
Tefal UK Dormant United Kingdom 100 100<br />
<strong>Groupe</strong> SEB Hellados S.A. ** Greece 100 100<br />
<strong>Groupe</strong> SEB Italia SpA ** Italy 100 100<br />
Lagostina SpA * Italy 100 100<br />
Casa Lagostina s.r.l. ** Italy 100 100<br />
<strong>Groupe</strong> SEB Nederl<strong>and</strong> BV ** Netherl<strong>and</strong>s 100 100<br />
Rowenta Invest BV Holding company Netherl<strong>and</strong>s 100 100<br />
<strong>Groupe</strong> SEB Portugal Ltd. ** Portugal 100 99.9<br />
(a) A member of the French tax group.<br />
(b) Core business:<br />
* Manufacturing, sales <strong>and</strong> marketing;<br />
** Sales <strong>and</strong> marketing;<br />
*** Service.<br />
GROUPE SEB<br />
FINANCIAL REPORT AND REGISTRATION DOCUMENT <strong>2010</strong><br />
113
3 NOTES<br />
CONSOLIDATED FINANCIAL STATEMENTS<br />
TO THE CONSOLIDATED FINANCIAL STATEMENTS<br />
Company Core business (b) Headquarters Siren no. % control % interest<br />
AMERICAS<br />
<strong>Groupe</strong> SEB Canada Inc. ** Canada 100 100<br />
<strong>Groupe</strong> SEB USA ** United States 100 100<br />
All-Clad USA, Inc. Delaware Holding company United States 100 100<br />
All-Clad Metal-Crafters LLC * United States 100 100<br />
Clad Holdings Corp. Delaware *** United States 100 100<br />
<strong>Groupe</strong> SEB Holdings USA Holding company United States 100 100<br />
<strong>Groupe</strong> SEB Argentina S.A. ** Argentina 100 100<br />
Grupo SEB do Brasil * Brazil 100 100<br />
Lojas SEB ** Brazil 100 100<br />
<strong>Groupe</strong> SEB Chile Ltda. ** Chile 100 100<br />
<strong>Groupe</strong> SEB Colombia S.A. * Colombia 100 100<br />
G.S.E.B. Mexicana S.A. de CV ** Mexico 100 100<br />
Vistar S.A. de CV * Mexico 100 100<br />
<strong>Groupe</strong> SEB Servicios Mexico *** Mexico 100 100<br />
<strong>Groupe</strong> SEB Venezuela S.A. ** Venezuela 100 100<br />
<strong>Groupe</strong> SEB Peru S.R.L. ** Peru 100 100<br />
OTHER COUNTRIES<br />
<strong>Groupe</strong> SEB Schweiz GmbH ** Switzerl<strong>and</strong> 100 100<br />
<strong>Groupe</strong> SEB Australia Ltd. ** Australia 100 100<br />
SSEAC Co. Ltd. * China 100 100<br />
SEB Trading Co. Ltd. ** China 100 100<br />
<strong>Groupe</strong> SEB Korea ** Korea 100 100<br />
SEB Asia Ltd. **/*** Hong Kong 100 100<br />
<strong>Groupe</strong> SEB Thail<strong>and</strong> ** Thail<strong>and</strong> 100 100<br />
<strong>Groupe</strong> SEB Singapore Pty Ltd. ** Singapore 100 100<br />
<strong>Groupe</strong> SEB Malaysia SDN. BHD ** Malaysia 100 100<br />
<strong>Groupe</strong> SEB Central Europe ** Hungary 100 100<br />
<strong>Groupe</strong> SEB Japan Co. Ltd. ** Japan 100 100<br />
<strong>Groupe</strong> SEB Polska Zoo ** Pol<strong>and</strong> 100 100<br />
<strong>Groupe</strong> SEB CR s.r.o<br />
<strong>Groupe</strong> SEB Slovensko s.r.o **<br />
Czech Republic<br />
Slovakia 100 100<br />
<strong>Groupe</strong> SEB Romania ** Romania 100 100<br />
Groups SEB Baltic ** Lithuania 100 100<br />
Grain Harvest Development Ltd. Holding company Hong Kong 100 100<br />
<strong>Groupe</strong> SEB d.o.o. ** Slovenia 100 100<br />
<strong>Groupe</strong> SEB Bulgaria EOOD ** Bulgaria 100 100<br />
<strong>Groupe</strong> SEB Istanbul A.S. ** Turkey 100 100<br />
<strong>Groupe</strong> SEB Ukraine ** Ukraine 100 100<br />
<strong>Groupe</strong> SEB Vostok * Russia 100 100<br />
ZJ Supor Zehjiang Supor Co. Ltd. Holding company China 51.31 51.31<br />
DG Supor Dongguan Supor Electrical<br />
Appliances * China 100 65.92<br />
SX Supor Shaoxing Supor Life Electrical<br />
Appliances Co. Ltd. * China 100 51.31<br />
Vietnam Supor Supor (Vietnam) Co. Ltd. * Vietnam 100 51.31<br />
WH CKW Wuhan Supor Cookware<br />
Co. Ltd. * China 100 63.1<br />
WH Pressure Wuhan Supor Pressure Cooker<br />
Co. Ltd. Holding company China 99.36 50.80<br />
(a) A member of the French tax group.<br />
(b) Core business:<br />
* Manufacturing, sales <strong>and</strong> marketing;<br />
** Sales <strong>and</strong> marketing;<br />
*** Service.<br />
114 FINANCIAL REPORT AND REGISTRATION DOCUMENT <strong>2010</strong> GROUPE SEB
3<br />
CONSOLIDATED FINANCIAL STATEMENTS<br />
NOTES TO THE CONSOLIDATED FINANCIAL STATEMENTS<br />
Company Core business (b) Headquarters Siren no. % control % interest<br />
WH Supor Wuhan Supor Co. Ltd. *** China 96.53 49.77<br />
WH Waste<br />
YH Waste<br />
ZJ Rubber<br />
ZJ Lesu<br />
ZJ Supor EA<br />
Wuhan Supor Waste Recovery<br />
Co. Ltd. *** China 100 51.31<br />
Yuhuan Supor Waste Recovery<br />
Co. Ltd. *** China 60 30.79<br />
Zhejiang Supor Rubber &<br />
Plastics Products Co. Ltd. * China 93.23 47.82<br />
Zhejiang Lesu Metal Material<br />
Co. Ltd. * China 51 26.17<br />
Zhejiang Supor Electrical<br />
Appliances Manufacturing<br />
Co. Ltd. * China 100 63.48<br />
(a) A member of the French tax group.<br />
(b) Core business:<br />
* Manufacturing, sales <strong>and</strong> marketing;<br />
** Sales <strong>and</strong> marketing;<br />
*** Service.<br />
32.2. ASSOCIATES<br />
Company Core business Headquarters Siren no. % interest<br />
Tefal & KV St-Petersburg A/O * Russia 100<br />
* Company dissolved in August <strong>2010</strong>.<br />
32.3. NON-CONSOLIDATED COMPANIES<br />
Company Core business (a) Headquarters Siren no. % interest<br />
Iran SEB (not material in relation to the Group as<br />
a whole) Dormant Iran 70<br />
Tefal India Dormant India 100<br />
<strong>Groupe</strong> SEB Pars (not material in relation to the<br />
Group as a whole) ** Iran 72<br />
3<br />
(a) Core business:<br />
* Manufacturing, sales <strong>and</strong> marketing;<br />
* Sales <strong>and</strong> marketing;<br />
*** Service.<br />
GROUPE SEB<br />
FINANCIAL REPORT AND REGISTRATION DOCUMENT <strong>2010</strong><br />
115
3 STATUTORY<br />
CONSOLIDATED FINANCIAL STATEMENTS<br />
AUDITORS’ REPORT ON THE CONSOLIDATED FINANCIAL STATEMENTS<br />
STATUTORY AUDITORS’ REPORT ON THE<br />
CONSOLIDATED FINANCIAL STATEMENTS<br />
YEAR ENDED 31 DECEMBER <strong>2010</strong><br />
To the shareholders<br />
In compliance with the assignment entrusted to us by your Annual General<br />
Meeting, we hereby report to you, for the year ended 31 December <strong>2010</strong> on:<br />
the audit of the accompanying consolidated financial statements of<br />
<strong>Seb</strong> S.A.;<br />
the justification of our assessments;<br />
the specific verification required by law.<br />
These consolidated financial statements have been approved by the Board<br />
of Directors. Our role is to express an opinion on these consolidated financial<br />
statements based on our audit.<br />
OPINION ON THE CONSOLIDATED FINANCIAL STATEMENTS<br />
We conducted our audit in accordance with professional st<strong>and</strong>ards applicable<br />
in France; those st<strong>and</strong>ards require that we plan <strong>and</strong> perform the audit to obtain<br />
reasonable assurance about whether the consolidated financial statements are<br />
free of material misstatement. An audit includes examining, on a test basis or by<br />
selection, evidence supporting the amounts <strong>and</strong> disclosures in the consolidated<br />
financial statements. An audit also includes assessing the accounting policies<br />
used <strong>and</strong> significant estimates made by management, as well as evaluating the<br />
overall financial statements presentation. We believe that the audit evidence we<br />
have obtained is sufficient <strong>and</strong> appropriate to provide a basis for our audit opinion.<br />
In our opinion, the consolidated fi nancial statements give a true <strong>and</strong> fair<br />
view of the assets <strong>and</strong> liabilities <strong>and</strong> of the financial position of the Group<br />
as at 31 December <strong>2010</strong> <strong>and</strong> of the results of its operations for the year then<br />
ended in accordance with International <strong>Financial</strong> <strong>Report</strong>ing St<strong>and</strong>ards as<br />
adopted by the European Union.<br />
JUSTIFICATION OF OUR ASSESSMENTS<br />
In accordance with the requirements of Article L. 823-9 of the French<br />
Commercial Code (Code de Commerce) relating to the justification of our<br />
assessments, we bring to your attention the following matters:<br />
At each balance sheet date, the Group assesses whether there is any<br />
indication that non-current assets belonging to various cash-generating<br />
units (CGUs) may be impaired <strong>and</strong> performs annual impairment tests on<br />
goodwill <strong>and</strong> assets with indefinite lives, as described in Notes 1.4.1 <strong>and</strong><br />
1.4.3 to the consolidated financial statements.<br />
We have examined the impairment testing methods as well as the cash<br />
flow forecasts <strong>and</strong> assumptions used <strong>and</strong> we have verified that Notes 6.2<br />
<strong>and</strong> 10 contain the appropriate disclosures.<br />
Note 1.4.9 to the consolidated financial statements describes how<br />
deferred tax has been determined <strong>and</strong> Note 8.4 discloses the amount of<br />
deductible temporary differences <strong>and</strong> tax losses carried forward without<br />
any corresponding deferred tax assets.<br />
Our work has consisted in the assessment of the data <strong>and</strong> assumption retained<br />
by the Group for their estimations <strong>and</strong> in the verification of the pertinence of<br />
disclosures made in the notes to the consolidated financial statements.<br />
These assessments were made as part of our audit of the consolidated<br />
fi nancial statements taken as a whole, <strong>and</strong> therefore contributed to the<br />
opinion we formed which is expressed in the first part of this report.<br />
SPECIFIC VERIFICATION<br />
As required by law, we have also verified in accordance with professional<br />
st<strong>and</strong>ards applicable in France the information presented in the Group’s<br />
management report.<br />
We have no matters to report as to its fair presentation <strong>and</strong> its consistency<br />
with the consolidated financial statements.<br />
PricewaterhouseCoopers Audit<br />
Bernard RASCLE<br />
Lyon <strong>and</strong> Villeurbanne, 21 March 2011<br />
The Statutory Auditors<br />
Deloitte & Associés<br />
Dominique VALETTE<br />
This is a free translation into English of the Statutory Auditors’ report issued in French <strong>and</strong> is provided solely for the convenience of English speaking<br />
users. The Statutory Auditors’ report includes information specifically required by French law in such reports, whether modified or not. This information<br />
is presented below the opinion on the consolidated financial statements <strong>and</strong> includes an explanatory paragraph discussing the auditors’ assessments of<br />
certain significant accounting <strong>and</strong> auditing matters. These assessments were considered for the purpose of issuing an audit opinion on the consolidated<br />
financial statements taken as a whole <strong>and</strong> not to provide separate assurance on individual account captions or on information taken outside of the<br />
consolidated financial statements.<br />
This report should be read in conjunction with, <strong>and</strong> construed in accordance with, French law <strong>and</strong> professional auditing st<strong>and</strong>ards applicable in France.<br />
116 FINANCIAL REPORT AND REGISTRATION DOCUMENT <strong>2010</strong> GROUPE SEB
COMPANY FINANCIAL STATEMENTS<br />
4<br />
COMPANY FINANCIAL<br />
STATEMENTS<br />
BALANCE SHEET – AT 31 DECEMBER 118<br />
INCOME STATEMENT –<br />
YEARS ENDED 31 DECEMBER 120<br />
REPORT OF THE BOARD OF DIRECTORS 121<br />
<strong>Financial</strong> review 121<br />
Significant events of the year 121<br />
NOTES TO THE COMPANY<br />
FINANCIAL STATEMENTS 122<br />
AUDITORS’ REPORT<br />
ON THE COMPANY<br />
FINANCIAL STATEMENTS 133<br />
4<br />
GROUPE SEB<br />
FINANCIAL REPORT AND REGISTRATION DOCUMENT <strong>2010</strong><br />
117
4 BALANCE<br />
COMPANY FINANCIAL STATEMENTS<br />
SHEET – AT 31 DECEMBER<br />
BALANCE SHEET – AT 31 DECEMBER<br />
Assets<br />
(in € millions)<br />
NON-CURRENT ASSETS<br />
Gross<br />
<strong>2010</strong> 2009<br />
Depreciation/<br />
amortisation Net Net<br />
Intangible assets 0.1 0.1 0.1<br />
Patents, licenses <strong>and</strong> other rights 7.5 7.3 0.2<br />
Shares in subsidiaries <strong>and</strong> affiliates 815.5 36.6 778.9 684.4<br />
Loans to subsidiaries <strong>and</strong> affiliates 767.9 767.9 790.3<br />
Other non-current assets 0.5 0.5 0.5<br />
TOTAL 1,591.5 43.9 1,547.6 1,475.3<br />
CURRENT ASSETS<br />
Trade receivables 0.4 0.4 0.4<br />
Other receivables 16 16 42.1<br />
Marketable securities 115.9 115.9 188.6<br />
Cash <strong>and</strong> cash equivalents 25.1 25.1 60.6<br />
Prepaid expenses 0.3 0.3 0.2<br />
TOTAL 157.7 0 157.7 291.9<br />
Conversion losses 2.2 2.2 3.3<br />
TOTAL ASSETS 1,751.4 43.9 1,707.5 1,770.5<br />
118 FINANCIAL REPORT AND REGISTRATION DOCUMENT <strong>2010</strong> GROUPE SEB
4<br />
COMPANY FINANCIAL STATEMENTS<br />
BALANCE SHEET – AT 31 DECEMBER<br />
Liabilities <strong>and</strong> shareholders’ equity (before appropriation of profit)<br />
(in € millions) <strong>2010</strong> 2009<br />
SHAREHOLDERS’ EQUITY<br />
Share capital 49.9 49.9<br />
Additional paid-in capital 90.3 90.3<br />
Revaluation reserve 16.9 16.9<br />
Legal reserve 5.2 5.2<br />
Regulated reserves 0.8 0.8<br />
Revenue reserves 7.9 7.9<br />
Retained earnings 603.0 580.1<br />
Net profit for the year 45.7 74.1<br />
TOTAL 819.7 825.2<br />
PROVISIONS FOR CONTINGENCIES AND CHARGES<br />
Provisions for contingencies 19.8 3.3<br />
Provisions for charges 121.7 114.7<br />
TOTAL 141.5 118<br />
PAYABLES<br />
Bank borrowings 226.0 389.9<br />
Other borrowings 500.1 417.7<br />
Trade payables 3.3 1.6<br />
Accrued taxes <strong>and</strong> payroll costs 3.2 2<br />
Other payables 9.2 13.5<br />
TOTAL 741.8 824.7<br />
Conversion gains 4.4 2.6<br />
TOTAL EQUITY AND LIABILITIES 1,707.5 1,770.5<br />
4<br />
GROUPE SEB<br />
FINANCIAL REPORT AND REGISTRATION DOCUMENT <strong>2010</strong><br />
119
4 INCOME<br />
COMPANY FINANCIAL STATEMENTS<br />
STATEMENT – YEARS ENDED 31 DECEMBER<br />
INCOME STATEMENT –<br />
YEARS ENDED 31 DECEMBER<br />
(in € millions) <strong>2010</strong> 2009<br />
OPERATING REVENUES<br />
Service revenues<br />
Reversals of depreciation, amortisation <strong>and</strong> provisions, expense transfers 0.1<br />
Other income 0.6 0.4<br />
TOTAL 0.6 0.5<br />
OPERATING EXPENSES<br />
Other purchases <strong>and</strong> external charges 6.4 5.1<br />
Taxes other than on income 0.7 0.7<br />
Wages <strong>and</strong> salaries 2.2 2.4<br />
Payroll taxes 2.2 2.7<br />
Depreciation <strong>and</strong> amortisation expense 0.3 0.3<br />
Other expenses 1 0.5<br />
TOTAL 12.8 11.7<br />
LOSS FROM ORDINARY ACTIVITIES BEFORE NET FINANCIAL INCOME (12.2) (11.2)<br />
FINANCIAL REVENUES<br />
Dividends from subsidiaries <strong>and</strong> affiliates 78 79.1<br />
Interest income 0.5 1.1<br />
Reversals of provisions, expense transfers 38.1 50.4<br />
Gains on foreign exchange 169.7 99.5<br />
Net income from sales of marketable securities 0.1 0.1<br />
TOTAL 286.4 230.2<br />
FINANCIAL EXPENSES<br />
Charges to provisions for impairment of financial assets 19.8 28.3<br />
Interest expense 13.6 20.3<br />
Loss on foreign exchange 170.3 101.3<br />
TOTAL 203.7 149.9<br />
NET FINANCIAL INCOME 82.7 80.3<br />
PROFIT FROM ORDINARY ACTIVITIES 70.5 69.1<br />
OTHER INCOME<br />
Other income from revenue transactions 0.7 0<br />
Other income from capital transactions 0.7 0.8<br />
Reversals of provisions, expense transfers 17.5 1<br />
TOTAL 18.9 1.8<br />
OTHER EXPENSES<br />
Other expenses on revenue transactions 0.3 0.1<br />
Other expenses on capital transactions 14.4 4.6<br />
Charges to provisions 14.2 18.6<br />
TOTAL 28.9 23.3<br />
NET OTHER INCOME/(EXPENSE) (10) (21.5)<br />
Income tax 14.8 (26.5)<br />
NET PROFIT 45.7 74.1<br />
120 FINANCIAL REPORT AND REGISTRATION DOCUMENT <strong>2010</strong> GROUPE SEB
4<br />
COMPANY FINANCIAL STATEMENTS<br />
REPORT OF THE BOARD OF DIRECTORS<br />
REPORT OF THE BOARD OF DIRECTORS<br />
FINANCIAL REVIEW<br />
SEB S.A., the parent company of <strong>Groupe</strong> SEB, is a holding company whose<br />
activities are largely confi ned to overseeing the manufacturing <strong>and</strong> sales<br />
activities carried out by its subsidiaries.<br />
As a result, SEB S.A.’s earnings only partly reflect the performance of the<br />
Group <strong>and</strong> year-on-year changes in the Group’s performance are not visible<br />
at the level of the Company’s results until the following year, because its<br />
revenues consist essentially of dividends received from subsidiaries.<br />
The main items reflected in the Company’s accounts are as follows:<br />
income:<br />
dividends from subsidiaries, in the amount of €73.3 million (€71.2 million<br />
in 2009);<br />
expenses:<br />
fees for services provided by SEB Développement, a subsidiary of<br />
SEB S.A., for an amount of €3.3 million (€1.6 million in 2009).<br />
Since 1 January 2005, SEB Développement has taken over the market<br />
prospecting, international sales promotion <strong>and</strong> development, administrative,<br />
financial, research, innovation <strong>and</strong> industrial property services previously<br />
supplied by the Company to subsidiaries.<br />
The Company ended the year with net profit of €45.7 million (€74.1 million<br />
in 2009).<br />
SIGNIFICANT EVENTS OF THE YEAR<br />
SEB S.A. prepaid a €117 million loan originally repayable in annual<br />
instalments of €23.4 million until September 2014.<br />
On 15 July <strong>2010</strong>, SEB S.A. recapitalised its subsidiaries <strong>Groupe</strong> SEB<br />
Moulinex for €49.8 million, SEB Développement for €9.8 million <strong>and</strong> <strong>Groupe</strong><br />
SEB Alliance for €0.1 million.<br />
4<br />
GROUPE SEB<br />
FINANCIAL REPORT AND REGISTRATION DOCUMENT <strong>2010</strong><br />
121
4 NOTES<br />
COMPANY FINANCIAL STATEMENTS<br />
TO THE COMPANY FINANCIAL STATEMENTS<br />
NOTES TO THE COMPANY FINANCIAL<br />
STATEMENTS<br />
NOTE 0<br />
SIGNIFICANT EVENTS OF THE YEAR<br />
SEB S.A. prepaid a €117 million loan originally repayable in annual<br />
instalments of €23.4 million until September 2014.<br />
On 15 July <strong>2010</strong>, SEB S.A. recapitalised its subsidiaries <strong>Groupe</strong> SEB<br />
Moulinex for €49.8 million, SEB Développement for €9.8 million <strong>and</strong> <strong>Groupe</strong><br />
SEB Alliance for €0.1 million.<br />
NOTE 1<br />
SUMMARY OF SIGNIFICANT ACCOUNTING POLICIES<br />
1.1. PRINCIPLES<br />
The Company fi nancial statements have been prepared in line with the<br />
principle of prudence <strong>and</strong> in compliance with the preparation <strong>and</strong> presentation<br />
rules set out in French law <strong>and</strong> France’s Plan Comptable Général of 1999.<br />
1.2. INTANGIBLE ASSETS<br />
Intangible assets are stated at acquisition cost, excluding transaction costs<br />
<strong>and</strong> interest expense.<br />
They mainly consist of patents amortised over periods ranging from three<br />
to ten years.<br />
1.3. SHARES IN SUBSIDIARIES AND<br />
AFFILIATES<br />
Shares in subsidiaries <strong>and</strong> affiliates are stated at the lower of cost <strong>and</strong> net<br />
realisable value. Cost corresponds to acquisition cost, except for shares<br />
acquired before 31 December 1976 <strong>and</strong> included in the legal revaluation,<br />
which are stated at valuation. Net realisable value is determined based on the<br />
Company’s equity in the investee’s net assets, market value or the investee’s<br />
earnings outlook.<br />
1.4. OWN SHARES<br />
SEB S.A. shares held by the Company are classified as follows:<br />
shares bought back for allocation on exercise of existing or future stock<br />
options are classified under ‘Marketable securities;<br />
all other SEB S.A. shares held by the Company – mainly under the liquidity<br />
contract – are classified under “Other non-current assets”.<br />
At the year-end, an impairment loss is recognised whenever the shares’<br />
purchase price is lower than the average share price for the last month of<br />
the year.<br />
1.5. CASH AND CASH EQUIVALENTS AND<br />
FINANCIAL INSTRUMENTS<br />
SEB S.A. manages cash <strong>and</strong> cash equivalents <strong>and</strong> currency risk on behalf<br />
of the Group.<br />
The Company meets the short-term financing needs of virtually all Group<br />
subsidiaries. A daily bank balance reporting system has been set up to<br />
monitor the fi nancing needs of the French, German, Spanish, Italian,<br />
Hungarian, Austrian, Swiss <strong>and</strong> Hong Kong subsidiaries. Current account<br />
advances to <strong>and</strong> from the cash pool pay interest at the overnight rate for<br />
the currency concerned plus 0.15 bps.<br />
Commercial paper is issued in euros under a €600 million programme<br />
rated A2 by St<strong>and</strong>ard & Poor’s <strong>and</strong> is converted into the functional<br />
currency of the subsidiaries concerned outside the euro zone by means<br />
of swaps, thereby limiting the Company’s exposure to currency risks on<br />
these financing transactions. A provision may be set aside to cover the<br />
unhedged portion of the risk.<br />
SEB S.A. fixes the exchange rates for intercompany import <strong>and</strong> export<br />
transactions on behalf of its subsidiaries. Net currency positions (arising<br />
when exports exceed imports) are hedged by forward foreign exchange<br />
contracts, allowing the hedged transactions to be recognised directly in<br />
the subsidiary’s local currency at the hedging rate. The unrealised gain<br />
or loss, i.e. the difference between the hedging rate <strong>and</strong> the closing rate,<br />
is recognised in the financial statements of SEB S.A. at the period-end.<br />
Any unrealised losses arising on such transactions are recognised on<br />
the assets side of the balance sheet under “Conversion losses” <strong>and</strong> lead<br />
to the recognition of a provision for contingencies. Unrealised gains are<br />
recognised in liabilities under “Conversion gains” without affecting profit<br />
for the year.<br />
The contango or backwardation is recorded in the income statement when<br />
the swap expires.<br />
122 FINANCIAL REPORT AND REGISTRATION DOCUMENT <strong>2010</strong> GROUPE SEB
4<br />
COMPANY FINANCIAL STATEMENTS<br />
NOTES TO THE COMPANY FINANCIAL STATEMENTS<br />
1.6. CONVERSION AND MEASUREMENT<br />
OF CASH AND SHORT-TERM BANK<br />
LOANS IN FOREIGN CURRENCY<br />
Cash <strong>and</strong> short-term bank loans denominated in foreign currency at the<br />
period-end are converted into local currency at the exchange rate on the<br />
last business day of the period, <strong>and</strong> conversion differences are recognised<br />
in profit for the period under “Exchange gains” or “Exchange losses”.<br />
1.7. INCOME TAX<br />
SEB S.A. <strong>and</strong> its French subsidiaries fi le a consolidated tax return under<br />
the group relief system provided for in Article 223-1 et seq. of the General<br />
French Tax Code (Code Général des Impôts).<br />
No group relief agreement has been signed <strong>and</strong> each member of the tax<br />
group therefore calculates the income tax charge or benefit they would have<br />
paid or received if they had been taxed on a st<strong>and</strong>-alone basis. As the parent<br />
company, SEB S.A. recognises in its income statement any tax savings or<br />
additional tax expense arising on the consolidation of the French subsidiaries’<br />
taxable results. Tax savings resulting from group relief for tax losses incurred<br />
by companies in the tax group are initially recognised by SEB S.A. <strong>and</strong> are<br />
transferred back to the companies concerned when they return to profit.<br />
NOTE 2<br />
MOVEMENTS IN NON-CURRENT ASSETS<br />
2.1. INTANGIBLE ASSETS<br />
During the year, SEB S.A. acquired the right to use the 3 D CLIP patent for<br />
€0.2 million. The licence is amortised on a straight-line basis over three years.<br />
2.2. PROPERTY, PLANT AND EQUIPMENT<br />
There were no material acquisitions, disposals or retirements of property,<br />
plant <strong>and</strong> equipment during the period.<br />
2.3. NON-CURRENT FINANCIAL ASSETS<br />
(in € millions) 2009 Additions Disposals <strong>2010</strong><br />
Shares in subsidiaries <strong>and</strong> affiliates 755.8 59.7 815.5<br />
Loans to subsidiaries <strong>and</strong> affiliates 790.3 0.5 22.9 767.9<br />
Own shares 0.0 0.3 0 0.3<br />
Other investments 0.4 0.0 0.3 0.1<br />
TOTAL COST 1,546.5 60.5 23.2 1,583.8<br />
Provisions for impairment of shares in subsidiaries <strong>and</strong> affiliates (71.4) (34.8) (36.6)<br />
Provisions for impairment of other investments 0.0 0 0 0.0<br />
TOTAL PROVISIONS (71.4) 0.0 0.0 (36.6)<br />
TOTAL CARRYING AMOUNT 1,475.1 60.5 58.0 1,547.2<br />
(in € millions) 2008 Additions Disposals 2009<br />
Shares in subsidiaries <strong>and</strong> affiliates 736.8 19 755.8<br />
Loans to subsidiaries <strong>and</strong> affiliates 1,106.4 157.3 473.4 790.3<br />
Own shares 21.9 21.9 0.0<br />
Other investments 0.4 0.4<br />
Other non-current financial assets - -<br />
TOTAL COST 1,865.5 176.3 495.3 1,546.5<br />
Provisions for impairment of shares in subsidiaries <strong>and</strong> affiliates (46.4) (25.0) 0 (71.4)<br />
Provisions for impairment of own shares (8.4) (8.4) 0.0<br />
TOTAL PROVISIONS (54.8) (25.0) (8.4) (71.4)<br />
4<br />
TOTAL CARRYING AMOUNT 1,810.7 151.3 486.9 1,475.1<br />
Loans to subsidiaries <strong>and</strong> affiliates include advances by the parent company<br />
SEB S.A. to its subsidiaries under the Group’s financial policy (see Note 1.5).<br />
The decrease of €22 million was due to a decline in intercompany current<br />
account advances (€15.6 million) <strong>and</strong> the repayment of the long-term loan<br />
made to <strong>Groupe</strong> SEB Iberica (€7.1 million).<br />
The revaluation reserve in shareholders’ equity relates mainly to non-current<br />
financial assets.<br />
At 31 December <strong>2010</strong>, the Company held 1,980,698 SEB S.A. shares acquired<br />
at an average price of €31.14 per share (before impairment). The shares are<br />
being held mainly for allocation on exercise of stock options (39,596 under<br />
the 2003 plan, 213,596 under the 2004 plan, 158,333 under the 2005 plan,<br />
280,497 under the 2006 plan, 571,050 under the 2007 plan, 988,200 under the<br />
2008 plan, 370,250 under the 2009 plan <strong>and</strong> 412,592 under the <strong>2010</strong> plan).<br />
In <strong>2010</strong>, SEB S.A. bought back 264,329 shares on the market at a weighted<br />
average price of €56.54 <strong>and</strong> sold 1,433,074 shares on the market at an<br />
average price of €33.76.<br />
GROUPE SEB<br />
FINANCIAL REPORT AND REGISTRATION DOCUMENT <strong>2010</strong><br />
123
4 NOTES<br />
COMPANY FINANCIAL STATEMENTS<br />
TO THE COMPANY FINANCIAL STATEMENTS<br />
NOTE 3<br />
LIST OF SUBSIDIARIES AND AFFILIATES<br />
3.1. INFORMATION CONCERNING SHARES IN SUBSIDIARIES AND AFFILIATES<br />
3.1.1. Subsidiaries (more than 50%-owned)<br />
(in € millions)<br />
Shareholders’<br />
equity<br />
% interest<br />
Carrying amount<br />
of investment<br />
Loans <strong>and</strong><br />
advances given<br />
Calor S.A.S. 7.9 100% 39.6 16.6 0.6<br />
Guarantees <strong>and</strong> Dividends received<br />
bonds given during the period<br />
S.A.S. SEB 14.9 100% 101.1 1.5 - -<br />
Tefal S.A.S. 45.5 100% 9.4 21.7 - -<br />
Rowenta France S.A.S. 7.3 100% 17 (4.4) - -<br />
SEB Développement S.A.S. 17.6 100% 15.5 16.3 - -<br />
Rowenta Invest BV 157.7 100% 211.8 0.1 - -<br />
SEB Internationale S.A.S. 501.3 100% 215.4 212.7 - 0<br />
<strong>Groupe</strong> SEB France 204.7 98% 73.9 (150.1) 2.1 66.7<br />
<strong>Groupe</strong> SEB Export 37.4 100% 38 (104.5) 0.5 4.5<br />
<strong>Groupe</strong> SEB Moulinex 8.9 100% 70.3 (4.1) -<br />
<strong>Groupe</strong> SEB Retailing 1.2 100% 3 1.4 - 1<br />
3.1.2. Affiliates (10% to 50%-owned)<br />
(in € millions)<br />
Shareholders’<br />
equity<br />
% interest<br />
Carrying amount<br />
of investment<br />
Loans <strong>and</strong><br />
advances given<br />
Guarantees <strong>and</strong> Dividends received<br />
bonds given during the period<br />
S.I.S. 3.6 46.81% 0.5 6.5 - 1.2<br />
Domaine de Seillac S.A.<br />
(at 31 December 2003) (0.8) 24.75% 0.1 - - -<br />
As allowed by Article 24 paragraph 11 of decree 83.1020 dated 29 November<br />
1983, the results of individual subsidiaries are not disclosed because<br />
the Company considers that disclosure of this information could be<br />
seriously prejudicial to its interests. Additional information analysed by<br />
geographic segment is provided in the notes to the consolidated financial<br />
statements (Note 4 – Segment Information). Consolidated Group revenue<br />
generated by direct <strong>and</strong> indirect subsidiaries <strong>and</strong> affiliates totalled<br />
€3,651.8 million while net income attributable to owners of the parent came<br />
to €220.4 million in <strong>2010</strong>.<br />
3.2. GENERAL INFORMATION CONCERNING OTHER SUBSIDIARIES AND AFFILIATES<br />
Carrying amount of investments: €0.1 million.<br />
NOTE 4<br />
OTHER RECEIVABLES<br />
Other receivables correspond to income tax prepayments for €5.5 million <strong>and</strong> financial instruments for €8.2 million.<br />
124 FINANCIAL REPORT AND REGISTRATION DOCUMENT <strong>2010</strong> GROUPE SEB
4<br />
COMPANY FINANCIAL STATEMENTS<br />
NOTES TO THE COMPANY FINANCIAL STATEMENTS<br />
NOTE 5<br />
PROVISIONS FOR CONTINGENCIES AND CHARGES<br />
Changes in provisions for contingencies <strong>and</strong> charges for the period were<br />
as follows:<br />
In line with the principles described in Note 1.5, a provision for currency risks<br />
of €2.1 million was recorded at 31 December <strong>2010</strong>.<br />
A €17.7 million provision for unrealised losses on stock options was recorded<br />
to cover the outflow of resources arising from exercise of the options granted<br />
under current plans.<br />
Tax savings resulting from group relief for tax losses incurred by certain<br />
companies in the tax group will be transferred back to the companies<br />
concerned if <strong>and</strong> when they return to profit. They are covered by a provision<br />
for an aggregate amount of €121.7 million at 31 December <strong>2010</strong>.<br />
(in € millions) 2009 Increases<br />
Reversals<br />
(unused) Utilisations <strong>2010</strong><br />
Provisions for claims <strong>and</strong> litigation 0.0 0<br />
Provisions for currency risks 3.3 2.1 3.3 2.1<br />
Provisions for other risks 0.0 17.7 0 0 17.7<br />
TOTAL PROVISIONS FOR CONTINGENCIES 3.3 19.8 0 3.3 19.8<br />
Provisions for group relief 114.7 14.2 0 7.2 121.7<br />
TOTAL PROVISIONS FOR CHARGES 114.7 14.2 0 7.2 121.7<br />
TOTAL 118.0 34 0 10.5 141.5<br />
(in € millions) 2008 Increases<br />
Reversals<br />
(unused) Utilisations 2009<br />
Provisions for claims <strong>and</strong> litigation 0 0<br />
Provisions for currency risks 7.3 3.3 7.3 3.3<br />
TOTAL PROVISIONS FOR CONTINGENCIES 7.3 3.3 0 7.3 3.3<br />
Provisions for group relief 97.1 18.6 1 114.7<br />
TOTAL PROVISIONS FOR CHARGES 97.1 18.6 0 1 114.7<br />
TOTAL 104.3 21.9 0.0 8.3 118.0<br />
4<br />
GROUPE SEB<br />
FINANCIAL REPORT AND REGISTRATION DOCUMENT <strong>2010</strong><br />
125
4 NOTES<br />
COMPANY FINANCIAL STATEMENTS<br />
TO THE COMPANY FINANCIAL STATEMENTS<br />
NOTE 6<br />
MATURITIES OF RECEIVABLES AND PAYABLES<br />
All receivables are due within one year, with the exception of an €8.8 million<br />
subordinated loan to <strong>Groupe</strong> SEB Iberica <strong>and</strong> a €2.5 million long-term loan<br />
to <strong>Groupe</strong> SEB Schweiz.<br />
All payables are due within one year, with the exception of:<br />
employee profit-sharing accounts of €2.8 million due in 2012, €5.4 million<br />
due in 2013, €8.6 million due in 2014 <strong>and</strong> €6.9 million due in 2015;<br />
the €10 million balance outst<strong>and</strong>ing at 31 December <strong>2010</strong> on the Calyon<br />
loan repayable in annual instalments of €10 million through to March 2012;<br />
the Schuldschein in-fine loan, repayable in two instalments in August 2013<br />
<strong>and</strong> August 2015 for €113.5 million <strong>and</strong> €47.5 million, respectively.<br />
Due<br />
(in € millions) 2009 <strong>2010</strong> within 1 year in 1 to 5 years beyond 5 years<br />
Bank borrowings 389.9 226 55 171<br />
Commercial paper 100 100 100<br />
Intra-group borrowings 291.5 371.2 371.2<br />
Other borrowings 0.3 0.3 0.3<br />
Non-discretionary profit sharing liability 25.9 28.6 3.2 25.4<br />
TOTAL 807.6 726.1 529.4 196.4 0.3<br />
A key source of fi nancing for the Group is its €600 million commercial<br />
paper programme, which has enjoyed an A2 rating from St<strong>and</strong>ard & Poor’s<br />
for several years. Outst<strong>and</strong>ing commercial paper under this programme<br />
totalled €100 million at the year-end. All commercial paper is due in less<br />
than three months.<br />
At 31 December <strong>2010</strong>, no borrowings were subject to acceleration clauses.<br />
Only two medium-long-term loans were subject to a debt-to-EBITDA<br />
ratio that could have an impact on the interest rate of the debt. Interest<br />
paid in <strong>2010</strong> was determined in the highest tranche provided for in the<br />
loan agreement. Shifting to a different tranche would enable the Group to<br />
reduce its interest payments. The amount of the saving would be less than<br />
€0.1 million.<br />
NOTE 7<br />
RELATED PARTY TRANSACTIONS<br />
Certain balance sheet items contain amounts concerning related party transactions, as follows:<br />
(in € millions) <strong>2010</strong> 2009<br />
Related parties Direct investments Related parties Direct investments<br />
Non-current financial assets 407 360.9 342.5 447.9<br />
Receivables 0.2 1.1 0.2 1.9<br />
Payables 107.9 265.2 108.5 190.7<br />
TOTAL 515.1 627.2 451.2 640.5<br />
126 FINANCIAL REPORT AND REGISTRATION DOCUMENT <strong>2010</strong> GROUPE SEB
4<br />
COMPANY FINANCIAL STATEMENTS<br />
NOTES TO THE COMPANY FINANCIAL STATEMENTS<br />
NOTE 8<br />
INCOME AND EXPENSES CONCERNING RELATED PARTIES<br />
(in € millions) <strong>2010</strong> 2009<br />
OPERATING EXPENSES<br />
Management fees 3.0 1.6<br />
OPERATING INCOME<br />
Royalties 0 0.2<br />
FINANCIAL EXPENSES<br />
Interest expense 0.9 1.2<br />
FINANCIAL INCOME<br />
Investment income 73.3 71.2<br />
Income from receivables 4.7 7.9<br />
NOTE 9<br />
PREPAID EXPENSES AND DEFERRED INCOME<br />
9.1. DEFERRED CHARGES<br />
(in € millions) <strong>2010</strong> 2009<br />
<strong>Financial</strong> expenses 1 1.4<br />
TOTAL 1 1.4<br />
9.2. PREPAID EXPENSES<br />
(in € millions) <strong>2010</strong> 2009<br />
Operating expenses 0.3 0.1<br />
<strong>Financial</strong> expenses 0.1<br />
TOTAL 0.3 0.2<br />
9.3. DEFERRED INCOME<br />
4<br />
(in € millions) <strong>2010</strong> 2009<br />
Loans to subsidiaries <strong>and</strong> affiliates 1.3 1.1<br />
Trade receivables 0.1 0.1<br />
Interest on VAT credits <strong>and</strong> swaps 0 0<br />
Cash equivalents 0 0<br />
TOTAL 1.4 1.2<br />
GROUPE SEB<br />
FINANCIAL REPORT AND REGISTRATION DOCUMENT <strong>2010</strong><br />
127
4 NOTES<br />
COMPANY FINANCIAL STATEMENTS<br />
TO THE COMPANY FINANCIAL STATEMENTS<br />
9.4. ACCRUED EXPENSES<br />
(in € millions) <strong>2010</strong> 2009<br />
Bank borrowings 3.1 4.1<br />
Other borrowings 0.5 0.2<br />
Trade payables 0.5 0.2<br />
Accrued taxes <strong>and</strong> payroll costs 2.4 2.2<br />
Other payables 0.3 0.4<br />
TOTAL 6.8 5.4<br />
NOTE 10<br />
OTHER INCOME AND EXPENSE, NET<br />
(in € millions) <strong>2010</strong> 2009<br />
Group relief 0 1<br />
Provisions for group relief to be transferred to subsidiaries (6.9) (18.6)<br />
Gains <strong>and</strong> (losses) on sales of own shares (13.7) (3.8)<br />
Other 0.4 (0.1)<br />
Exceptional expense transfer 10.3 0<br />
TOTAL (9.9) (21.5)<br />
A total of 1,433,074 SEB S.A. shares were sold during the year, generating<br />
a net loss of €13.7 million. Of this amount, €10.3 million was billed back to<br />
the French subsidiaries (exceptional expense transfer).<br />
Group relief is discussed in Note 11 <strong>and</strong> provisions for contingencies in<br />
Note 5.<br />
NOTE 11<br />
GROUP RELIEF<br />
Under group relief rules, tax savings resulting from tax losses incurred by<br />
companies in the tax group are initially recognised by SEB S.A. <strong>and</strong> are<br />
transferred back to the companies concerned when they return to profit.<br />
The tax expense reported in <strong>2010</strong> corresponded to the difference between:<br />
the tax group’s income tax benefit of €14 million, as follows:<br />
€2.1 million in definitively acquired tax savings,<br />
a benefit of €18.9 million resulting from losses arising during the year,<br />
an expense of €7.2 million resulting from the use of tax loss<br />
carryforwards; <strong>and</strong><br />
an expense of €28.8 million resulting from a correction to prior year<br />
results (2008 group relief).<br />
To neutralise the effects of group relief, a provision is recorded under “Other<br />
expenses” to cover the tax loss carryforwards generated by members of<br />
the tax group other than SEB S.A. The provisions are reversed to “Other<br />
income” when the tax loss carryforwards are utilised. Movements during<br />
the year were as follows:<br />
a €14.2 million addition to provisions for losses of subsidiaries other than<br />
SEB S.A. arising during the year;<br />
a €7.2 million reversal in respect of losses utilised.<br />
128 FINANCIAL REPORT AND REGISTRATION DOCUMENT <strong>2010</strong> GROUPE SEB
4<br />
COMPANY FINANCIAL STATEMENTS<br />
NOTES TO THE COMPANY FINANCIAL STATEMENTS<br />
NOTE 12<br />
INCOME TAX ANALYSIS<br />
Income tax for <strong>2010</strong> can be analysed as follows:<br />
(in € millions) Before tax Tax expense/(benefit) After tax<br />
Profit from ordinary activities 70.5 (4.9) 65.6<br />
Net other income/(expense) (10) 0.1 (9.9)<br />
Tax loss carryforwards generated (utilised) (4.8) (4.8)<br />
Group relief (14.8) (14.8)<br />
TOTAL 60.5 (14.8) 45.7<br />
The €14.8 million expense comprises the tax group’s income tax benefit of €14 million less a €28.8 million expense arising from a correction to prior year results.<br />
NOTE 13<br />
OFF-BALANCE SHEET COMMITMENTS<br />
(in € millions)<br />
MARKET CONTRACTS<br />
31 December <strong>2010</strong> 31 December 2009<br />
Notional amount Market value Notional amount Market value<br />
Currency swaps (foreign currency borrower) 261.5 4.5 203.2 (3.4)<br />
Currency swaps (foreign currency lender) 0 0 13.6 0<br />
Forward sales of foreign currencies 111.2 3.8 186.0 (0.9)<br />
Forward purchases of foreign currencies 66.9 (1.6) 20.5 0.7<br />
Interest rate swaps 20 (0.2) 30.0 (0.6)<br />
Aluminium derivatives 34,000 1,800 45.0 (6.5)<br />
Nickel derivatives 3,800 900 3.6 0.8<br />
CONTRACTS WITH SUBSIDIARIES<br />
Currency swaps (foreign currency lender) 6.9 0.1 9.7 0<br />
Forward purchases of foreign currencies 7.5 0.1 19.8 (0.1)<br />
Aluminium derivatives 34,000 1,800 45.0 6.5<br />
Nickel derivatives 3,800 900 3.6 (0.8)<br />
The use <strong>and</strong> accounting treatment of financial instruments are discussed<br />
in Note 1.5.<br />
The market value of financial instruments represents the gain or loss<br />
that would be recognised if the contracts were settled on the market on<br />
31 December <strong>2010</strong>. It is estimated based on the exchange rate <strong>and</strong> interest<br />
rate on 31 December <strong>2010</strong> or obtained from the counterparty banks.<br />
Notional amounts represent the notional amounts of the contracts.<br />
4<br />
GROUPE SEB<br />
FINANCIAL REPORT AND REGISTRATION DOCUMENT <strong>2010</strong><br />
129
4 NOTES<br />
COMPANY FINANCIAL STATEMENTS<br />
TO THE COMPANY FINANCIAL STATEMENTS<br />
NOTE 14<br />
PENSION AND OTHER POST-EMPLOYMENT BENEFIT OBLIGATIONS<br />
Thierry de La Tour d’Artaise participates in the top-hat pension scheme for<br />
French members of the Group Executive <strong>and</strong> Management Committees.<br />
This scheme is in addition to the statutory pension plans <strong>and</strong> comprises a<br />
defined contribution plan (known as the “Article 83” plan) supplemented by<br />
a defined benefit plan:<br />
a top-hat plan, subject to seniority conditions <strong>and</strong> provided the executive<br />
is still with the Company. It is designed to ensure a total replacement rate<br />
in addition to the statutory plans by providing up to 25% of the reference<br />
compensation, calculated as the average of the target compensation for<br />
the final three years;<br />
a supplementary benefi t plan, also subject to seniority conditions <strong>and</strong><br />
provided the executive is still with the Company. Its entitlements vest<br />
at an annual rate of 0.8% of the reference compensation, calculated as<br />
the average of the target compensation for the fi nal three years. The<br />
plan is capped at a maximum of 20 years, i.e. 16% of the reference<br />
compensation.<br />
To qualify for the defined benefit plan, Group executives must have been a<br />
member of the Executive or Management Committee for at least eight years.<br />
The scheme is capped at 41% of the reference compensation (including<br />
pensions paid under statutory plans).<br />
On 19 March <strong>2010</strong>, the Board of Directors decided to cap the reference<br />
compensation that serves as the basis for calculation to 36 times the annual<br />
Social Security ceiling on the date of retirement.<br />
The Group’s objective is to fund the entire benefi t obligation by making<br />
regular top-up contributions to an external fund. Payments have been made<br />
to the fund since 2008.<br />
TERMINATION BENEFITS<br />
Thierry de La Tour d’Artaise will not be entitled to any compensation for loss<br />
of office when he ceases to be a corporate officer.<br />
His employment contract, signed when he joined the Group in 1994 <strong>and</strong> last<br />
amended when he was appointed Chief Executive Officer, was suspended<br />
on 1 March 2005 for the duration of his term as corporate officer.<br />
In the same way as for other Executive Committee members, the contract<br />
stipulates that in the event of termination of his employment contract at<br />
<strong>Groupe</strong> SEB’s initiative, except as a result of gross negligence or serious<br />
misconduct, or at his own initiative following a change of control of <strong>Groupe</strong><br />
SEB, Thierry de La Tour d’Artaise will be eligible for a total termination benefit<br />
equal to two years’ remuneration. Following adoption of France’s TEPA Act,<br />
an addendum to this contract was signed making the termination benefit<br />
subject to performance conditions. The revised contract stipulates that the<br />
termination benefit, set at a maximum of two years’ gross salary <strong>and</strong> bonus,<br />
will be adjusted based on actual performance in relation to targets over<br />
Thierry de La Tour d’Artaise’s last four years of service, as follows:<br />
if average actual performance falls short of the targets by 50% or more,<br />
no termination benefit will be paid;<br />
if average actual performance represents 50% to 100% of the targets,<br />
between 75% <strong>and</strong> 100% of the termination benefit will be paid;<br />
if average actual performance exceeds the targets, the termination benefit<br />
will be paid in full.<br />
The Board of Directors may, at its discretion, reduce the termination benefit<br />
by as much as 50% if the Group reports a loss for the year preceding the<br />
one in which Thierry de La Tour d’Artaise is removed from office, provided<br />
that the termination benefi t does not represent less than his salary <strong>and</strong><br />
bonus for his final year of service if average actual performance is at least<br />
equal to 50% of targets.<br />
His employment contract does not contain any no-compete clause.<br />
Thierry de La Tour d’Artaise was re-appointed on 13 May 2008. In accordance<br />
with the October 2008 AFEP-MEDEF Code, the Board of Directors therefore<br />
decided to review the situation in 2012, when his term of office is due to expire.<br />
NOTE 15<br />
UNRECOGNISED DEFERRED TAXES<br />
At 31 December <strong>2010</strong>, the Company had an unrecognised deferred tax asset of €1.4 million (€0.9 million at 31 December 2009), corresponding to nondeductible<br />
provision charges <strong>and</strong> unrealised exchange gains deductible in the following year.<br />
130 FINANCIAL REPORT AND REGISTRATION DOCUMENT <strong>2010</strong> GROUPE SEB
4<br />
COMPANY FINANCIAL STATEMENTS<br />
NOTES TO THE COMPANY FINANCIAL STATEMENTS<br />
NOTE 16<br />
STOCK OPTION PLANS<br />
Information about stock option plans at 31 December <strong>2010</strong> is provided below:<br />
At 31 December <strong>2010</strong><br />
Type of option<br />
Option grant<br />
date***<br />
Option<br />
exercise date<br />
Number of options**<br />
Option<br />
expiry date Granted Exercised Cancelled Outst<strong>and</strong>ing<br />
Exercise<br />
price** (in €)<br />
Existing shares 19/04/2002 19/04/2006 19/04/<strong>2010</strong> 417,450 396,000 21,450 0 27.88<br />
Existing shares 17/10/2002 17/10/2006 17/10/<strong>2010</strong> 598,125 488,895 109,230 0 25.15<br />
Existing shares 18/06/2003 18/06/2007 18/06/2011 612,150 544,824 27,730 39,596 24.24<br />
Existing shares 18/06/2004 18/06/2008 18/06/2012 539,100 308,104 17,400 213,596 31.67<br />
Existing shares 08/04/2005 08/04/2009 08/04/2013 554,700 376,267 20,100 158,333 28.00<br />
Existing shares 16/06/2006 16/06/<strong>2010</strong> 16/06/2014 589,798 294,594 14,707 280,497 29.33<br />
Existing shares 20/04/2007 20/04/2011 20/04/2015 579,150 0 8,100 571,050 44.00<br />
Existing shares 13/05/2008 13/05/2012 13/05/2016 1,005,900 0 17,700 988,200 38.35<br />
Existing shares 12/06/2009 12/06/2013 12/06/2017 371,300 0 1,050 370,250 28.05<br />
Existing shares 18/06/<strong>2010</strong> 18/06/2014 18/06/2018 412,592 0 0 412,592 53.86<br />
TOTAL* 5,680,265 2,408,684 237,467 3,034,114<br />
* Of which, movements in <strong>2010</strong> 412,592 1,153,549 36,452 (777,409)<br />
Total options to purchase existing shares 5,680,265 2,408,684 237,467 3,034,114<br />
Total options to purchase new shares 0 0 0 0<br />
** The number of options <strong>and</strong> the exercise price for plans prior to 16 June 2008 were adjusted following the three-for-one stock split that took place on 16 June 2008.<br />
*** The grant date corresponds to the date of the Board Meeting when the option grants were decided.<br />
4<br />
GROUPE SEB<br />
FINANCIAL REPORT AND REGISTRATION DOCUMENT <strong>2010</strong><br />
131
4 NOTES<br />
COMPANY FINANCIAL STATEMENTS<br />
TO THE COMPANY FINANCIAL STATEMENTS<br />
NOTE 17<br />
EQUITY<br />
Share capital<br />
At 31 December <strong>2010</strong>, the share capital amounted to €50 million made up of 49,951,826 shares with a par value of €1.00, representing 73,718,840 voting<br />
rights (excluding own shares).<br />
Changes in shareholders’ equity (in € millions)<br />
SHAREHOLDERS’ EQUITY AT 31 DECEMBER 2009 BEFORE APPROPRIATION OF PROFIT 825.2<br />
2009 dividend paid in <strong>2010</strong> (51.2)<br />
Net profit for the year 45.7<br />
Changes in share capital – shares issued on exercise of stock options <strong>and</strong> share cancellations 0<br />
Corresponding issue premium 0<br />
SHAREHOLDERS’ EQUITY AT 31 DECEMBER <strong>2010</strong> 819.7<br />
SHAREHOLDERS’ EQUITY AT 31 DECEMBER 2008 BEFORE APPROPRIATION OF PROFIT 815.0<br />
2008 dividend paid in 2009 (45.4)<br />
Net profit for the year 74.1<br />
Changes in share capital – shares issued on exercise of stock options <strong>and</strong> share cancellations (1.0)<br />
Corresponding issue premium (17.5)<br />
SHAREHOLDERS’ EQUITY AT 31 DECEMBER 2009 825.2<br />
Potential ordinary shares at 31 December <strong>2010</strong><br />
There are no convertible bonds or equity notes outst<strong>and</strong>ing or securities not representing capital.<br />
NOTE 18<br />
EMPLOYEES<br />
The Company had one employee in <strong>2010</strong> <strong>and</strong> 2009.<br />
NOTE 19<br />
SUBSEQUENT EVENTS<br />
The unused €456.1 million syndicated loan due in 2011 was renegotiated with<br />
the banking pool, which comprises BNP Paribas, Citibank, Commerzbank,<br />
Crédit Agricole, HSBC, Natixis <strong>and</strong> Société Générale. The new loan has a<br />
nominal amount of €560 million <strong>and</strong> a five-year term.<br />
132 FINANCIAL REPORT AND REGISTRATION DOCUMENT <strong>2010</strong> GROUPE SEB
4<br />
COMPANY FINANCIAL STATEMENTS<br />
AUDITORS’ REPORT ON THE COMPANY FINANCIAL STATEMENTS<br />
AUDITORS’ REPORT<br />
ON THE COMPANY FINANCIAL STATEMENTS<br />
YEAR ENDED 31 DECEMBER <strong>2010</strong><br />
To the shareholders,<br />
In accordance with our appointment as Statutory auditors at your Annual<br />
General Meeting, we hereby report to you for the year ended 31 December<br />
<strong>2010</strong> on:<br />
the audit of the accompanying financial statements of SEB S.A.;<br />
the justification of our assessments;<br />
the specific verifications <strong>and</strong> disclosures required by law.<br />
The fi nancial statements have been approved by the Board of Directors.<br />
Our role is to express an opinion on these financial statements, based on<br />
our audit.<br />
I. OPINION ON THE FINANCIAL STATEMENTS<br />
We conducted our audit in accordance with professional st<strong>and</strong>ards applicable<br />
in France. These st<strong>and</strong>ards require that we plan <strong>and</strong> perform the audit to<br />
obtain reasonable assurance about whether the financial statements are free<br />
of material misstatement. An audit includes examining, using sample testing<br />
techniques or other selection methods, evidence supporting the amounts<br />
<strong>and</strong> disclosures in the financial statements. An audit also includes assessing<br />
the accounting principles used <strong>and</strong> significant estimates made, as well as<br />
evaluating the overall financial statement presentation. We believe that the<br />
audit evidence we have obtained is sufficient <strong>and</strong> appropriate to provide a<br />
reasonable basis for our opinion.<br />
In our opinion, the financial statements give a true <strong>and</strong> fair view of the financial<br />
position <strong>and</strong> the assets <strong>and</strong> liabilities of the Company as of 31 December<br />
<strong>2010</strong> <strong>and</strong> the results of its operations for the year then ended in accordance<br />
with accounting principles generally accepted in France.<br />
II.<br />
JUSTIFICATION OF OUR ASSESSMENTS<br />
Pursuant to the requirements of Article L. 823-9 of the French Commercial<br />
Code (Code de CommerceCode de Commerce) on the justification of our<br />
assessments, we draw your attention to the following matter:<br />
As indicated in Note 1.3 to the financial statements, the Company records<br />
provisions for impairment of its equity investments when their carrying value<br />
falls below their historical cost. Provisions are determined based on the<br />
share of equity held, the market value of the securities, when it can be<br />
known <strong>and</strong> the medium <strong>and</strong> long-term profi tability outlook of the equity<br />
investments concerned. Our procedures consisted in assessing the data<br />
<strong>and</strong> assumptions on which such provisions are based <strong>and</strong> verifying the<br />
Company’s calculations.<br />
These assessments were made as part of our audit of the financial statements<br />
taken as a whole, <strong>and</strong> therefore contributed to the opinion expressed in the<br />
first part of this report.<br />
4<br />
GROUPE SEB<br />
FINANCIAL REPORT AND REGISTRATION DOCUMENT <strong>2010</strong><br />
133
4 AUDITORS’<br />
COMPANY FINANCIAL STATEMENTS<br />
REPORT ON THE COMPANY FINANCIAL STATEMENTS<br />
III.<br />
SPECIFIC VERIFICATIONS AND DISCLOSURES<br />
We have also performed the other procedures required by law, in accordance<br />
with professional practice st<strong>and</strong>ards applicable in France.<br />
We have no matters to report regarding the fair presentation <strong>and</strong> consistency<br />
with the financial statements of the information given in the management<br />
report of the Board of Directors <strong>and</strong> the documents addressed to the<br />
shareholders in respect of the financial position <strong>and</strong> the financial statements.<br />
Concerning the information given in accordance with the requirements of<br />
Article L. 225-102-1 of the French Commercial Code (Code de Commerce)<br />
relating to remunerations <strong>and</strong> benefits received by the corporate offi cers<br />
<strong>and</strong> any other commitments made in their favor, we have verified its<br />
consistency with the financial statements, or with the underlying information<br />
used to prepare these financial statements <strong>and</strong>, where applicable, with the<br />
information obtained by your Company from companies controlling your<br />
Company or controlled by it. Based on this work, we attest to the accuracy<br />
<strong>and</strong> fair presentation of this information.<br />
Pursuant to the law, we have verified that the management report contains<br />
the appropriate disclosures as to the identity of <strong>and</strong> percentage interests<br />
<strong>and</strong> votes held by shareholders.<br />
PricewaterhouseCoopers Audit<br />
Bernard RASCLE<br />
Lyon <strong>and</strong> Villeurbanne, 21 March 2011<br />
The Statutory Auditors<br />
Deloitte & Associés<br />
Dominique VALETTE<br />
This is a free translation into English of the Statutory Auditors’ report issued in French <strong>and</strong> is provided solely for the convenience of English speaking users. The<br />
Statutory Auditors’ report includes information specifically required by French law in such reports, whether modified or not. This information is presented below<br />
the opinion on the Company financial statements <strong>and</strong> includes an explanatory paragraph discussing the Auditors’ assessments of certain significant accounting<br />
<strong>and</strong> auditing matters. These assessments were considered for the purpose of issuing an audit opinion on the Company financial statements taken as a whole <strong>and</strong><br />
not to provide separate assurance on individual account captions or on information taken outside of the Company financial statements.<br />
This report should be read in conjunction <strong>and</strong> construed in accordance with French law <strong>and</strong> professional auditing st<strong>and</strong>ards applicable in France.<br />
134 FINANCIAL REPORT AND REGISTRATION DOCUMENT <strong>2010</strong> GROUPE SEB
ANNUAL GENERAL MEETING<br />
5<br />
ANNUAL<br />
GENERAL MEETING<br />
REPORT OF THE BOARD OF DIRECTORS<br />
ON THE RESOLUTIONS PROPOSED<br />
TO THE ANNUAL GENERAL MEETING<br />
OF 17 MAY 2011 136<br />
Trading in the Company’s shares 136<br />
Dividends 136<br />
Agreement governed by Article L. 225-42-1<br />
of the French Commercial Code 137<br />
Board of Directors 137<br />
Directors’ fees 137<br />
Stock options – performance shares 137<br />
<strong>Financial</strong> authorisations 138<br />
Employee share issue 138<br />
AUDITORS’ SPECIAL REPORT<br />
ON REGULATED AGREEMENTS<br />
AND COMMITMENTS<br />
WITH THIRD PARTIES 139<br />
Agreements <strong>and</strong> commitments submitted<br />
to the approval of the Shareholders’ Meeting 139<br />
Agreements <strong>and</strong> commitments already<br />
approved by the Shareholders’ Meeting 139<br />
PROPOSED RESOLUTIONS 141<br />
Ordinary resolutions 141<br />
Extraordinary resolutions 143<br />
5<br />
GROUPE SEB<br />
FINANCIAL REPORT AND REGISTRATION DOCUMENT <strong>2010</strong><br />
135
5 REPORT<br />
ANNUAL GENERAL MEETING<br />
OF THE BOARD OF DIRECTORS ON THE RESOLUTIONS PROPOSED TO THE ANNUAL GENERAL MEETING OF 17 MAY 2011<br />
REPORT OF THE BOARD OF DIRECTORS<br />
ON THE RESOLUTIONS PROPOSED<br />
TO THE ANNUAL GENERAL MEETING<br />
OF 17 MAY 2011<br />
TRADING IN THE COMPANY’S SHARES<br />
At 31 December <strong>2010</strong>, the Company held 1,980,698 of its own shares with a<br />
par value of €1.00, for an aggregate par value of €61,673,599. These shares<br />
represented 3.97% of the Company’s issued capital at that date.<br />
In <strong>2010</strong>, no shares were bought back by your Company under its existing<br />
share buyback programme. A total of 1,153,549 shares were sold during the<br />
year on the exercise of stock options, at an average price of €28.33 per share.<br />
On 20 September 2005, the Company signed a liquidity contract with the<br />
Gilbert Dupont stockbroking fi rm. The contract complies with the Ethical<br />
Charter issued by the French association of investment firms (AFEI), which<br />
was approved by the French securities regulator (Autorité des Marchés<br />
Financiers) on 22 March 2005.<br />
During <strong>2010</strong>, 264,329 SEB S.A. shares were purchased <strong>and</strong> 279,525 shares<br />
were sold under this contract. The transaction costs amounted to €30,764.<br />
Shareholders are asked to authorise the Company to trade in its own shares<br />
in compliance with the new European regulations. Under the terms of the<br />
resolution, the Company would be authorised to buy back the maximum<br />
shares allowed by law in order to:<br />
maintain a liquid market for the Company’s shares through an investment<br />
service provider acting on a fully independent basis;<br />
purchase shares for allocation to eligible employees <strong>and</strong> officers of the<br />
Company;<br />
purchase shares for cancellation, in order to increase return on equity <strong>and</strong><br />
earnings per share or to offset the dilutive impact of any capital increases<br />
on existing shareholders’ interests;<br />
purchase shares for delivery or exchange in connection with any future<br />
external growth transactions;<br />
purchase shares for allocation on exercise of rights attached to securities<br />
that are convertible, exercisable, redeemable or otherwise exchangeable<br />
for Company shares.<br />
The purchase price per share would be capped at €130, <strong>and</strong> the amount<br />
invested in the buyback program would therefore not exceed €649,373,660.<br />
DIVIDENDS<br />
We recommend raising the dividend to €1.17 per share, representing a 12.5%<br />
increase.<br />
For the sixteenth year running, shareholders will be entitled to a<br />
supplementary dividend, amounting to 10% of the ordinary dividend, on all<br />
shares registered in their name prior to 31 December 2008 <strong>and</strong> still held in<br />
their portfolio on the ex-dividend date (19 May 2011). These shares represent<br />
more than 53% of the outst<strong>and</strong>ing total.<br />
No single shareholder will be entitled to the supplementary dividend on any<br />
shares in excess of 0.5% of the Company’s issued capital.<br />
The dividend will be paid as from 24 May 2011.<br />
Under the new tax rules applicable since 1 January 2005, the dividend will<br />
not give rise to any avoir fiscal tax credit.<br />
136 FINANCIAL REPORT AND REGISTRATION DOCUMENT <strong>2010</strong> GROUPE SEB
5<br />
ANNUAL GENERAL MEETING<br />
REPORT OF THE BOARD OF DIRECTORS ON THE RESOLUTIONS PROPOSED TO THE ANNUAL GENERAL MEETING OF 17 MAY 2011<br />
AGREEMENT GOVERNED BY ARTICLE L. 225-42-1 OF THE FRENCH<br />
COMMERCIAL CODE<br />
Shareholders are invited to note that no related party agreements were signed in <strong>2010</strong>, as observed in the Auditors’ special report on related party agreements.<br />
BOARD OF DIRECTORS<br />
The terms as director of Hubert Fèvre, Jacques Gairard <strong>and</strong> Cédric<br />
Lescure, three members of the Founding Group, will expire at this General<br />
Meeting <strong>and</strong> shareholders will be asked to re-elect them for a further<br />
four-year term.<br />
Mr. Fèvre, 46, is in charge of finance at the Banque Pasche Geneva after<br />
having served in financial positions with different companies in London.<br />
Mr. Gairard, 71, joined <strong>Groupe</strong> SEB in 1967 <strong>and</strong> served as Chairman <strong>and</strong><br />
Chief Executive Officer from 1990 à 2000.<br />
Mr. Lescure, 43, is a veterinary surgeon.<br />
DIRECTORS’ FEES<br />
Directors fees have been set at an aggregate €420,000 since 2007. To reflect the presence of an additional member on the Audit Committee <strong>and</strong> on the<br />
Nominations <strong>and</strong> Remuneration Committee, shareholders will be asked to increase these fees to an aggregate €450,000.<br />
STOCK OPTIONS – PERFORMANCE SHARES<br />
In order to provide an on-going incentive to key Group employees by<br />
offering them an opportunity to share in the Group’s development <strong>and</strong><br />
results, shareholders will be asked to authorise the Board to grant stock<br />
options exercisable for a number of shares not representing more than<br />
1.3% of the Company’s capital, with a limit of 0.16% applicable to options<br />
granted under the plan to the executive officer. In line with the AFEP-MEDEF<br />
recommendations, a certain proportion of the options granted to the<br />
executive offi cer <strong>and</strong> to Executive Committee members will be subject<br />
to performance obligations related to growth in the Group’s revenue <strong>and</strong><br />
operating margin.<br />
Shareholders will also be asked to authorise the Board to make stock<br />
grants representing up to 0.325% of the Company’s share capital, in the<br />
form of existing shares bought back for this purpose by the Company. The<br />
grants would be made to all or some employees of the Company <strong>and</strong> its<br />
subsidiaries, to certain categories of those employees <strong>and</strong>/or to officers as<br />
provided by Article L. 225-197-1 II of the French Commercial Code. All stock<br />
grants will be subject to the same performance obligations related to growth<br />
in the Group’s revenue <strong>and</strong> operating margin as stock options.<br />
The number of shares granted to the executive officer will not exceed 0.04%<br />
of the Company’s share capital. The stock grants would be subject to a<br />
two-year vesting period <strong>and</strong> a two-year lock-up.<br />
The limits of 1.3% of capital for stock options <strong>and</strong> 0.325% of capital for stock<br />
grants would not be cumulative, nor would the limits of 0.16% <strong>and</strong> 0.04%<br />
respectively on stock options <strong>and</strong> stock grants for the executive officer.<br />
For grantees resident outside France, in accordance with the law, the<br />
minimum vesting period would range from two to four years, with no lock-up<br />
period applying where the vesting period was four years.<br />
Shareholders will be asked to give the Board full powers to set the stock<br />
grant terms, particularly to draw up the list of grantees.<br />
5<br />
GROUPE SEB<br />
FINANCIAL REPORT AND REGISTRATION DOCUMENT <strong>2010</strong><br />
137
5 REPORT<br />
ANNUAL GENERAL MEETING<br />
OF THE BOARD OF DIRECTORS ON THE RESOLUTIONS PROPOSED TO THE ANNUAL GENERAL MEETING OF 17 MAY 2011<br />
FINANCIAL AUTHORISATIONS<br />
At the Annual General Meeting, we will ask shareholders to give the Board<br />
the necessary powers to issue shares <strong>and</strong> share equivalents, in order to<br />
enable us to raise financing to support our Group’s on-going development as<br />
<strong>and</strong> when required, based on opportunities arising in the financial markets.<br />
The aggregate par value of shares issued under the authorisation would be<br />
capped at €5 million for issues with pre-emptive subscription rights.<br />
In addition, to allow us to effi ciently take up any opportunities that may<br />
arise, we are also seeking an authorisation to issue hybrid securities without<br />
pre-emptive subscription rights. The aggregate par value of shares issued<br />
on conversion, exchange, redemption or exercise of these hybrid securities<br />
would also be capped at €5 million. At the Board’s discretion, shareholders<br />
could be given a priority right to subscribe each issue pro rata to their existing<br />
shareholdings, for a period <strong>and</strong> on terms to be decided by the Board.<br />
The aggregate nominal amount of any debt securities with stock rights issued<br />
under the authorisation would be capped at €150 million.<br />
If <strong>and</strong> when the authorisations are used, we will prepare an additional report<br />
describing the final terms of the issue, including the basis for setting the issue<br />
price, the impact of the issue on the situation of existing shareholders <strong>and</strong><br />
the estimated impact on the share price, as required by law.<br />
In a separate resolution, we are also seeking an authorisation to issue up to<br />
€10 million worth of bonus shares, to be paid up by capitalizing reserves,<br />
profits or additional paid-in capital.<br />
Lastly, we are recommending that the maximum aggregate amount of share<br />
issues that may be carried out under these authorisations with or without<br />
subscription rights be set at €10 million.<br />
All of these authorisations are being sought for a period of 14 months.<br />
EMPLOYEE SHARE ISSUE<br />
Under Article L. 225-129-6 of the French Commercial Code, we are required<br />
to submit to shareholders a proposal to authorise the Board to carry out<br />
issues of shares <strong>and</strong>/or share equivalents without pre-emptive subscription<br />
rights for existing shareholders, reserved for members of a corporate savings<br />
plan (Plan d’Épargne d’Entreprise). The total number of shares that would be<br />
issued under this authorisation would be capped at 1% of the Company’s<br />
share capital as at the close of this meeting. Any shares <strong>and</strong>/or share<br />
equivalents issued under this proposed resolution would not be deducted<br />
from the ceilings specified in the other financial authorisations granted by<br />
shareholders. In application of Articles 443-5 <strong>and</strong> 443-6 of the French Labour<br />
Code, shares issued directly or indirectly under this authorisation would be<br />
offered at a discount of up to 20%, or 30% if they were subject to a lock-up<br />
of ten years or more.<br />
This authorisation is being sought for a period of 14 months.<br />
138 FINANCIAL REPORT AND REGISTRATION DOCUMENT <strong>2010</strong> GROUPE SEB
5<br />
ANNUAL GENERAL MEETING<br />
AUDITORS’ SPECIAL REPORT ON REGULATED AGREEMENTS AND COMMITMENTS WITH THIRD PARTIES<br />
AUDITORS’ SPECIAL REPORT<br />
ON REGULATED AGREEMENTS<br />
AND COMMITMENTS WITH THIRD PARTIES<br />
SHAREHOLDERS’ MEETING HELD TO APPROVE<br />
THE FINANCIAL STATEMENTS FOR THE YEAR<br />
ENDED 31 DECEMBER <strong>2010</strong><br />
To the Shareholders,<br />
In accordance with our appointment as Statutory auditors by your<br />
Company, we hereby report on regulated agreements <strong>and</strong> commitments<br />
with third parties.<br />
The terms of our engagement require us to communicate to you, based<br />
on information provided to us, the principal terms <strong>and</strong> conditions of those<br />
agreements <strong>and</strong> commitments brought to our attention or which we may<br />
have discovered during the course of our audit, without expressing an<br />
opinion on their usefulness <strong>and</strong> appropriateness or identifying such other<br />
agreements, if any. It is your responsibility, pursuant to Article R. 225-31 of<br />
the French Commercial Code (Code de Commerce), to assess the interest<br />
involved in respect of the conclusion of these agreements for the purpose<br />
of approving them.<br />
Our role is also to provide you with the information provided for in<br />
Article R. 225-31 of the French Commercial Code in respect of the<br />
performance of the agreements <strong>and</strong> commitments, already approved by the<br />
Shareholders’ Meeting <strong>and</strong> having continuing effect during the year, if any.<br />
We conducted our procedures in accordance with the professional<br />
guidelines of the French National Institute of Statutory auditors (Compagnie<br />
Nationale des Commissaires aux Comptes) relating to this engagement.<br />
These guidelines require that we agree the information provided to us with<br />
the relevant source documents.<br />
AGREEMENTS AND COMMITMENTS SUBMITTED TO THE APPROVAL<br />
OF THE SHAREHOLDERS’ MEETING<br />
Pursuant to Article L. 225-38 of the French Commercial Code, we have not been advised of any agreement or commitment authorized during the year that<br />
was subject to the approval of the Shareholders’ Meeting.<br />
AGREEMENTS AND COMMITMENTS ALREADY APPROVED<br />
BY THE SHAREHOLDERS’ MEETING<br />
Pursuant to Article R. 225-30 of the French Commercial Code, we have been<br />
advised that the following agreements <strong>and</strong> commitments already approved<br />
in previous years by the Shareholders’ Meeting have had continuing effect<br />
during the year.<br />
With Mr. Thierry de La Tour d’Artaise<br />
1. Nature <strong>and</strong> purpose: The employment contract of Mr. Thierry de La Tour<br />
d’Artaise, Chairman of SEB S.A., it being understood that such contract<br />
has been suspended for the duration of his term of office as corporate<br />
officer.<br />
Terms <strong>and</strong> conditions:<br />
In the event such employment contract is terminated at the employer’s<br />
initiative, except on grounds of serious misconduct or gross negligence,<br />
or at Mr. Thierry de La Tour d’Artaise’s initiative as a result of a change<br />
in the control of the SEB Group, his overall termination benefi ts shall<br />
be equivalent to two years’ compensation, payable subject to the<br />
performance criteria described in the agreement below.<br />
In the event Mr. Thierry de La Tour d’Artaise’s employment contract is<br />
terminated except for serious misconduct or gross negligence, he will<br />
be entitled to all the share purchase or subscription options granted to<br />
him under the same exercise terms <strong>and</strong> conditions had he remained in<br />
office. This provision shall also apply in the event Mr. Thierry de La Tour<br />
d’Artaise’s employment contract is terminated pursuant to his resignation<br />
from the Group, were such resignation to arise from a change in the control<br />
of the Group. However, he shall forfeit the options that will have been<br />
granted to him over the 18 months prior to the termination of his term of<br />
office as corporate officer.<br />
2. Nature <strong>and</strong> purpose: Determination of the performance criteria governing<br />
the Chairman’s termination benefits.<br />
Terms <strong>and</strong> conditions: The Chairman’s termination benefi ts, equivalent<br />
to two years’ earned compensation plus bonuses, are adjusted for the<br />
percentage of objectives achieved over the 4 previous year-ends:<br />
if the average percentage achieved is below 50%, no termination benefits<br />
shall be paid;<br />
5<br />
GROUPE SEB<br />
FINANCIAL REPORT AND REGISTRATION DOCUMENT <strong>2010</strong><br />
139
5 AUDITORS’<br />
ANNUAL GENERAL MEETING<br />
SPECIAL REPORT ON REGULATED AGREEMENTS AND COMMITMENTS WITH THIRD PARTIES<br />
if the average percentage achieved is between 50% <strong>and</strong> 100%, termination<br />
benefits shall range from 75% to 100% of the base used for calculation,<br />
determined on a straight-line basis;<br />
if the average percentage achieved is higher than 100%, termination<br />
benefits shall equal 100% of the base used for calculation.<br />
The Board of Directors retains the right to reduce, by a maximum of one-half,<br />
such termination benefits if the previous year-end net result is a net loss,<br />
without such benefits falling below the fixed compensation plus bonuses<br />
of the previous year-end, if applying the performance criteria based on<br />
achieving the objectives entitles Mr. Thierry de La Tour d’Artaise to receive<br />
termination benefits.<br />
3. Nature <strong>and</strong> purpose: Individual life insurance plan in favor of Mr. Thierry<br />
de La Tour d’Artaise, Chairman of SEB S.A..<br />
Terms <strong>and</strong> conditions: In addition to senior management’s Group death,<br />
disability <strong>and</strong> related benefit insurance plan, Mr. Thierry de La Tour d’Artaise<br />
is the beneficiary of an individual life insurance policy with a capital totaling<br />
€3,512,830. The expense recorded over the year ended 31 December <strong>2010</strong><br />
totals €40,875.<br />
4. Nature <strong>and</strong> purpose: Supplementary <strong>and</strong> top-up retirement plan.<br />
Terms <strong>and</strong> conditions: As all other members of the Executive <strong>and</strong><br />
Management Committees, Mr. Thierry de La Tour d’Artaise is entitled to a<br />
supplementary <strong>and</strong> top-up retirement plan guaranteeing annuities equivalent<br />
to a 41% compensation replacement rate, including the benefits of statutory<br />
retirement plans. The reference salary, which is used as the basis for<br />
calculating the retirement benefits, is limited to 36 times the French Social<br />
Security ceiling prevailing at the date of calculation. Guaranteed payment<br />
is subject to the following conditions:<br />
Mr. Thierry de La Tour d’Artaise must be at least 60 years of age, having<br />
defi nitively stopped working <strong>and</strong> having obtained the calculation of the<br />
supplementary <strong>and</strong> m<strong>and</strong>atory AGIRC <strong>and</strong> ARCCO (management) retirement<br />
entitlements.<br />
Mr. Thierry de La Tour d’Artaise shall only receive the guaranteed rate upon<br />
leaving the Group to claim his retirement benefi ts. However, he shall be<br />
entitled to benefits in the event his employment contract is terminated after<br />
he is 55, if he subsequently stops working.<br />
Mr. Thierry de La Tour d’Artaise must have sat on the Executive or the<br />
Management Committee for 8 years. The maximum duration of the vesting<br />
period is 20 years.<br />
The supplementary <strong>and</strong> top-up plan actuarial expenses relating to Mr. Thierry<br />
de La Tour d’Artaise <strong>and</strong> recorded in the financial statements of SEB S.A.<br />
for the year ended 31 December <strong>2010</strong> total €629,732 plus a €461,067<br />
amortization charge.<br />
PricewaterhouseCoopers Audit<br />
Bernard RASCLE<br />
Lyon <strong>and</strong> Villeurbanne, 21 March 2011<br />
The Statutory Auditors<br />
Deloitte & Associés<br />
Dominique VALETTE<br />
This is a free translation into English of the Statutory Auditors’ special report on regulated agreements <strong>and</strong> commitments with third parties that is issued in<br />
the French language <strong>and</strong> is provided solely for the convenience of English speaking readers. This report on regulated agreements <strong>and</strong> commitments should<br />
be read in conjunction <strong>and</strong> construed in accordance with French law <strong>and</strong> professional auditing st<strong>and</strong>ards applicable in France. It should be understood that<br />
the agreements reported on are only those provided by the French Commercial Code <strong>and</strong> that the report does not apply to those related party transactions<br />
described in IAS 24 or other equivalent accounting st<strong>and</strong>ards.<br />
140 FINANCIAL REPORT AND REGISTRATION DOCUMENT <strong>2010</strong> GROUPE SEB
5<br />
ANNUAL GENERAL MEETING<br />
PROPOSED RESOLUTIONS<br />
PROPOSED RESOLUTIONS<br />
Proposed resolutions submitted to the Annual General Meeting of May 17, 2011<br />
ORDINARY RESOLUTIONS<br />
FIRST RESOLUTION<br />
Approval of the Company financial statements<br />
The Annual General Meeting, having considered the reports of the Board of Directors, the Chairman <strong>and</strong> the Auditors on the Company’s operations <strong>and</strong> results<br />
for the year ended 31 December <strong>2010</strong>, approves the annual financial statements as presented, which show net profit of €45,722,543.07.<br />
SECOND RESOLUTION<br />
Appropriation of profit<br />
The Annual General Meeting resolves to appropriate net profit for the year as follows:<br />
Net profit 45,722,543.07<br />
Retained earnings 602,998,867.88<br />
Dividends on treasury stock credited to retained earnings 3,850,540.41<br />
Total available for distribution 652,571,951.36<br />
Ordinary dividend 58,443,636.42<br />
Supplementary dividend 3,167,485.19<br />
Retained earnings 590,960,829.75<br />
The dividend per share amounts to €1.17.<br />
The ex-dividend date will be 19 May 2011 <strong>and</strong> the dividend will be paid as<br />
from 24 May 2011.<br />
As provided for in Article 48 of the bylaws, a supplementary dividend of<br />
€0.117 per share, corresponding to 10% of the ordinary dividend, will be<br />
paid on shares registered in the name of the same holder throughout the<br />
period between 31 December 2008 <strong>and</strong> the ex-dividend date (19 May 2011).<br />
However, no single shareholder will be entitled to the supplementary dividend<br />
on any shares in excess of 0.5% of the Company’s capital.<br />
Dividends for the last three years were as follows:<br />
2009 2008 2007<br />
(in €)<br />
Ordinary dividend<br />
Supplementary<br />
dividend Ordinary dividend<br />
Supplementary<br />
dividend Ordinary dividend<br />
Supplementary<br />
dividend<br />
Dividend 1.04 0.104 0.94 0.094 0.93 0.093<br />
THIRD RESOLUTION<br />
Approval of the consolidated financial statements<br />
FOURTH RESOLUTION<br />
Related party agreements<br />
5<br />
The Annual General Meeting, having considered the reports of the Board of<br />
Directors <strong>and</strong> the Auditors, approves the consolidated financial statements<br />
for the year ended 31 December <strong>2010</strong>, which show net profit of €220,403,000.<br />
The Annual General Meeting, having considered the Auditors’ special report<br />
on agreements governed by Article L. 225-38 of the French Commercial<br />
Code, notes that no such agreements were entered into by the Company<br />
during <strong>2010</strong>.<br />
GROUPE SEB<br />
FINANCIAL REPORT AND REGISTRATION DOCUMENT <strong>2010</strong><br />
141
5 PROPOSED<br />
ANNUAL GENERAL MEETING<br />
RESOLUTIONS<br />
FIFTH RESOLUTION<br />
Re-election of Hubert Fèvre<br />
as director for four years<br />
The Annual General Meeting re-elects Hubert Fèvre as Director for a period<br />
of four years expiring at the close of the Annual General Meeting to be called<br />
to approve the 2014 financial statements.<br />
SIXTH RESOLUTION<br />
Re-election of Jacques Gairard<br />
as director for four years<br />
The Annual General Meeting re-elects Jacques Gairard as director for a<br />
period of four years expiring at the close of the Annual General Meeting to<br />
be called to approve the 2014 financial statements.<br />
SEVENTH RESOLUTION<br />
Re-election of Cédric Lescure<br />
as director for four years<br />
The Annual General Meeting re-elects Cédric Lescure as director for a period<br />
of four years expiring at the close of the Annual General Meeting to be called<br />
to approve the 2014 financial statements.<br />
EIGHTH RESOLUTION<br />
Directors’ fees<br />
The Annual General Meeting, having considered the Board of Directors’<br />
report, sets at €450,000 the total amount of directors’ fees to be allocated<br />
among the Board members for the year.<br />
NINTH RESOLUTION<br />
Authorisation to trade in the Company’s shares<br />
The Annual General Meeting, having considered the Board of Directors’<br />
report, resolves:<br />
to terminate the share buyback program authorised at the Annual General<br />
Meeting of 12 May <strong>2010</strong>;<br />
to adopt the program described below <strong>and</strong> accordingly:<br />
to authorise the Board of Directors, or any representative of the<br />
Board empowered to act on the Board’s behalf in accordance with<br />
Articles L. 225-209 et seq. of the French Commercial Code, to buy<br />
back shares of the Company in an amount representing up to 10% of<br />
the share capital, subject to the limits set down by law;<br />
that the shares may be bought back for the following purposes:<br />
to maintain a liquid market for the Company’s shares through an<br />
independent investment service provider under a liquidity contract<br />
that complies with the AFEI Code of ethics recognized by the Autorité<br />
des Marchés Financiers,<br />
to purchase shares for allocation to eligible employees <strong>and</strong> officers of the<br />
Company upon exercise of stock options governed by Articles 225-179<br />
et seq. of the Commercial Code, or in the form of stock grants governed<br />
by Articles 225-197-1 et seq. of the Commercial Code, or in payment<br />
of statutory employee profit-shares or in connection with an employee<br />
stock ownership or stock savings plan,<br />
to purchase shares for cancellation, in order to increase return on<br />
equity <strong>and</strong> earnings per share <strong>and</strong>/or to offset the dilutive impact of any<br />
capital increases on existing shareholders’ interests, provided that such<br />
cancellation is authorised by the Extraordinary Shareholders’ Meeting,<br />
to purchase shares, representing up to 5% of the capital, for delivery or<br />
exchange in connection with any future external growth transactions,<br />
to purchase shares for allocation on exercise of rights attached to<br />
securities that are convertible, exchangeable, redeemable or otherwise<br />
exercisable for Company shares, in accordance with the applicable<br />
securities regulations;<br />
that shares may not be bought back under this authorisation at a price of<br />
more than €130 per share, excluding trading fees;<br />
that the Board of Directors may adjust the above price, in the case of<br />
any change in the shares’ par value, any bonus share issue paid up by<br />
capitalizing reserves, any stock-split or reverse stock-split, any return of<br />
capital or capital reduction, any distribution or reserves or assets, or any<br />
other corporate action, to take into account the effect thereof on the share<br />
price. In this case, the price will be adjusted based on the ratio between<br />
the number of shares outst<strong>and</strong>ing before <strong>and</strong> after the corporate action;<br />
that the total amount invested in the share buyback program may not<br />
exceed €649,373,660;<br />
that the shares may be bought back by any appropriate method <strong>and</strong><br />
accordingly that all or part of the program may be implemented on<br />
the market or through block purchases – <strong>and</strong>, if appropriate, through<br />
over-the-counter sales – or by means of public buyback or exchange<br />
offers, or through the use of options <strong>and</strong> derivative instruments, other than<br />
written puts. The buybacks may be carried out at any time at the Board’s<br />
discretion, including while a public tender offer is in progress, subject<br />
to compliance with the applicable securities regulations. The shares<br />
purchased under this authorisation may be kept, sold or transferred by<br />
any method, including block sales, at any time including while a public<br />
tender offer is in progress;<br />
to give full powers to the Board of Directors, including the power of<br />
delegation, to:<br />
carry out the transactions <strong>and</strong> set the related terms <strong>and</strong> conditions,<br />
place any <strong>and</strong> all buy <strong>and</strong> sell orders, on or off-market,<br />
adjust the maximum purchase price of the shares to take into account<br />
the effect on the share price of any of the corporate actions referred<br />
to above,<br />
enter into any <strong>and</strong> all agreements for the keeping of a register of share<br />
purchases <strong>and</strong> sales or for any other purpose,<br />
fulfil any <strong>and</strong> all reporting obligations with the Autorité des Marchés<br />
Financiers <strong>and</strong> any other organizations,<br />
carry out any <strong>and</strong> all formalities;<br />
that this authorisation is given for a period expiring at the Annual General<br />
Meeting to be called to approve the fi nancial statements for the year<br />
ending 31 December 2011 or fourteen (14) months, whichever is shorter.<br />
142 FINANCIAL REPORT AND REGISTRATION DOCUMENT <strong>2010</strong> GROUPE SEB
5<br />
ANNUAL GENERAL MEETING<br />
PROPOSED RESOLUTIONS<br />
EXTRAORDINARY RESOLUTIONS<br />
TENTH RESOLUTION<br />
Authorisation to cancel shares<br />
The Extraordinary General Meeting, having considered the report of the<br />
Board of Directors <strong>and</strong> the Auditors’ special report:<br />
authorises the Board of Directors to cancel, through one or several<br />
transactions at its discretion, all or some of the shares currently held or<br />
that may be held in the future by the Company following share buybacks<br />
carried out pursuant to Article L. 225-209 of the French Commercial Code,<br />
provided that the number of shares cancelled in any 24-month period may<br />
not exceed 10% of the total shares outst<strong>and</strong>ing. The difference between<br />
the purchase price of the cancelled shares <strong>and</strong> their par value will be<br />
deducted from additional paid-in capital <strong>and</strong> retained earnings, with an<br />
amount corresponding to 10% of the capital reduction being deducted<br />
from the legal reserve;<br />
authorises the Board of Directors to place on record the capital<br />
reduction(s), amend the bylaws to reflect the new capital <strong>and</strong> carry out<br />
any <strong>and</strong> all necessary formalities;<br />
authorises the Board of Directors to delegate all necessary powers to<br />
permit the implementation of its decisions, subject to compliance with the<br />
laws <strong>and</strong> regulations in force when this authorisation is used;<br />
resolves that this authorisation may be used within a period of fourteen (14)<br />
months from the date of this meeting;<br />
resolves that this authorisation cancels <strong>and</strong> replaces the authorisation to<br />
the same effect given at the General Meeting of 12 May <strong>2010</strong>.<br />
ELEVENTH RESOLUTION<br />
Authorisation to grant stock options<br />
The Extraordinary General Meeting, having considered the reports of the<br />
Board of Directors <strong>and</strong> the Auditors, authorises the Board of Directors<br />
to grant options to purchase existing shares of the Company to certain<br />
employees <strong>and</strong> Executive Directors of the Company <strong>and</strong> its subsidiaries.<br />
The authorisation is given for a period of fourteen (14) months from the date<br />
of this meeting <strong>and</strong> may be used on one or several occasions during the<br />
period. The exercise price of the options may not be less than the average<br />
of the prices quoted for SEB shares over the twenty trading days preceding<br />
the date of grant of the options.<br />
The life of the options may not exceed ten years with a vesting period of<br />
at least four years <strong>and</strong> the total number of options granted may not be<br />
exercisable for a number of shares exceeding 1.3% of the Company’s current<br />
share capital.<br />
The number of options granted to the Executive Director may not exceed<br />
0.16% of the current share capital <strong>and</strong> part of these options will be subject<br />
to performance criteria based on revenue <strong>and</strong> operating margin targets.<br />
The limits of respectively 1.3% <strong>and</strong> 0.16% described in this resolution are not<br />
cumulative with the 0.325% <strong>and</strong> 0.04% ceilings set in the twelfth resolution.<br />
The meeting gives full powers to the Board of Directors to set the terms <strong>and</strong><br />
conditions of the stock option plan or plans.<br />
This authorisation cancels <strong>and</strong> replaces an earlier authorisation to the same<br />
effect given at the Extraordinary General Meeting of 12 May <strong>2010</strong>.<br />
TWELFTH RESOLUTION<br />
Authorisation to make performance-based<br />
stock grants<br />
the Extraordinary General Meeting, having considered the report of the<br />
Board of Directors <strong>and</strong> the Auditors’ special report:<br />
authorises the Board of Directors, in accordance with Articles<br />
L. 225-197-1 to L. 225-197-5 of the French Commercial Code, to make<br />
stock grants on one or more occasions, to employees of the Company or<br />
certain categories of employee <strong>and</strong>/or to the senior executives referred<br />
to in Article L. 225-197-1 II of the Commercial Code, <strong>and</strong> to employees<br />
<strong>and</strong> senior executives of companies or economic interest groupings<br />
related to the Company within the meaning of Article L. 225-197-2 of<br />
the Commercial Code;<br />
resolves that the total number of shares that may be granted shall not<br />
exceed 0.325% of the Company’s share capital on the grant date, with<br />
the number of shares granted to an executive offi cer not exceeding<br />
0.04%.<br />
The limits of respectively 0.325% <strong>and</strong> 0.04% described in this resolution<br />
are not cumulative with the 1.3% <strong>and</strong> 0.16% ceilings set in the eleventh<br />
resolution;<br />
the Extraordinary General Meeting authorises the Board of Directors<br />
to make the stock grants, within the limits set out in the preceding<br />
paragraph, using shares bought back by the Company in accordance<br />
with Articles L. 225-208 <strong>and</strong> L. 225-209 of the Commercial Code;<br />
the Extraordinary General Meeting resolves:<br />
A) in respect of stock grants made to grantees resident in France:<br />
to set a minimum vesting period of two years with effect from the date<br />
of grant by the Board of Directors during which the rights shall not be<br />
transferable pursuant to Article L. 225-197-3 of the Commercial Code.<br />
At the end of the vesting period, the rights shall be fully acquired by<br />
the grantee, provided that the performance criteria based on revenue<br />
<strong>and</strong> operating margin targets have been met,<br />
to set a lock-up period of two years with effect from the vesting date,<br />
during which the vested shares may not be sold. However, the shares<br />
shall be freely transferable in the event of the grantee’s death or second<br />
or third degree disability within the meaning of Article L. 341-4 of the<br />
French Social Security Code;<br />
B) in respect of stock grants made to grantees not resident in France:<br />
to set a minimum vesting period of between two <strong>and</strong> four years with<br />
effect from the date of grant by the Board of Directors, during which<br />
the rights shall not be transferable pursuant to Article L. 225-197-3<br />
of the Commercial Code. At the end of the vesting period, the rights<br />
shall be fully acquired by the grantee, provided that the performance<br />
criteria based on revenue <strong>and</strong> operating margin targets have been met,<br />
if the vesting period is set at four years, to waive the lock-up period<br />
such that the shares shall be freely transferable with effect from their<br />
vesting date in accordance with Article L. 225-197-1 paragraph 7 of<br />
the Commercial Code.<br />
5<br />
GROUPE SEB<br />
FINANCIAL REPORT AND REGISTRATION DOCUMENT <strong>2010</strong><br />
143
5 PROPOSED<br />
ANNUAL GENERAL MEETING<br />
RESOLUTIONS<br />
However, for stock grants made pursuant to both paragraphs A <strong>and</strong> B above,<br />
in the event of the grantee’s death, the shares shall vest immediately in the<br />
heirs should they so request no later than six months after the date of death.<br />
Furthermore, the shares shall vest immediately in the event of the grantee’s<br />
second or third degree disability within the meaning of Article L. 341-4 of<br />
the Social Security Code.<br />
The Extraordinary General Meeting gives full powers to the Board of<br />
Directors, within the limits set out above, to:<br />
draw up the list of grantees or decide the category/categories of<br />
grantees, provided that no stock grants may be made to employees<br />
or officers who individually hold over 3% of the capital <strong>and</strong> that the<br />
stock grants would not have the effect of raising the interest held by<br />
any employee or officer to above the 3% ceiling;<br />
determine the amounts <strong>and</strong> timing of the stock awards;<br />
set the criteria <strong>and</strong> any other conditions of eligibility for stock grants,<br />
including but not limited to years of service <strong>and</strong> continued employment<br />
by the Company throughout the vesting period;<br />
set the vesting period <strong>and</strong> lock-up period, within the limits specified<br />
above;<br />
record the shares in a registered share account opened in the name<br />
of their holder, with a lock-up clause specifying the duration of the<br />
lock-up period;<br />
if any corporate actions governed by Article L. 228-99, first paragraph,<br />
of the Commercial Code are carried out during the vesting period, take<br />
any <strong>and</strong> all appropriate measures to protect <strong>and</strong> adjust the rights of<br />
recipients of stock grants, on the basis prescribed in the third paragraph<br />
of said Article.<br />
In accordance with Articles L. 225-197-4 <strong>and</strong> L. 225-197-5 of the Commercial<br />
Code, the Board of Directors shall report to each Annual General Meeting<br />
on the transactions carried out under this authorisation.<br />
This authorisation is given for a period of fourteen (14) months.<br />
THIRTEENTH RESOLUTION<br />
Authorisation to issue shares <strong>and</strong> share equivalents<br />
with pre-emptive subscription rights<br />
The Extraordinary General Meeting, having considered the report of the<br />
Board of Directors <strong>and</strong> the Auditors’ special report, resolves, in accordance<br />
with Articles L. 225-129-2 <strong>and</strong> L. 228-91 of the French Commercial Code:<br />
to give the Board of Directors the necessary powers, if such decision<br />
is approved by 12 of the 15 members present or represented by proxy,<br />
to issue shares <strong>and</strong> securities convertible, exchangeable, redeemable<br />
or otherwise exercisable for shares, denominated in euros or in foreign<br />
currencies, in France or on the international market, <strong>and</strong> to determine<br />
the timing <strong>and</strong> amounts of said issues within the limits prescribed below;<br />
that the aggregate par value of the shares to be issued directly <strong>and</strong>/or<br />
on conversion, exchange, redemption or exercise of share equivalents<br />
pursuant to this authorisation may not exceed €5,000,000, not including<br />
the par value of any additional shares to be issued to protect the rights of<br />
holders of existing share equivalents pursuant to the law;<br />
that the aggregate nominal value of debt securities issued pursuant to<br />
this authorisation shall not exceed €150,000,000 or the equivalent of this<br />
amount in the case of issues denominated in foreign currencies;<br />
that shareholders will have a pre-emptive right to subscribe the shares<br />
<strong>and</strong>/or share equivalents issued under this authorisation, pro rata to<br />
their existing interest in the Company’s capital. In addition, the Board of<br />
Directors may grant shareholders a pre-emptive right to subscribe any<br />
shares <strong>and</strong>/or share equivalents not taken up by other shareholders. If<br />
the issue is oversubscribed, such additional pre-emptive right shall also<br />
be exercisable pro rata to the existing interest in the Company’s capital<br />
of the shareholders concerned.<br />
If the issue is not taken up in full by shareholders exercising their pre-emptive<br />
rights as described above, the Board of Directors may take one or other of<br />
the following courses of action, in the order of its choice:<br />
limit the amount of the issue to the subscriptions received provided<br />
that at least three-quarters of the issue is taken up,<br />
freely allocate the remaining shares or share equivalents,<br />
offer all or some of the remaining shares or share equivalents for<br />
subscription by the public;<br />
that warrants to subscribe for the Company’s shares may be offered for<br />
subscription on the above basis or allocated among holders of existing<br />
shares without consideration;<br />
that, having noted that this authorisation will automatically entail the waiver<br />
of shareholders’ pre-emptive right to subscribe the shares to be issued<br />
on conversion, exchange, redemption or exercise of share equivalents,<br />
decides that said pre-emptive right will be cancelled;<br />
that the amount to be received by the Company for each share issued<br />
directly or indirectly under this authorisation shall not represent less<br />
than the shares’ par value. In the case of shares issued on exercise of<br />
st<strong>and</strong>-alone warrants or other primary securities, the amount received by<br />
the Company shall be determined after taking into account the issue price<br />
of said warrants or other primary securities;<br />
that the Board of Directors shall have full powers to use this authorisation<br />
<strong>and</strong> to delegate such powers to the Chairman, subject to compliance<br />
with the law. In particular, the Board of Directors or the Chairman shall<br />
have full powers to set the date <strong>and</strong> terms of the issues, as well as the<br />
form <strong>and</strong> characteristics of the securities to be issued, the issue price<br />
<strong>and</strong> terms, the amount of each issue, the cum-rights date which may be<br />
set retrospectively, the terms of settlement of the subscription price <strong>and</strong>,<br />
if appropriate, the conditions under which the securities may be bought<br />
back on the open market or the conversion, exchange, redemption or<br />
exercise rights attached to the share equivalents may be suspended,<br />
provided that said rights are not suspended for more than three months,<br />
<strong>and</strong> the method by which the rights of holders of share equivalents will<br />
be protected pursuant to the applicable laws <strong>and</strong> regulations. The Board<br />
of Directors or the Chairman shall also have full powers to charge any<br />
<strong>and</strong> all amounts against the issue premium, including the issuance costs,<br />
<strong>and</strong> to take all necessary or appropriate measures <strong>and</strong> enter into any <strong>and</strong><br />
all agreements in connection with the placement of the issues, to place<br />
on record the resulting capital increase(s) <strong>and</strong> to amend the bylaws to<br />
reflect the new capital.<br />
144 FINANCIAL REPORT AND REGISTRATION DOCUMENT <strong>2010</strong> GROUPE SEB
5<br />
ANNUAL GENERAL MEETING<br />
PROPOSED RESOLUTIONS<br />
In the case of any issue of debt securities, the Board of Directors shall have<br />
full powers, including the right to delegate such powers to the Chairman,<br />
to decide whether to issue subordinated or unsubordinated debt, to set<br />
the interest rate, the life of the securities, the redemption price – which<br />
may be fixed or variable <strong>and</strong> may or may not include a call premium – the<br />
terms of early redemption depending on market conditions <strong>and</strong> the basis<br />
on which the debt securities are convertible, exchangeable, redeemable<br />
or otherwise exercisable for shares of the Company;<br />
that this authorisation cancels <strong>and</strong> replaces all earlier authorisations to<br />
issue shares <strong>and</strong> share equivalents with pre-emptive subscription rights.<br />
This authorisation is given for a period of fourteen (14) months.<br />
FOURTEENTH RESOLUTION<br />
Authorisation to issue shares <strong>and</strong> share equivalents<br />
without pre-emptive subscription rights<br />
The Extraordinary General Meeting, having considered the report of the Board<br />
of Directors <strong>and</strong> the Auditors’ special report, resolves, in accordance with<br />
Articles L. 225-129-2, L. 225-136 <strong>and</strong> L. 225-91 of the French Commercial Code:<br />
to give the Board of Directors the necessary powers, if such decision<br />
is approved by 12 of the 15 members present or represented by proxy,<br />
to issue hybrid securities convertible, exchangeable, redeemable or<br />
otherwise exercisable for shares, denominated in euros or in foreign<br />
currencies, in France or on the international market, <strong>and</strong> to determine<br />
the timing <strong>and</strong> amounts of said issues within the limits prescribed below.<br />
This authorisation only concerns issues of hybrid securities <strong>and</strong> not direct<br />
issues of ordinary shares;<br />
that the aggregate par value of the shares to be issued on conversion,<br />
exchange, redemption or exercise of share equivalents pursuant to this<br />
authorisation may not exceed €5,000,000. The par value of any additional<br />
shares to be issued to protect the rights of holders of existing share<br />
equivalents pursuant to the law shall not be taken into account in the<br />
computation of the value of said issues;<br />
that the aggregate nominal value of debt securities issued pursuant to<br />
this authorisation shall not exceed €150,000,000 or the equivalent of this<br />
amount in the case of issues denominated in foreign currencies;<br />
that existing shareholders shall not have a pre-emptive right to subscribe<br />
the share equivalents issued under this authorisation, but that the Board<br />
of Directors may grant shareholders a priority right to subscribe all or<br />
part of each issue, for a period <strong>and</strong> on terms to be decided by the Board,<br />
provided that the right is exercisable during at least three trading days.<br />
Said priority right shall not be transferable but the Board of Directors may<br />
allow shareholders to subscribe the issue <strong>and</strong> any securities not taken up<br />
by other shareholders pro rata to their existing shareholdings;<br />
that if any issue of share equivalents is not taken up in full by existing<br />
shareholders <strong>and</strong> the public, the Board of Directors may limit the amount<br />
of the issue to the value of the subscriptions received, provided that at<br />
least three-quarters of the issue is taken up;<br />
that, having noted that this authorisation will automatically entail the waiver<br />
of shareholders’ pre-emptive right to subscribe the shares to be issued<br />
on conversion, exchange, redemption or exercise of share equivalents,<br />
decides that said pre-emptive right will be cancelled;<br />
that the amount to be received by the Company for each share issued<br />
indirectly under this authorisation shall not represent less than the minimum<br />
amount prescribed by law. In the case of shares issued on exercise of<br />
st<strong>and</strong>-alone warrants or other primary securities, said amount shall be<br />
determined after taking into account the issue price of said warrants or<br />
other primary securities;<br />
that the Board of Directors shall have full powers to use this authorisation<br />
<strong>and</strong> to delegate such powers to the Chairman, subject to compliance<br />
with the law. In particular, the Board of Directors or the Chairman shall<br />
have full powers to set the date <strong>and</strong> terms of the issues, as well as the<br />
form <strong>and</strong> characteristics of the securities to be issued, the issue price<br />
<strong>and</strong> terms, the amount of each issue, the cum-rights date which may be<br />
set retrospectively, the terms of settlement of the subscription price <strong>and</strong>,<br />
if appropriate, the conditions under which the securities may be bought<br />
back on the open market or the conversion, exchange, redemption or<br />
exercise rights attached to the share equivalents may be suspended,<br />
provided that said rights are not suspended for more than three months.<br />
The Board of Directors or the Chairman shall also have full powers to<br />
charge any <strong>and</strong> all amounts against the issue premium, including the<br />
issuance costs, <strong>and</strong> to take all necessary or appropriate measures <strong>and</strong><br />
enter into any <strong>and</strong> all agreements in connection with the placement of the<br />
issues, to place on record the resulting capital increase(s) <strong>and</strong> to amend<br />
the bylaws to reflect the new capital;<br />
The Board of Directors shall have full powers, including the right to<br />
delegate such powers to the Chairman, to decide whether to issue<br />
subordinated or unsubordinated debt securities, to set the interest rate,<br />
the life of the securities, the redemption price – which may be fixed or<br />
variable <strong>and</strong> may or may not include a call premium – the terms of early<br />
redemption depending on market conditions <strong>and</strong> the basis on which the<br />
debt securities are convertible, exchangeable, redeemable or otherwise<br />
exercisable for shares of the Company;<br />
that this authorisation cancels <strong>and</strong> replaces all earlier authorisations to<br />
the same effect.<br />
This authorisation is given for a period of fourteen (14) months.<br />
FIFTEENTH RESOLUTION<br />
Authorisation to issue shares to be paid up by<br />
capitalizing retained earnings, profit or additional<br />
paid-in capital<br />
The Extraordinary General Meeting, voting in accordance with the quorum<br />
<strong>and</strong> majority voting rules applicable to Ordinary Meetings, having considered<br />
the report of the Board of Directors, gives the Board the necessary powers<br />
to increase the capital on one or several occasions by a maximum aggregate<br />
amount of €10,000,000 to be paid up by successively or simultaneously<br />
capitalizing all or part of the Company’s retained earnings, net profi t or<br />
additional paid-in capital, <strong>and</strong> to issue bonus shares <strong>and</strong>/or raise the par<br />
value of existing shares.<br />
The meeting resolves that the Board of Directors shall have discretionary<br />
powers to decide that fractional shares will be non-transferable <strong>and</strong> that<br />
the corresponding shares will be sold, with proceeds of such sale attributed<br />
to holders of rights to fractional shares no later than 30 days following the<br />
date on which the whole number of shares allocated to them are recorded<br />
in their securities account.<br />
5<br />
GROUPE SEB<br />
FINANCIAL REPORT AND REGISTRATION DOCUMENT <strong>2010</strong><br />
145
5 PROPOSED<br />
ANNUAL GENERAL MEETING<br />
RESOLUTIONS<br />
The meeting gives full powers to the Board of Directors, including the right<br />
to delegate such powers to the Chairman subject to compliance with the<br />
law, to determine the timing <strong>and</strong> terms of the capital increases, as well as the<br />
amounts thereof, to take the necessary action to protect the rights of existing<br />
shareholders of share equivalents, to deduct from the issue proceeds the<br />
amounts necessary to increase the legal reserve to 10% of the new capital,<br />
to take all appropriate measures to permit the execution of the operation, to<br />
carry out all actions <strong>and</strong> formalities required to effect the capital increase(s)<br />
<strong>and</strong> to amend the bylaws to reflect the new capital.<br />
This authorisation is given for a period of fourteen (14) months.<br />
SIXTEENTH RESOLUTION<br />
Blanket ceiling on financial authorisations<br />
The Extraordinary General Meeting, having considered the report of<br />
the Board of Directors, resolves, pursuant to the adoption of the above<br />
resolutions, to set at €10,000,000 the maximum aggregate par value of<br />
shares to be issued directly or on conversion, exchange, redemption or<br />
exercise of share equivalents pursuant to the thirteenth <strong>and</strong> fourteenth<br />
authorisations above, provided that said ceiling shall not include the par<br />
value of any additional shares to be issued to protect the rights of existing<br />
holders of share equivalents as required by law.<br />
SEVENTEENTH RESOLUTION<br />
Employee share issue<br />
The Extraordinary General Meeting, having considered the report of the<br />
Board of Directors <strong>and</strong> the Auditors’ special report, resolves, in accordance<br />
with Articles L. 225-129 to L. 225-129-6 <strong>and</strong> L. 225-138-1 of the French<br />
Commercial Code <strong>and</strong> Articles L. 443-1 et seq. of the French Labour Code:<br />
to authorise the Board of Directors to issue shares <strong>and</strong> share equivalents,<br />
on one or several occasions at its discretion, including in separate tranches,<br />
for subscription by members of an employee stock ownership plan set<br />
up for this purpose. The aggregate par value of shares issued directly<br />
or indirectly, on conversion, exchange, redemption or exercise of share<br />
equivalents, pursuant to this authorisation, shall not exceed €499,518.<br />
These powers may be delegated to any legally authorised person;<br />
that, having noted that this authorisation will automatically entail the<br />
waiver of shareholders’ pre-emptive right to subscribe shares <strong>and</strong> share<br />
equivalents issued under the authorisation in favour of members of the<br />
employee stock ownership plan, decides that said pre-emptive right will<br />
be cancelled;<br />
that – in accordance with Article L. 443-5 of the Labour Code – the shares<br />
may be offered for subscription at a 20% discount to the average of<br />
the prices quoted for the Company’s shares on Eurolist by Euronext<br />
Paris S.A. over the twenty trading days preceding the Board’s decision<br />
setting the opening date of the subscription period, or a 30% discount<br />
if the shares are offered to members of an employee stock ownership<br />
plan governed by Article L. 443-6 of the Labour Code provided that the<br />
lock-up period under the plan is at least ten years. The Board of Directors<br />
may replace all or part of the discount with a grant of shares or share<br />
equivalents, or reduce the discount or offer the shares at their market<br />
price, subject to compliance with the applicable legal <strong>and</strong> regulatory limits;<br />
that the Board of Directors may make matching payments to the employee<br />
stock ownership plan, in the form of shares or share equivalents, within<br />
the limits prescribed by Article L. 443-5 of the Labour Code;<br />
to give this authorisation for a period of fourteen (14) months;<br />
to grant full powers to the Board of Directors, including the power of<br />
delegation, to set all the terms <strong>and</strong> conditions of the issues. In particular,<br />
the Board shall be authorised to:<br />
decide to offer shares <strong>and</strong> share equivalents to employees of selected<br />
entities among the companies whose employees are eligible to invest<br />
in the employee stock ownership plan,<br />
set the terms <strong>and</strong> conditions of the issues to be carried out pursuant<br />
to this authorisation, decide the amount of each issue, the issue price<br />
<strong>and</strong> date, the subscription period <strong>and</strong> other terms <strong>and</strong> conditions, the<br />
terms <strong>and</strong> conditions of settlement <strong>and</strong> delivery, <strong>and</strong> the cum-rights<br />
dates of the shares or share equivalents,<br />
at its discretion, after each share issue, charge the issuance costs<br />
against the related premium <strong>and</strong> deduct from the premium the amount<br />
necessary to increase the legal reserve to one-tenth of the new capital,<br />
carry out any <strong>and</strong> all formalities in order to place on record the<br />
capital increase(s) effected pursuant to this authorisation, amend the<br />
bylaws to reflect the new capital <strong>and</strong> generally take all necessary or<br />
useful measures.<br />
EIGHTEENTH RESOLUTION<br />
Powers to carry out formalities<br />
The General Meeting gives full powers to the bearer of an original, extract<br />
or copy of the minutes of this meeting to carry out any <strong>and</strong> all formalities<br />
required by law.<br />
146 FINANCIAL REPORT AND REGISTRATION DOCUMENT <strong>2010</strong> GROUPE SEB
ADDITIONAL INFORMATION<br />
6<br />
ADDITIONAL<br />
INFORMATION<br />
GENERAL INFORMATION<br />
CONCERNING SEB S.A. 148<br />
Corporate objects (Article 3, company bylaws) 148<br />
Statutory allocation of profits<br />
(Article 46, Company bylaws) 148<br />
General Meetings of Shareholders<br />
(Article 30 <strong>and</strong> following, Company bylaws) 148<br />
Double voting rights (Article 35, Company bylaws) 149<br />
Limitation of voting rights 149<br />
Statutory threshold clause<br />
(Article 8, Company bylaws) 149<br />
Identity of bearer shareholders 149<br />
Share capital at 31 December <strong>2010</strong> 149<br />
Elements which could affect a hypothetical<br />
takeover bid 150<br />
STOCK MARKET<br />
AND DIVIDEND INFORMATION 160<br />
Stock market 160<br />
Stock market transactions over the last 18 months 160<br />
Dividends – dividend supplement 161<br />
CONSULTATION OF LEGAL DOCUMENTS 162<br />
NOTES 163<br />
SHARE CAPITAL BREAKDOWN<br />
AND CHANGES 151<br />
Share capital breakdown <strong>and</strong> voting rights<br />
at 31 December <strong>2010</strong> 151<br />
Changes in share capital breakdown <strong>and</strong> voting<br />
rights over the last three years 153<br />
Changes in share capital over the last five years 154<br />
Potential share capital at 31 December <strong>2010</strong> 154<br />
Changes in share capital breakdown<br />
over the last three years 154<br />
FINANCIAL AUTHORIZATIONS 155<br />
Authorization to issue shares <strong>and</strong> other securities 155<br />
Authorization for the Company to trade<br />
in its own shares 155<br />
EMPLOYEE SHAREHOLDING 156<br />
Staff mutual investment fund<br />
<strong>and</strong> direct employee shareholding 156<br />
Bonus <strong>and</strong> profit-sharing schemes 156<br />
Stock option <strong>and</strong> performance<br />
share allocation policy 157<br />
History of stock option allocation<br />
for share subscription or purchase 158<br />
Performance shares allocated to staff 159<br />
6<br />
GROUPE SEB<br />
FINANCIAL REPORT AND REGISTRATION DOCUMENT <strong>2010</strong><br />
147
6 GENERAL<br />
ADDITIONAL INFORMATION<br />
INFORMATION CONCERNING SEB S.A.<br />
GENERAL INFORMATION<br />
CONCERNING SEB S.A.<br />
Corporate name: SEB S.A.<br />
Registered head office: Les 4M, Chemin du Petit Bois, 69130, Ecully, France<br />
Tel.: +33 (0)4 72 18 18 18 | Fax: +33 (0) 472 18 16 55<br />
Business registration number: 300.349.636 RCS Lyon<br />
Industrial classification (NACE) code: 6420 Z<br />
Status: limited company<br />
<strong>Financial</strong> year: 1 January to 31 December<br />
Governing law: French<br />
Duration: 99 years from 1973<br />
CORPORATE OBJECTS (ARTICLE 3, COMPANY BYLAWS)<br />
The object of the Company in France <strong>and</strong> abroad covers:<br />
investment in any company involved in any form of business <strong>and</strong>, in<br />
consequence, the acquisition or subscription of all types of shares,<br />
warrants, capital holdings <strong>and</strong> interests, all types of securities, as well as<br />
the disposal of the said investments <strong>and</strong> marketable securities;<br />
all operations concerning the financing of its subsidiaries <strong>and</strong> other<br />
companies in which it owns or may acquire a holding;<br />
the acquisition <strong>and</strong> registration of patents or inventions <strong>and</strong> the granting<br />
of all forms of licences for the use of these patents;<br />
the acquisition, construction <strong>and</strong> management of real estate <strong>and</strong> its<br />
disposal;<br />
all operations contributing to the development of the Company <strong>and</strong> to the<br />
achievement of the objects specified above.<br />
STATUTORY ALLOCATION OF PROFITS<br />
(ARTICLE 46, COMPANY BYLAWS)<br />
Profits are allocated in accordance with legal requirements <strong>and</strong> regulations.<br />
Payment of dividends is done in priority over distributable profits.<br />
The Annual General Meeting may offer shareholders an option to choose<br />
payment of dividends in cash or in the form of new shares.<br />
A supplementary dividend payment per share of 10% of the unit value of<br />
the dividend in question, which may be rounded down to the nearest even<br />
number of euro cents, shall be paid in respect of shares registered without<br />
interruption by the same shareholder in the nominal register for at least two<br />
financial years preceding the dividend payment, <strong>and</strong> which are still registered<br />
on the ex-dividend date. For any one shareholder, this supplement is limited<br />
to a number of shares which may not exceed 0.5% of share capital. This<br />
supplement can be altered or cancelled by decision of an Extraordinary<br />
General Meeting of Shareholders which will then decide on any new terms<br />
<strong>and</strong> conditions.<br />
The General Meeting also has the power to decide on the distribution of<br />
amounts to be drawn from the reserves at its disposal. In this case, the<br />
reserve accounts from which funds are to be drawn are explicitly indicated.<br />
GENERAL MEETINGS OF SHAREHOLDERS<br />
(ARTICLE 30 AND FOLLOWING, COMPANY BYLAWS)<br />
Shareholders are notified of the AGM in accordance with legal requirements.<br />
Each shareholder has the right to attend General Meetings or to be<br />
represented, regardless of the number of shares held, provided that the<br />
said shares are fully paid up <strong>and</strong> registered in either the shareholder’s name<br />
or in the name of the intermediary registered on the shareholder’s behalf,<br />
at zero hour, French time, on the third business day preceding the General<br />
Meeting, either in the accounts of registered shares held by the Company,<br />
or in bearer share accounts held by the qualified intermediary.<br />
148 FINANCIAL REPORT AND REGISTRATION DOCUMENT <strong>2010</strong> GROUPE SEB
6<br />
ADDITIONAL INFORMATION<br />
GENERAL INFORMATION CONCERNING SEB S.A.<br />
DOUBLE VOTING RIGHTS (ARTICLE 35, COMPANY BYLAWS)<br />
Each member attending the meeting is entitled to exercise one vote for every<br />
share they hold or represent. However, double voting rights are conferred<br />
on fully-subscribed, registered nominal shares held by the same person<br />
for at least five years (decision by the General Meeting of 15 June 1985).<br />
Entitlement to double voting rights expires if the shares concerned are<br />
converted to bearer status or if their ownership is transferred, except in<br />
cases where the transfer involves a change of name in the nominal register<br />
subsequent to family inheritance or endowment. In the event of an increase<br />
in capital by incorporation of reserves, income or issue premiums, double<br />
voting rights are conferred, from the time of issue, on registered shares<br />
allocated free of charge to a shareholder on the basis of shares already held<br />
which bear this entitlement.<br />
LIMITATION OF VOTING RIGHTS<br />
There is no statutory limitation on voting rights.<br />
STATUTORY THRESHOLD CLAUSE (ARTICLE 8, COMPANY BYLAWS)<br />
There exists an obligation to disclose any holding which exceeds a threshold of 2.5% (or any multiple thereof) of the Company’s capital or voting rights.<br />
IDENTITY OF BEARER SHAREHOLDERS<br />
The Company may at any time, in accordance with legal provisions <strong>and</strong><br />
regulations in force, ask the Euroclear France securities settlement agency<br />
to provide:<br />
the personal name or company name, address <strong>and</strong> nationality of holders<br />
of shares in the Company;<br />
the quantity of shares held by each of them;<br />
where applicable, any restrictions to which these shares may be subject.<br />
SEB S.A. made such a request to know the identity of its shareholders on<br />
31 December <strong>2010</strong>.<br />
SHARE CAPITAL AT 31 DECEMBER <strong>2010</strong><br />
At 31 December <strong>2010</strong>, share capital stood at €49,951,826 <strong>and</strong> was made<br />
up of 49,951,826 fully paid-up shares, representing 75,699,538 total<br />
“theoretical” voting rights, <strong>and</strong> 73,718,840 effective voting rights (excluding<br />
treasury stock).<br />
There are no stricter conditions than the law to modify shareholder rights.<br />
6<br />
GROUPE SEB<br />
FINANCIAL REPORT AND REGISTRATION DOCUMENT <strong>2010</strong><br />
149
6 GENERAL<br />
ADDITIONAL INFORMATION<br />
INFORMATION CONCERNING SEB S.A.<br />
ELEMENTS WHICH COULD AFFECT A HYPOTHETICAL TAKEOVER BID<br />
In compliance with Article L. 225-100-3 of the French Commercial Code,<br />
elements which could affect a hypothetical takeover bid are stated below:<br />
CAPITAL STRUCTURE OF THE COMPANY<br />
See following page: “Breakdown of share capital <strong>and</strong> voting rights on<br />
31 December <strong>2010</strong>.”<br />
POWERS OF THE BOARD OF DIRECTORS<br />
IN THE EVENT OF A TAKEOVER BID<br />
The General Meeting of 12 May <strong>2010</strong> authorized the Board of Directors<br />
to implement a share buyback programme in the event of a takeover bid,<br />
subject to legal <strong>and</strong> regulatory provisions.<br />
SHAREHOLDER AGREEMENTS OF WHICH<br />
THE COMPANY IS AWARE<br />
See below: “Shareholder Agreements – Concerted Voting Block”.<br />
150 FINANCIAL REPORT AND REGISTRATION DOCUMENT <strong>2010</strong> GROUPE SEB
6<br />
ADDITIONAL INFORMATION<br />
SHARE CAPITAL BREAKDOWN AND CHANGES<br />
SHARE CAPITAL BREAKDOWN<br />
AND CHANGES<br />
SHARE CAPITAL BREAKDOWN AND VOTING RIGHTS<br />
AT 31 DECEMBER <strong>2010</strong><br />
Capital<br />
OGM EGM OGM EGM<br />
FÉDÉRACTIVE 10,225,930 20.47% 3 19,600,282 26.59% 3<br />
FÉDÉRACTIVE Associates 1,600,496 3.21% 11,826,423 23,68% 3,061,685 4.15% 22,661,964 30.74%<br />
SUB-TOTAL 11,826,426 23.68% 11,826,426 23.68% 22,661,967 30.74% 22,661,967 30.74%<br />
VENELLE INVESTISSEMENT 7,461,243 14.94% 17,902 0.03% 14,889,897 20.20% 17,905 0.03%<br />
VENELLE INVESTISSEMENT Associates 2,054,675 4.11% 9,974,878 19.97% 3,859,931 5.24% 19,685,647 26.70%<br />
SUB-TOTAL (a) 9,515,918 19.05% 9,992,780 20.00% 18,749,828 25.44% 19,703,552 26.73%<br />
FOUNDER GROUP 21,342,344 42.73% 21,819,206 43.68% 41,411,795 56.18% 42,365,519 57.47%<br />
FFP 2,521,522 5.05% 2,521,522 5.05% 4,713,533 6.39% 4,713,533 6.39%<br />
Employees 1,485,852 2.97% 1,486,440 2.98% 2,798,705 3.80% 2,799,881 3.80%<br />
French Investors 9,129,196 18.28% 8,652,334 17.32% 10,358,848 14.05% 9,405,124 12.76%<br />
Foreign shareholders 10,632,028 21.28% 10,632,028 21.28% 10,716,474 14.54% 10,716,474 14.54%<br />
Individual French shareholders 2,860,186 5.72% 2,859,598 5.72% 3,719,485 5.04% 3,718,309 5.04%<br />
Treasury shares 1,980,698 3.97% 1,980,698 3.97%<br />
TOTAL 49,951,826 SHARES 73,718,840 VOTING RIGHTS<br />
(a) The usufruct of 476,862 SEB shares representing 953,724 voting rights, of which the bare ownership belongs to the associates of VENELLE INVESTISSEMENT, is held by the Fondation de<br />
France (462,000 shares <strong>and</strong> 924,000 voting rights) <strong>and</strong> by the Association Canoniale (14,862 shares, 29,724 voting rights).<br />
It is also stated that before each SEB General Meeting until 12 May 2013, the Fondation de France has undertaken to assign power of proxy of its voting rights to the associates of VENELLE<br />
INVESTISSEMENT for a total of 577,500 shares (including the 462,000 previously stated) <strong>and</strong> 1,155,000 voting rights.<br />
Vote<br />
The term “Founder Group” used in the table above refers to a group of natural<br />
persons who are either direct descendants of the LESCURE family or related<br />
to the family through marriage.<br />
The natural person members of the Founder Group hold SEB shares either:<br />
in full ownership;<br />
or in bare ownership where the corresponding usufruct has essentially<br />
been temporarily assigned to their respective holding company i.e.:<br />
FÉDÉRACTIVE: a controlling holding company, which principally<br />
represents the equity interests of the founding family, for natural person<br />
shareholders who are associates of FÉDÉRACTIVE,<br />
VENELLE INVESTISSEMENT: a family controlling holding company<br />
for natural person shareholders who are associates of VENELLE<br />
INVESTISSEMENT.<br />
As a reminder, voting rights attached to stripped shares belong to the bare<br />
holder for decisions concerning the Extraordinary General Meeting (EGM)<br />
<strong>and</strong> to the usufruct holder for those concerning the Ordinary General<br />
Meeting (OGM).<br />
The voting rights indicated in the table above, a total of 73,718,840, are<br />
“effective” voting rights. This number excludes shares without voting rights,<br />
such as treasury stock held by SEB S.A.<br />
The total number of “theoretical” voting rights is 75,699,538. This number<br />
includes, under the terms of Article 223–11 of the AMF general regulations, all<br />
shares with voting rights attached, as well as non-voting shares (for instance,<br />
shares held by SEB S.A. or treasury stock).<br />
On the basis of this total number of “theoretical” voting rights <strong>and</strong> for<br />
illustrative purposes:<br />
the FÉDÉRACTIVE sub-total amounts to 29.94% of the OGM <strong>and</strong> EGM<br />
voting rights;<br />
the VENELLE INVESTISSEMENT sub-total amounts to 24.77% of the<br />
OGM voting rights <strong>and</strong> 26.03% of the EGM voting rights;<br />
as a whole, the Founder Group sub-total amounts to 54.71% of the OGM<br />
voting rights <strong>and</strong> 55.97% of the EGM voting rights.<br />
Registered nominal shares held by the same person for at least five years<br />
give entitlement to double voting rights.<br />
6<br />
GROUPE SEB<br />
FINANCIAL REPORT AND REGISTRATION DOCUMENT <strong>2010</strong><br />
151
6 SHARE<br />
ADDITIONAL INFORMATION<br />
CAPITAL BREAKDOWN AND CHANGES<br />
SHAREHOLDER AGREEMENTS – CONCERTED<br />
VOTING BLOCK<br />
The FÉDÉRACTIVE <strong>and</strong> VENELLE INVESTISSEMENT family holdings,<br />
representing together with their associates 57.47% of voting rights,<br />
confi rmed their intention to implement a sustainable management policy<br />
for <strong>Groupe</strong> SEB in writing to the AMF (French Markets Authority) in letters<br />
dated 11 <strong>and</strong> 12 May 2009, with a view to ensuring the longevity of their<br />
control <strong>and</strong> thus pursuing the concerted voting block in place between the<br />
members of the Founder Group since May 1989.<br />
The non-renewal of the shareholder agreement of 5 November 2005 which<br />
ended on 5 November 2009 does not therefore terminate the concerted<br />
voting block existing between the parties to the agreement under the terms<br />
of L. 233-10 of the French Commercial Code (AMF D&I no. 209C0644 dated<br />
12 May 2009).<br />
The representatives of the two family holdings have further declared to the<br />
Board of Directors their wish to exchange prior to any significant decision<br />
<strong>and</strong> to maintain their previous agreement on the composition of the Board<br />
as determined in the agreement of 2005. In this respect, FÉDÉRACTIVE<br />
may propose the appointment of five members of the Board <strong>and</strong> VENELLE<br />
INVESTISSEMENT may propose the appointment of four members.<br />
FÉDÉRACTIVE Agreement<br />
On 9 July 2008, SEB shareholder associates of FÉDÉRACTIVE signed a<br />
shareholder agreement reinforcing their commitment to the Group.<br />
The provisions of this agreement foresee preferential conditions between its<br />
signatories for the sale or acquisition of SEB shares held, as well as a binding<br />
exit clause. The provisions also envisage the participation of other investors<br />
willing to provide lasting commitment to the development of <strong>Groupe</strong> SEB <strong>and</strong><br />
to take part in shareholder policies alongside the FÉDÉRACTIVE Founder<br />
Group members (AMF D&I no. 208C1659 dated 11 September 2008).<br />
VENELLE INVESTISSEMENT Agreement<br />
On 12 May 2009, VENELLE INVESTISSEMENT, its associates <strong>and</strong><br />
shareholder members entered into a shareholder agreement to ensure that<br />
VENELLE INVESTISSEMENT, its associates <strong>and</strong> shareholder members<br />
mutually agree as a matter of priority to propose a prior right to acquisition<br />
applicable to any transfer or sale of share subject to pre-emptive rights (AMF<br />
D&I no. 209C0743 dated 27 May 2009).<br />
COLLECTIVE UNDERTAKING TO HOLD SHARES<br />
A collective undertaking to hold SEB shares covering 22.66% of the capital<br />
<strong>and</strong> 26.60% of the voting rights of SEB S.A., was signed on 28 December<br />
2005 by a number of SEB S.A. shareholders: VENELLE INVESTISSEMENT,<br />
Thierry de La Tour d’Artaise in his capacity as Chairman <strong>and</strong> Chief Executive<br />
Offi cer, individual family group shareholders, Foncière, Financière et de<br />
Participation (FFP), <strong>and</strong> other shareholders (AMF D&I no. 206C0032 dated<br />
5 January 2006).<br />
This agreement, lasting for six years, was concluded under the terms of<br />
Article 885 I b of the French Income Tax Code (a “Dutreil” agreement).<br />
FFP shall have prior rights in the event of a family shareholder signatory<br />
deciding to sell more than 50,000 SEB shares to a third party.<br />
152 FINANCIAL REPORT AND REGISTRATION DOCUMENT <strong>2010</strong> GROUPE SEB
6<br />
ADDITIONAL INFORMATION<br />
SHARE CAPITAL BREAKDOWN AND CHANGES<br />
CHANGES IN SHARE CAPITAL BREAKDOWN AND VOTING RIGHTS<br />
OVER THE LAST THREE YEARS<br />
31/12/2008 31/12/2009 31/12/<strong>2010</strong><br />
Capital Voting rights Capital Voting rights Capital Voting rights<br />
OGM EGM OGM EGM OGM EGM OGM EGM OGM EGM OGM EGM<br />
FÉDÉRACTIVE 19.13% 0.00% 27.21% 0.00% 19.87% 0.00% 26.32% 0.00% 20.47% 0.00% 26.59% 0.00%<br />
FÉDÉRACTIVE<br />
Associates 3.82% 22.95% 5.26% 32.47% 3.99% 23.86% 4.89% 31.21% 3.21% 23.68% 4.15% 30.74%<br />
SUB-TOTAL 22.95% 22.95% 32.47% 32.47% 23.86% 23.86% 31.21% 31.21% 23.68% 23.68% 30.74% 30.74%<br />
VENELLE<br />
INVESTISSEMENT 13.09% 0.01% 18.90% 0.01% 14.94% 0.04% 20.34% 0.02% 14.94% 0.03% 20.20% 0.03%<br />
VENELLE<br />
INVESTISSEMENT<br />
Associates 5.74% 19.75% 7.85% 28.10% 4.09% 19.95% 5.30% 26.92% 4.11% 19.97% 5.24% 26.70%<br />
SUB-TOTAL 18.83% 19.76% 26.75% 28.11% 19.03% 19.99% 25.64% 26.94% 19.05% 20.00% 25.44% 26.73%<br />
FOUNDER GROUP 41.78% 42.71% 59.22% 60.58% 42.89% 43.85% 56.85% 58.15% 42.73% 43.68% 56.18% 57.47%<br />
FFP 5.70% 5.70% 4.12% 4.12% 5.81% 5.81% 7.48% 7.48% 5.05% 5.05% 6.39% 6.39%<br />
Employees 3.54% 3.54% 4.83% 4.83% 3.46% 3.46% 4.49% 4.49% 2.97% 2.98% 3.80% 3.80%<br />
French Investors 21.27% 20.34% 16.87% 15.51% 19.22% 18.26% 14.53% 13.23% 18.28% 17.32% 14.05% 12.76%<br />
Foreign<br />
shareholders 13.76% 13.76% 9.99% 9.99% 16.70% 16.70% 11.53% 11.53% 21.28% 21.28% 14.54% 14.54%<br />
Individual French<br />
shareholders 5.35% 5.35% 4.97% 4.97% 5.61% 5.61% 5.12% 5.12% 5.72% 5.72% 5.04% 5.04%<br />
Treasury shares 8.60% 8.60% 6.31% 6.31% 3.97% 3.97%<br />
50,912,138 SHARES 70,491,203 VOTES 49,951,826 SHARES 73,157,874 VOTES 49,951,826 SHARES 73,718,840 VOTES<br />
Although the Company is monitored, the organization <strong>and</strong> operating methods<br />
of the Board of Directors <strong>and</strong> the committees ensure balanced control <strong>and</strong><br />
effective management of confl icts of interest. Effectively, excluding the<br />
Chairman:<br />
five Board members, of whom four are independent, are not members of<br />
the Founder Group;<br />
the nine members of the Board representing the Founder Group are<br />
subject to the same regulations as other directors, concerning the interest<br />
of the Company <strong>and</strong> the rules stated in the charter <strong>and</strong> internal regulations.<br />
In addition, each year (except in 2009 due to lack of time) since 2003, the<br />
Board has assessed its operations, ensuring that all rules applicable to good<br />
corporate governance are respected.<br />
At 31 December <strong>2010</strong>, almost 5,000 shareholders owned registered SEB<br />
shares <strong>and</strong> 17,150 shareholders held SEB bearer shares. (Source: TPI inquiry<br />
dated 31 December <strong>2010</strong>).<br />
To the knowledge of the Company, there are no other shareholders who<br />
own directly, indirectly or jointly with others, 5% or more of share capital<br />
or voting rights.<br />
SHARES IN THE SEB S.A. NOMINAL REGISTER<br />
USED AS COLLATERAL, AT 31 DECEMBER <strong>2010</strong><br />
During the year, 11 individual shareholders used SEB shares registered in the<br />
SEB S.A. nominal register as collateral for loans in favour of their financial<br />
intermediaries. This concerned a total of 42,464 shares, or 0.09% of share<br />
capital.<br />
6<br />
GROUPE SEB<br />
FINANCIAL REPORT AND REGISTRATION DOCUMENT <strong>2010</strong><br />
153
6 SHARE<br />
ADDITIONAL INFORMATION<br />
CAPITAL BREAKDOWN AND CHANGES<br />
CHANGES IN SHARE CAPITAL OVER THE LAST FIVE YEARS<br />
Year<br />
2006<br />
December<br />
2007<br />
December<br />
2008<br />
June<br />
December<br />
Type of issue of share capital<br />
Amount of<br />
increase in shares Nominal (€)<br />
Additional paid-in<br />
capital (€)<br />
Total share<br />
capital (€)<br />
Issue of shares arising from the exercise<br />
of stock options 38,780 116,340 2,052,227 51,056,460<br />
Issue of shares arising from the exercise<br />
of stock options 32,486 97,458 1,764,999 51,153,918<br />
Cancellation of shares (91,120) (273,360) (7,719,631) 50,880,558<br />
3-for-1 split of the nominal share<br />
price (from €3 to €1) 33,920,372 50,880,558<br />
Issue of shares arising from the exercise<br />
of stock options 31,580 31,580 581,463 50,912,138<br />
2009<br />
March Cancellation of shares (1,000,000) (1,000,000) (29,629,143) 49,912,138<br />
December<br />
Issue of shares arising from the exercise<br />
of stock options 39,688 39,688 664,660 49,951,826<br />
<strong>2010</strong> No change to share capital 49,951,826<br />
POTENTIAL SHARE CAPITAL AT 31 DECEMBER <strong>2010</strong><br />
There are no longer any stock options proposed to employees <strong>and</strong> none that can be exercised.<br />
There are no convertible bonds which can be exchanged for or converted into shares giving access to the Company’s capital, nor instruments that do not<br />
represent capital.<br />
CHANGES IN SHARE CAPITAL BREAKDOWN OVER THE LAST<br />
THREE YEARS<br />
There was no significant change in the breakdown of the Company’s share capital during 2008, 2009 or <strong>2010</strong>.<br />
154 FINANCIAL REPORT AND REGISTRATION DOCUMENT <strong>2010</strong> GROUPE SEB
6<br />
ADDITIONAL INFORMATION<br />
FINANCIAL AUTHORIZATIONS<br />
FINANCIAL AUTHORIZATIONS<br />
AUTHORIZATION TO ISSUE SHARES AND OTHER SECURITIES<br />
Type of operation<br />
Date of<br />
authorization<br />
Expiry of<br />
authorization<br />
Maximum amount authorized<br />
Used at<br />
31/12/<strong>2010</strong><br />
Issue of share capital by incorporation of reserves,<br />
income, shares or other premiums 05/10 07/11 €10,000,000 -<br />
Issue of all types of securities with preferential<br />
subscription rights 05/10 07/11<br />
Issue of all types of securities without preferential<br />
subscription rights 05/10 07/11<br />
Issue of share capital: €5,000,000<br />
Issue of receivables: €150,000,000 -<br />
Issue of share capital: €5,000,000<br />
Issue of receivables: €150,000,000 -<br />
Purchase of its own shares by the Company<br />
at a maximum price of €65 05/10 07/11 €324,686,869 -<br />
Cancellation of its own shares by the Company 05/10 07/11<br />
10% of nominal capital, i.e., 4,995,182 shares<br />
per 24-month period -<br />
Issue of shares reserved for employees<br />
participating in Company savings scheme 05/10 07/11<br />
€499,518 of nominal capital, i.e.,<br />
499,518 shares -<br />
Stock option to purchase shares 05/10 07/11 1.3% of nominal capital, i.e., 649,373 412,592<br />
0.325% of the nominal capital<br />
Allocation of free shares 05/10 07/11<br />
of the transaction 58,363<br />
AUTHORIZATION FOR THE COMPANY TO TRADE IN ITS OWN SHARES<br />
Following the authorization granted by the General Meetings of 2009<br />
<strong>and</strong> <strong>2010</strong> <strong>and</strong> in Article 225-209 of the French Commercial Code, your Board<br />
did not acquire any share in <strong>2010</strong> <strong>and</strong> 1,153,549 shares were sold during the<br />
exercise of stock options at the average price of €27.19.<br />
Moreover, 264,329 shares were acquired <strong>and</strong> 279,525 shares were sold<br />
under a liquidity agreement.<br />
At 31 December <strong>2010</strong>, the Company had 1,980,698 treasury stock, i.e.,<br />
3.97% of its share capital, of which 1,976,737 under the buyback agreement<br />
<strong>and</strong> 3,961 under the liquidity agreement.<br />
The Company will renew its request to the Annual General Meeting of 17 May<br />
2011 for authorization to trade in its own shares.<br />
6<br />
GROUPE SEB<br />
FINANCIAL REPORT AND REGISTRATION DOCUMENT <strong>2010</strong><br />
155
6 EMPLOYEE<br />
ADDITIONAL INFORMATION<br />
SHAREHOLDING<br />
EMPLOYEE SHAREHOLDING<br />
STAFF MUTUAL INVESTMENT FUND AND DIRECT EMPLOYEE<br />
SHAREHOLDING<br />
At 31 December <strong>2010</strong>, employees of the Group’s companies held 963,000<br />
shares as part of a Company savings scheme via an employee mutual<br />
investment fund, amounting to 1.93% of share capital <strong>and</strong> 2.61% of voting<br />
rights. With the addition of directly-owned shares, employees held a total<br />
of 2.98% of share capital <strong>and</strong> 3.80% of voting rights.<br />
BONUS AND PROFIT-SHARING SCHEMES<br />
To attract competent <strong>and</strong> career-oriented employees at all levels <strong>and</strong> in<br />
addition to its dynamic salary <strong>and</strong> career management policies, <strong>Groupe</strong> SEB<br />
has always pursued an active policy of employee shareholding <strong>and</strong> staff<br />
participation in profits, through:<br />
an exceptional Group profit-sharing agreement which involves employee<br />
shareholding <strong>and</strong> profit sharing with significantly more interesting terms<br />
compared to the legal scheme. Depending on the year, the exceptional<br />
part represents between 2 <strong>and</strong> 4 times the legal amount of profit-sharing;<br />
a Group bonus scheme agreement, based on a scheme stipulated by law<br />
but which is discretionary. This Corporate level agreement allows a fair<br />
distribution of the sums from the bonus scheme between the employees<br />
of the different companies regardless of their business sector <strong>and</strong> its<br />
performance.<br />
In <strong>2010</strong>, charges recognised for bonus <strong>and</strong> profit-sharing schemes amounted<br />
to €50.3 million.<br />
Over the past five years, the sums assigned were as follows:<br />
(in € millions) <strong>2010</strong> 2009 2008 2007 2006 2005<br />
50.3* 33.5* 38.2* 33.3 25.7 29.2<br />
* Of which €2.9 million of social tax in <strong>2010</strong>, €1.3 million in 2009 <strong>and</strong> €0.7 million in 2008.<br />
156 FINANCIAL REPORT AND REGISTRATION DOCUMENT <strong>2010</strong> GROUPE SEB
6<br />
ADDITIONAL INFORMATION<br />
EMPLOYEE SHAREHOLDING<br />
STOCK OPTION AND PERFORMANCE SHARE ALLOCATION POLICY<br />
<strong>Groupe</strong> SEB operates two types of stock option allocation schemes:<br />
periodically, an allocation of stock options to members of management,<br />
extended to the Group’s different entities, taking account of individual<br />
potential, responsibilities <strong>and</strong> performance;<br />
occasionally, a broader allocation with a view to mobilizing employees<br />
around a specific project.<br />
CHARACTERISTICS OF STOCK OPTIONS<br />
ALLOCATED<br />
The exercise price is equal to the average of the last 20 Stock Market prices<br />
preceding the date of allocation by the Board. No discount is proposed on<br />
this average price.<br />
The stock options last for eight years. They can only be exercised four years<br />
from their date of allocation.<br />
Half of the stock options allocated in <strong>2010</strong> to the CEO <strong>and</strong> one third of<br />
the options allocated to the Group Executive Committee are subject to<br />
performance conditions concerning the achievement of sales <strong>and</strong> operating<br />
margin objectives.<br />
CHARACTERISTICS OF PERFORMANCE SHARES<br />
ALLOCATED<br />
The shares are allocated to benefi ciaries at the end of a 2-year vesting<br />
period, subject to conditions of performance <strong>and</strong> attendance. Beneficiaries<br />
are required to hold the shares for an additional period of two years.<br />
Performance conditions are linked to the achievement of sales <strong>and</strong> operating<br />
margin objectives.<br />
HOLDING CONDITIONS APPLICABLE<br />
TO THE CHIEF EXECUTIVE OFFICER<br />
AND OTHER MEMBERS OF THE GROUP<br />
EXECUTIVE COMMITTEE<br />
Shares originating from the exercise of stock options <strong>and</strong> free shares<br />
allocated to Thierry de La Tour d’Artaise are subject to an obligation to<br />
hold them in his name for the duration of his time in office, in the following<br />
amounts:<br />
for shares originating from exercised stock options, a quantity of shares<br />
corresponding to 50% of the net gain on acquisition, net of tax <strong>and</strong><br />
statutory deductions, realized at the time of exercise of the options;<br />
for shares allocated free of charge, a quantity of shares corresponding<br />
to 50% of the net gain after taxes, statutory deductions <strong>and</strong> costs.<br />
These quantities will be reduced to 20% of the net gain as soon as the<br />
number of shares held by Thierry de La Tour d’Artaise reaches the equivalent<br />
of 2 years of remuneration (basic + bonus).<br />
As a reminder, hedging instruments are prohibited <strong>and</strong> to the knowledge of<br />
the Company, no such instrument has been put in place.<br />
Shares originating from the exercise of stock options <strong>and</strong> free shares<br />
allocated to other members of the Group Executive Committee are subject<br />
to an obligation to hold them in their name for the duration of their time<br />
in office, in the following amounts:<br />
for shares originating from exercised stock options, a quantity of shares<br />
corresponding to 20% of the net gain on acquisition, net of tax <strong>and</strong><br />
statutory deductions, realized at the time of exercise of the options;<br />
for shares allocated free of charge, a quantity of shares corresponding<br />
to 20% of the net gain after taxes, statutory deductions <strong>and</strong> costs;<br />
this option to hold the shares will continue to apply for as long as the<br />
number of shares held has not reached the equivalent of one year’s<br />
remuneration (basic + bonus).<br />
6<br />
GROUPE SEB<br />
FINANCIAL REPORT AND REGISTRATION DOCUMENT <strong>2010</strong><br />
157
6 EMPLOYEE<br />
ADDITIONAL INFORMATION<br />
SHAREHOLDING<br />
HISTORY OF STOCK OPTION ALLOCATION FOR SHARE<br />
SUBSCRIPTION OR PURCHASE<br />
At 31 December <strong>2010</strong><br />
Purchase<br />
plan<br />
Purchase<br />
plan<br />
Purchase<br />
plan<br />
Purchase<br />
plan<br />
Purchase<br />
plan<br />
Purchase<br />
plan<br />
Purchase<br />
plan<br />
Purchase<br />
plan<br />
Purchase<br />
plan<br />
Purchase<br />
plan<br />
Date of AGM 03/05/1999 14/05/2002 14/05/2002 06/05/2004 06/05/2004 11/05/2006 11/05/2006 13/05/2008 13/05/2009 12/05/<strong>2010</strong><br />
Number of stock options<br />
authorized by AGM 1,387,356 1,389,573 1,389,573 1,529,454 1,529,454 1,529,355 1,529,355 1,017,761 598,945 649,373<br />
Duration of authorization 5 years 3 years 3 years 3 years 3 years 3 years 3 years 3 years 14 months 14 months<br />
Date Of Board Of Directors’<br />
Meeting 19/04/2002 17/10/2002 18/06/2003 18/06/2004 08/04/2005 16/06/2006 20/04/2007 13/05/2008 12/06/2009 18/06/<strong>2010</strong><br />
Number of stock options<br />
allocated (a) 417,450 598,125 612,150 539,100 554,700 589,798 579,150 1,005,900 371,300 412,592<br />
of which to Group<br />
Management Board 214,500 44,055 334,290 310,500 318,600 357,000 346,350 261,600 254,250 259,442<br />
of which to Company<br />
officers (a) 49,500 6,600 115,516 104,989 105,000 105,012 105,000 105,000 71,250 59,942<br />
of which to top employee<br />
recipients (a) 145,200 43,230 237,600 210,000 222,000 234,000 234,000 104,400 72,900 57,600<br />
Number of initial recipients 76 645 103 111 110 111 109 395 111 144<br />
Stock options exercise date 19/04/2006 17/10/2006 18/06/2007 18/06/2008 08/04/2009 16/06/<strong>2010</strong> 20/04/2011 13/05/2012 12/06/2013 18/06/2014<br />
Expiry date 19/04/<strong>2010</strong> 17/10/<strong>2010</strong> 18/06/2011 18/06/2012 08/04/2013 16/06/2014 20/04/2015 13/05/2016 12/06/2017 18/06/2018<br />
SUBSCRIPTION OR<br />
PURCHASE PRICE (in €) (a) 27.88 25.15 24.24 31.67 28.00 29.33 44.00 38.35 28.05 53.86<br />
Average of last 20 prices<br />
prior to Board Meeting (€) (a) 27.78 26.65 24.03 31.52 28.20 29.01 43.73 38.35 28.05 53.854<br />
Number of stock options<br />
exercised (a) 396,000 488,895 544,824 308,104 376,267 294,594 0 0 0 0<br />
Number of stock options<br />
cancelled (a) 21,450 109,230 27,730 17,400 20,100 14,707 8,100 17,700 1,050 0<br />
BALANCE OF STOCK<br />
OPTIONS REMAINING<br />
TO BE EXERCISED (a) 0 0 39,596 213,596 158,333 280,497 571,050 988,200 370,250 412,592<br />
(a) Takes into account the allocation of free shares in March 2004 (1 for 10) <strong>and</strong> the three-way split on 16 June 2008.<br />
158 FINANCIAL REPORT AND REGISTRATION DOCUMENT <strong>2010</strong> GROUPE SEB
6<br />
ADDITIONAL INFORMATION<br />
EMPLOYEE SHAREHOLDING<br />
PERFORMANCE SHARES ALLOCATED TO STAFF<br />
At 31 December <strong>2010</strong> Performance shares Performance shares<br />
Date of AGM 13/05/2009 12/05/<strong>2010</strong><br />
Number of shares authorized by AGM 199,649 162,343<br />
Duration of authorization 14 months 14 months<br />
Date of Board of Directors’ Meeting 12/06/2009 18/06/<strong>2010</strong><br />
Number of shares allocated: 50,472 58,363<br />
of which to Group Management Board 21,188 21,620<br />
of which to Company officers 5,938 4,995<br />
of which to the top employees 13,050 12,900<br />
Number of initial recipients: 111 144<br />
of which Group Management Board 14 16<br />
of whom top employee recipients 29 28<br />
Allocation date 12/06/2009 18/06/<strong>2010</strong><br />
Vesting date 12/06/2011 18/06/2012<br />
Deadline for holding period 12/06/2013 18/06/2014<br />
Number of cancelled shares 451 0<br />
BALANCE OF SHARES GRANTED OR REMAINING TO BE GRANTED 50,021 58,363<br />
6<br />
GROUPE SEB<br />
FINANCIAL REPORT AND REGISTRATION DOCUMENT <strong>2010</strong><br />
159
6 STOCK<br />
ADDITIONAL INFORMATION<br />
MARKET AND DIVIDEND INFORMATION<br />
STOCK MARKET<br />
AND DIVIDEND INFORMATION<br />
STOCK MARKET<br />
The Company’s shares are listed on the Paris Euronext Market, compartment A, under the code ISIN FR0000121709. They are included in the Euronext 3722<br />
Durable Household Products index.<br />
STOCK MARKET TRANSACTIONS OVER THE LAST 18 MONTHS<br />
Number of shares<br />
exchanged<br />
Capital<br />
Exchanged<br />
(in € thous<strong>and</strong>s)<br />
Highest (in €) Lowest (in €)<br />
Daily averages<br />
2009 40.53 16.44 89,441 2,494<br />
8 36.81 33.00 67,029 2,310<br />
9 39.40 34.31 81,754 3,022<br />
10 39.40 34.67 91,936 3,420<br />
11 40.53 36.30 58,379 2,275<br />
12 39.75 37.05 35,974 1,389<br />
<strong>2010</strong> 82.78 39.15 107,699 6,187<br />
1 48.88 39.15 111,363 5,040<br />
2 48.90 43.25 88,513 4,120<br />
3 52.19 46.52 87,449 4,300<br />
4 58.35 49.48 103,359 5,510<br />
5 58.99 49.20 235,978 13,140<br />
6 57.89 52.55 112,001 6,130<br />
7 59.70 51.85 115,819 6,610<br />
8 59.45 55.28 72,095 4,129<br />
9 64.83 57.80 87,443 5,390<br />
10 69.77 61.98 89,113 5,870<br />
11 72.92 67.69 98,865 7,012<br />
12 82.78 71.00 90,388 6,995<br />
2011<br />
1 82.15 70.06 163,259 12,440<br />
Source: Euronext Paris.<br />
160 FINANCIAL REPORT AND REGISTRATION DOCUMENT <strong>2010</strong> GROUPE SEB
6<br />
ADDITIONAL INFORMATION<br />
STOCK MARKET AND DIVIDEND INFORMATION<br />
DIVIDENDS – DIVIDEND SUPPLEMENT<br />
It is the Group’s policy to ensure that its shareholders are given a fair return<br />
on the capital they invest in the Group. The Board of Directors aims to ensure<br />
regular <strong>and</strong> continuous growth in dividend payments.<br />
A 10% dividend supplement, rounded down to the nearest even number<br />
of euro cents, will be paid in 2011 to long-term shareholders in respect<br />
of shares held by the same shareholder in the nominal register since at<br />
least 31 December 2008 <strong>and</strong> still held on ex-dividend date. This dividend<br />
supplement is limited to a number of shares which may not exceed 0.5% of<br />
share capital for any single shareholder.<br />
The term of dividend limitation is five years, as from the payment date. After<br />
this time, unclaimed dividends are paid over to the state.<br />
Years<br />
Number of shares<br />
remunerated<br />
Dividend<br />
per share (in €)<br />
2005<br />
Dividend 48,656,769 0.80000<br />
Dividend Supplement 18,439,968 0.08000<br />
2006<br />
Dividend 48,806,556 0.85000<br />
Dividend Supplement 16,489,335 0.08500<br />
2007<br />
Dividend 47,469,969 0.93333<br />
Dividend Supplement 18,782,508 0.09333<br />
2008<br />
Dividend 46,370,641 0.94000<br />
Dividend Supplement 19,305,528 0.09400<br />
2009<br />
Dividend 47,377,592 1.0400<br />
Dividend Supplement 18,885,247 0.1040<br />
Data adjusted to take account of the 3-for-1 split on 16 June 2008.<br />
A net dividend of €1.17 per share based on the <strong>2010</strong> results will be proposed at the Annual General Meeting of 17 May 2011. The coupon will be clipped on<br />
19 May for payment on 24 May 2011.<br />
6<br />
GROUPE SEB<br />
FINANCIAL REPORT AND REGISTRATION DOCUMENT <strong>2010</strong><br />
161
6 CONSULTATION<br />
ADDITIONAL INFORMATION<br />
OF LEGAL DOCUMENTS<br />
CONSULTATION OF LEGAL DOCUMENTS<br />
The Company bylaws, reports on the General Meeting <strong>and</strong> other company documents may be consulted at the Company’s registered offices: Chemin du<br />
Petit Bois, 69130 Écully, France.<br />
Company regulatory documents may be consulted on the <strong>Groupe</strong> SEB website: www.groupeseb.com.<br />
162 FINANCIAL REPORT AND REGISTRATION DOCUMENT <strong>2010</strong> GROUPE SEB
NOTES<br />
GROUPE SEB<br />
FINANCIAL REPORT AND REGISTRATION DOCUMENT <strong>2010</strong><br />
163
164 FINANCIAL REPORT AND REGISTRATION DOCUMENT <strong>2010</strong> GROUPE SEB
FINANCIAL<br />
AGENDA 2011<br />
26 APRIL AFTER 5:40 PM (FT)<br />
2011 first-quarter sales <strong>and</strong> financial data<br />
17 MAY - 2:30 PM (FT)<br />
Annual General Meeting<br />
24 MAY<br />
Payment of dividend<br />
25 JULY 9:00 PM (FT)<br />
2011 half-year sales & trading results<br />
24 OCTOBER AFTER 5:40 PM (FT)<br />
2011 nine-month sales <strong>and</strong> financial data<br />
Internet publication dates<br />
<strong>Groupe</strong> SEB<br />
Les 4 M chemin du Petit-Bois –BP 172<br />
69134 Écully Cedex France<br />
www.groupeseb.com<br />
This document was printed in France by an Imprim’Vert<br />
certified printer on recyclable,<br />
elementary chlorine free <strong>and</strong> PEFC certified paper<br />
produced from sustainably managed forests.<br />
Photos : Dreamstime, <strong>Groupe</strong> SEB, Dixdix,<br />
Olix Wirtinger - Gettyimages,<br />
Asia Images Group / collection Asiapix.
<strong>Groupe</strong> SEB<br />
Les 4 M – chemin du Petit Bois – BP 172<br />
69134 Écully Cedex France<br />
Tel: +33(0)4 72 18 18 18<br />
www.groupeseb.com<br />
Photos: Photothèque <strong>Groupe</strong> SEB / GraphicObsession - DR.