User's Guide to the Model Validation Kit - Harmonisation within ...
User's Guide to the Model Validation Kit - Harmonisation within ...
User's Guide to the Model Validation Kit - Harmonisation within ...

Create successful ePaper yourself
Turn your PDF publications into a flip-book with our unique Google optimized e-Paper software.
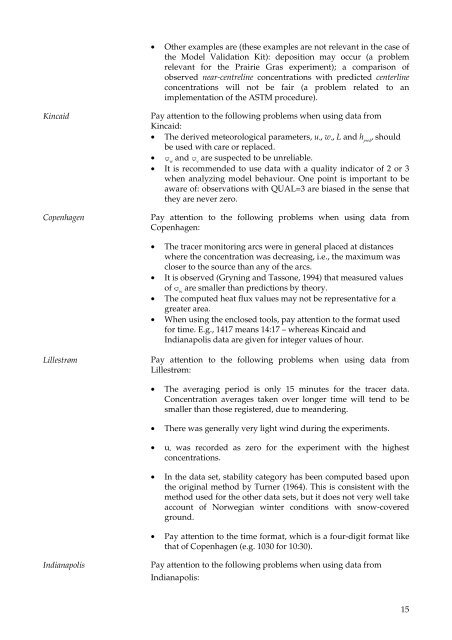
• O<strong>the</strong>r examples are (<strong>the</strong>se examples are not relevant in <strong>the</strong> case of<br />
<strong>the</strong> <strong>Model</strong> <strong>Validation</strong> <strong>Kit</strong>): deposition may occur (a problem<br />
relevant for <strong>the</strong> Prairie Gras experiment); a comparison of<br />
observed near-centreline concentrations with predicted centerline<br />
concentrations will not be fair (a problem related <strong>to</strong> an<br />
implementation of <strong>the</strong> ASTM procedure).<br />
Kincaid<br />
Copenhagen<br />
Pay attention <strong>to</strong> <strong>the</strong> following problems when using data from<br />
Kincaid:<br />
• The derived meteorological parameters, u *<br />
, w *<br />
, L and h pred<br />
, should<br />
be used with care or replaced.<br />
• and are suspected <strong>to</strong> be unreliable.<br />
w v<br />
• It is recommended <strong>to</strong> use data with a quality indica<strong>to</strong>r of 2 or 3<br />
when analyzing model behaviour. One point is important <strong>to</strong> be<br />
aware of: observations with QUAL=3 are biased in <strong>the</strong> sense that<br />
<strong>the</strong>y are never zero.<br />
Pay attention <strong>to</strong> <strong>the</strong> following problems when using data from<br />
Copenhagen:<br />
• The tracer moni<strong>to</strong>ring arcs were in general placed at distances<br />
where <strong>the</strong> concentration was decreasing, i.e., <strong>the</strong> maximum was<br />
closer <strong>to</strong> <strong>the</strong> source than any of <strong>the</strong> arcs.<br />
• It is observed (Gryning and Tassone, 1994) that measured values<br />
of are smaller than predictions by <strong>the</strong>ory.<br />
w<br />
• The computed heat flux values may not be representative for a<br />
greater area.<br />
• When using <strong>the</strong> enclosed <strong>to</strong>ols, pay attention <strong>to</strong> <strong>the</strong> format used<br />
for time. E.g., 1417 means 14:17 – whereas Kincaid and<br />
Indianapolis data are given for integer values of hour.<br />
Lillestrøm<br />
Pay attention <strong>to</strong> <strong>the</strong> following problems when using data from<br />
Lillestrøm:<br />
• The averaging period is only 15 minutes for <strong>the</strong> tracer data.<br />
Concentration averages taken over longer time will tend <strong>to</strong> be<br />
smaller than those registered, due <strong>to</strong> meandering.<br />
• There was generally very light wind during <strong>the</strong> experiments.<br />
• u *<br />
was recorded as zero for <strong>the</strong> experiment with <strong>the</strong> highest<br />
concentrations.<br />
• In <strong>the</strong> data set, stability category has been computed based upon<br />
<strong>the</strong> original method by Turner (1964). This is consistent with <strong>the</strong><br />
method used for <strong>the</strong> o<strong>the</strong>r data sets, but it does not very well take<br />
account of Norwegian winter conditions with snow-covered<br />
ground.<br />
• Pay attention <strong>to</strong> <strong>the</strong> time format, which is a four-digit format like<br />
that of Copenhagen (e.g. 1030 for 10:30).<br />
Indianapolis<br />
Pay attention <strong>to</strong> <strong>the</strong> following problems when using data from<br />
Indianapolis:<br />
15