User's Guide to the Model Validation Kit - Harmonisation within ...
User's Guide to the Model Validation Kit - Harmonisation within ...
User's Guide to the Model Validation Kit - Harmonisation within ...

Create successful ePaper yourself
Turn your PDF publications into a flip-book with our unique Google optimized e-Paper software.
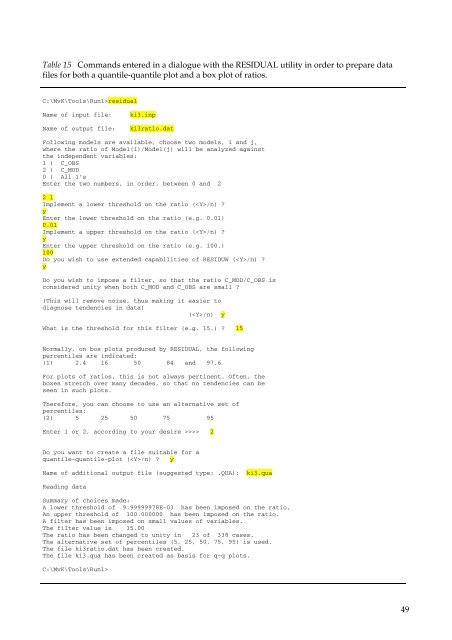
Table 15 Commands entered in a dialogue with <strong>the</strong> RESIDUAL utility in order <strong>to</strong> prepare data<br />
files for both a quantile-quantile plot and a box plot of ratios.<br />
C:\MvK\Tools\Run1>residual<br />
Name of input file:<br />
Name of output file:<br />
ki3.inp<br />
ki3ratio.dat<br />
Following models are available, choose two models, i and j,<br />
where <strong>the</strong> ratio of <strong>Model</strong>(i)/<strong>Model</strong>(j) will be analyzed against<br />
<strong>the</strong> independent variables:<br />
1 ) C_OBS<br />
2 ) C_MOD<br />
0 ) All 1’s<br />
Enter <strong>the</strong> two numbers, in order, between 0 and 2<br />
2 1<br />
Implement a lower threshold on <strong>the</strong> ratio (/n) ?<br />
y<br />
Enter <strong>the</strong> lower threshold on <strong>the</strong> ratio (e.g. 0.01)<br />
0.01<br />
Implement a upper threshold on <strong>the</strong> ratio (/n) ?<br />
y<br />
Enter <strong>the</strong> upper threshold on <strong>the</strong> ratio (e.g. 100.)<br />
100<br />
Do you wish <strong>to</strong> use extended capabilities of RESIDUW (/n) ?<br />
y<br />
Do you wish <strong>to</strong> impose a filter, so that <strong>the</strong> ratio C_MOD/C_OBS is<br />
considered unity when both C_MOD and C_OBS are small ?<br />
(This will remove noise, thus making it easier <strong>to</strong><br />
diagnose tendencies in data)<br />
(/n) y<br />
What is <strong>the</strong> threshold for this filter (e.g. 15.) ? 15<br />
Normally, on box plots produced by RESIDUAL, <strong>the</strong> following<br />
percentiles are indicated:<br />
(1) 2.4 16 50 84 and 97.6<br />
For plots of ratios, this is not always pertinent. Often, <strong>the</strong><br />
boxes stretch over many decades, so that no tendencies can be<br />
seen in such plots.<br />
Therefore, you can choose <strong>to</strong> use an alternative set of<br />
percentiles:<br />
(2) 5 25 50 75 95<br />
Enter 1 or 2, according <strong>to</strong> your desire >>>> 2<br />
Do you want <strong>to</strong> create a file suitable for a<br />
quantile-quantile-plot (/n) ? y<br />
Name of additional output file (suggested type: .QUA): ki3.qua<br />
Reading data<br />
Summary of choices made:<br />
A lower threshold of 9.99999978E-03 has been imposed on <strong>the</strong> ratio,<br />
An upper threshold of 100.000000 has been imposed on <strong>the</strong> ratio.<br />
A filter has been imposed on small values of variables.<br />
The filter value is 15.00<br />
The ratio has been changed <strong>to</strong> unity in 23 of 338 cases.<br />
The alternative set of percentiles (5, 25, 50, 75, 95) is used.<br />
The file ki3ratio.dat has been created.<br />
The file ki3.qua has been created as basis for q-q plots.<br />
C:\MvK\Tools\Run1><br />
49