User's Guide to the Model Validation Kit - Harmonisation within ...
User's Guide to the Model Validation Kit - Harmonisation within ...
User's Guide to the Model Validation Kit - Harmonisation within ...

You also want an ePaper? Increase the reach of your titles
YUMPU automatically turns print PDFs into web optimized ePapers that Google loves.
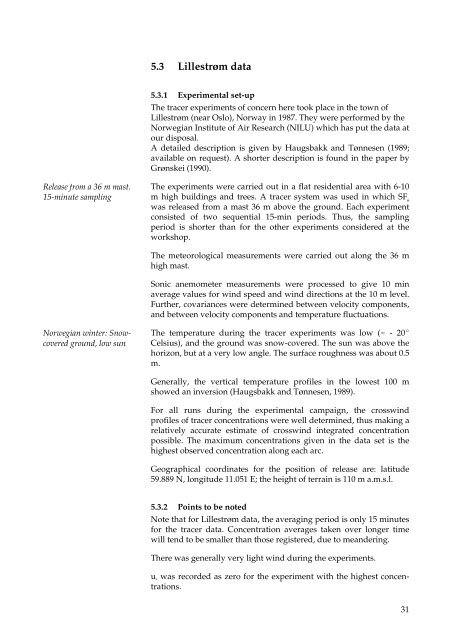
5.3 Lillestrøm data<br />
5.3.1 Experimental set-up<br />
The tracer experiments of concern here <strong>to</strong>ok place in <strong>the</strong> <strong>to</strong>wn of<br />
Lillestrøm (near Oslo), Norway in 1987. They were performed by <strong>the</strong><br />
Norwegian Institute of Air Research (NILU) which has put <strong>the</strong> data at<br />
our disposal.<br />
A detailed description is given by Haugsbakk and Tønnesen (1989;<br />
available on request). A shorter description is found in <strong>the</strong> paper by<br />
Grønskei (1990).<br />
Release from a 36 m mast.<br />
15-minute sampling<br />
The experiments were carried out in a flat residential area with 6-10<br />
m high buildings and trees. A tracer system was used in which SF 6<br />
was released from a mast 36 m above <strong>the</strong> ground. Each experiment<br />
consisted of two sequential 15-min periods. Thus, <strong>the</strong> sampling<br />
period is shorter than for <strong>the</strong> o<strong>the</strong>r experiments considered at <strong>the</strong><br />
workshop.<br />
The meteorological measurements were carried out along <strong>the</strong> 36 m<br />
high mast.<br />
Sonic anemometer measurements were processed <strong>to</strong> give 10 min<br />
average values for wind speed and wind directions at <strong>the</strong> 10 m level.<br />
Fur<strong>the</strong>r, covariances were determined between velocity components,<br />
and between velocity components and temperature fluctuations.<br />
Norwegian winter: Snowcovered<br />
ground, low sun<br />
The temperature during <strong>the</strong> tracer experiments was low ( - 20(<br />
Celsius), and <strong>the</strong> ground was snow-covered. The sun was above <strong>the</strong><br />
horizon, but at a very low angle. The surface roughness was about 0.5<br />
m.<br />
Generally, <strong>the</strong> vertical temperature profiles in <strong>the</strong> lowest 100 m<br />
showed an inversion (Haugsbakk and Tønnesen, 1989).<br />
For all runs during <strong>the</strong> experimental campaign, <strong>the</strong> crosswind<br />
profiles of tracer concentrations were well determined, thus making a<br />
relatively accurate estimate of crosswind integrated concentration<br />
possible. The maximum concentrations given in <strong>the</strong> data set is <strong>the</strong><br />
highest observed concentration along each arc.<br />
Geographical coordinates for <strong>the</strong> position of release are: latitude<br />
59.889 N, longitude 11.051 E; <strong>the</strong> height of terrain is 110 m a.m.s.l.<br />
5.3.2 Points <strong>to</strong> be noted<br />
Note that for Lillestrøm data, <strong>the</strong> averaging period is only 15 minutes<br />
for <strong>the</strong> tracer data. Concentration averages taken over longer time<br />
will tend <strong>to</strong> be smaller than those registered, due <strong>to</strong> meandering.<br />
There was generally very light wind during <strong>the</strong> experiments.<br />
u *<br />
was recorded as zero for <strong>the</strong> experiment with <strong>the</strong> highest concentrations.<br />
31