Annual Report 2011-2012 - HCL Infosystems
Annual Report 2011-2012 - HCL Infosystems
Annual Report 2011-2012 - HCL Infosystems

You also want an ePaper? Increase the reach of your titles
YUMPU automatically turns print PDFs into web optimized ePapers that Google loves.
ANNUAL REPORT <strong>2011</strong>-12<br />
(ii)<br />
• Mr. Neeraj Jaitley 12000 -<br />
• Mr. Kaushik Mitra - 4000<br />
• Mr. A.P.S. Bedi 18000 6500<br />
• Mr. Vivek Punekar 14500 5500<br />
• Mr. Sushil Kumar Jain - 2500<br />
Employees holding 5% or more of the total<br />
number of options granted during the year :<br />
• Mr. Gautam Advani - 20000<br />
• Mr. Princy Bhatnagar - 10000<br />
• Mr. M. Chandrasekaran - 7000<br />
• Mr. Sayantan Nandi 10000 -<br />
• Mr. Rajeev Tupsakri 6000 -<br />
• Mr. Neeraj Jaitley 12000 -<br />
• Mr. Kaushik Mitra - 4000<br />
(iii) Identified employees who were granted options during any<br />
one year equal to or exceeding 1% of the issued capital<br />
(excluding outstanding warrants and conversions) of the<br />
Company at the time of grant NIL NIL<br />
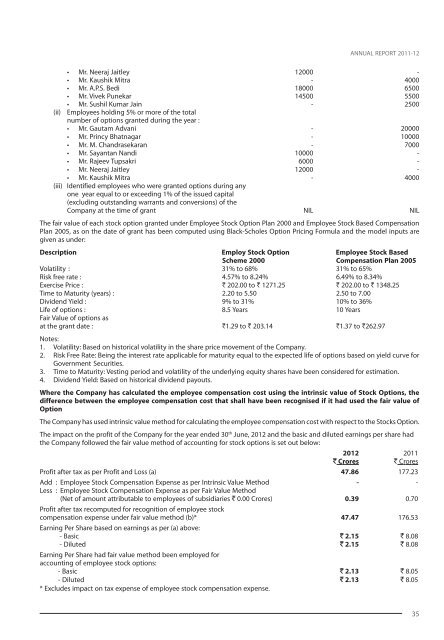
The fair value of each stock option granted under Employee Stock Option Plan 2000 and Employee Stock Based Compensation<br />
Plan 2005, as on the date of grant has been computed using Black-Scholes Option Pricing Formula and the model inputs are<br />
given as under:<br />
Description Employ Stock Option Employee Stock Based<br />
Scheme 2000 Compensation Plan 2005<br />
Volatility : 31% to 68% 31% to 65%<br />
Risk free rate : 4.57% to 8.24% 6.49% to 8.34%<br />
Exercise Price : ` 202.00 to ` 1271.25 ` 202.00 to ` 1348.25<br />
Time to Maturity (years) : 2.20 to 5.50 2.50 to 7.00<br />
Dividend Yield : 9% to 31% 10% to 36%<br />
Life of options : 8.5 Years 10 Years<br />
Fair Value of options as<br />
at the grant date : `1.29 to ` 203.14 `1.37 to `262.97<br />
Notes:<br />
1. Volatility: Based on historical volatility in the share price movement of the Company.<br />
2. Risk Free Rate: Being the interest rate applicable for maturity equal to the expected life of options based on yield curve for<br />
Government Securities.<br />
3. Time to Maturity: Vesting period and volatility of the underlying equity shares have been considered for estimation.<br />
4. Dividend Yield: Based on historical dividend payouts.<br />
Where the Company has calculated the employee compensation cost using the intrinsic value of Stock Options, the<br />
difference between the employee compensation cost that shall have been recognised if it had used the fair value of<br />
Option<br />
The Company has used intrinsic value method for calculating the employee compensation cost with respect to the Stocks Option.<br />
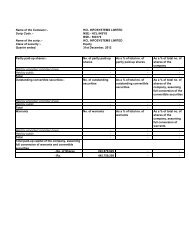
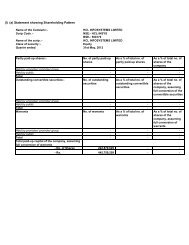
The impact on the profit of the Company for the year ended 30 th June, <strong>2012</strong> and the basic and diluted earnings per share had<br />
the Company followed the fair value method of accounting for stock options is set out below:<br />
<strong>2012</strong> <strong>2011</strong><br />
` Crores ` Crores<br />
Profit after tax as per Profit and Loss (a) 47.86 177.23<br />
Add : Employee Stock Compensation Expense as per Intrinsic Value Method - -<br />
Less : Employee Stock Compensation Expense as per Fair Value Method<br />
(Net of amount attributable to employees of subsidiaries ` 0.00 Crores) 0.39 0.70<br />
Profit after tax recomputed for recognition of employee stock<br />
compensation expense under fair value method (b)* 47.47 176.53<br />
Earning Per Share based on earnings as per (a) above:<br />
- Basic ` 2.15 ` 8.08<br />
- Diluted ` 2.15 ` 8.08<br />
Earning Per Share had fair value method been employed for<br />
accounting of employee stock options:<br />
- Basic ` 2.13 ` 8.05<br />
- Diluted ` 2.13 ` 8.05<br />
* Excludes impact on tax expense of employee stock compensation expense.<br />
35