Hampton Roads Regional Bridge Study
Hampton Roads Regional Bridge Study
Hampton Roads Regional Bridge Study

Create successful ePaper yourself
Turn your PDF publications into a flip-book with our unique Google optimized e-Paper software.
SUFFICIENCY RATING 33<br />
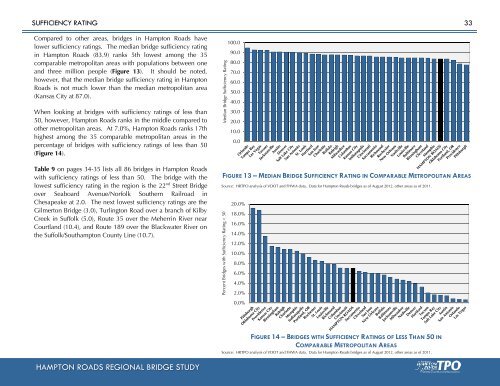
Compared to other areas, bridges in <strong>Hampton</strong> <strong>Roads</strong> have<br />
lower sufficiency ratings. The median bridge sufficiency rating<br />
in <strong>Hampton</strong> <strong>Roads</strong> (83.9) ranks 5th lowest among the 35<br />
comparable metropolitan areas with populations between one<br />
and three million people (Figure 13). It should be noted,<br />
however, that the median bridge sufficiency rating in <strong>Hampton</strong><br />
<strong>Roads</strong> is not much lower than the median metropolitan area<br />
(Kansas City at 87.0).<br />
When looking at bridges with sufficiency ratings of less than<br />
50, however, <strong>Hampton</strong> <strong>Roads</strong> ranks in the middle compared to<br />
other metropolitan areas. At 7.0%, <strong>Hampton</strong> <strong>Roads</strong> ranks 17th<br />
highest among the 35 comparable metropolitan areas in the<br />
percentage of bridges with sufficiency ratings of less than 50<br />
(Figure 14).<br />
Table 9 on pages 34-35 lists all 86 bridges in <strong>Hampton</strong> <strong>Roads</strong><br />
with sufficiency ratings of less than 50. The bridge with the<br />
lowest sufficiency rating in the region is the 22 nd Street <strong>Bridge</strong><br />
over Seaboard Avenue/Norfolk Southern Railroad in<br />
Chesapeake at 2.0. The next lowest sufficiency ratings are the<br />
Gilmerton <strong>Bridge</strong> (3.0), Turlington Road over a branch of Kilby<br />
Creek in Suffolk (5.0), Route 35 over the Meherrin River near<br />
Courtland (10.4), and Route 189 over the Blackwater River on<br />
the Suffolk/Southampton County Line (10.7).<br />
Median <strong>Bridge</strong> Sufficiency Rating<br />
Percent <strong>Bridge</strong>s with Sufficiency Rating < 50<br />
100.0<br />
90.0<br />
80.0<br />
70.0<br />
60.0<br />
50.0<br />
40.0<br />
30.0<br />
20.0<br />
10.0<br />
0.0<br />
FIGURE 13 – MEDIAN BRIDGE SUFFICIENCY RATING IN COMPARABLE METROPOLITAN AREAS<br />
Source: HRTPO analysis of VDOT and FHWA data. Data for <strong>Hampton</strong> <strong>Roads</strong> bridges as of August 2012, other areas as of 2011.<br />
20.0%<br />
18.0%<br />
16.0%<br />
14.0%<br />
12.0%<br />
10.0%<br />
8.0%<br />
6.0%<br />
4.0%<br />
2.0%<br />
0.0%<br />
FIGURE 14 – BRIDGES WITH SUFFICIENCY RATINGS OF LESS THAN 50 IN<br />
COMPARABLE METROPOLITAN AREAS<br />
Source: HRTPO analysis of VDOT and FHWA data. Data for <strong>Hampton</strong> <strong>Roads</strong> bridges as of August 2012, other areas as of 2011.<br />
HAMPTON James City/Williamsburg/York ROADS REGIONAL Transportation BRIDGE STUDY <strong>Study</strong>