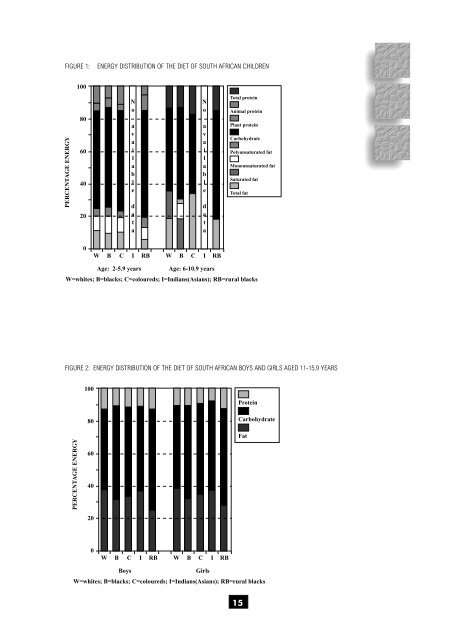
<strong>of</strong> whites, Indians and coloureds. Young adult men and women (aged 16-24.9 years) had <strong>the</strong> highest fat intakes. The mean ratios between saturated, mono-unsaturated and polyunsaturated fats are illustrated in Figures 1 to 4. The diet <strong>of</strong> whites had <strong>the</strong> lowest P/S ratio, while those <strong>of</strong> <strong>the</strong> Indians and rural blacks exceeded 1.0, indicating <strong>the</strong> liberal use <strong>of</strong> plant oils in <strong>the</strong> cooking <strong>of</strong> food. 3.3.5 CHOLESTEROL INTAKES Information obtained by <strong>the</strong> 24-hour recall method (Table 49(a)) showed that except for white and coloured adult men, all groups had cholesterol intakes which fell within <strong>the</strong> dietary guidelines. Studies which used o<strong>the</strong>r methods found high (> 300 mg/day) intakes also in Indian men and white and coloured women. 3.3.6 TOTAL CARBOHYDRATE INTAKES Mean total carbohydrate intakes (Tables 5 (a), (b), (c)) and percentage contribution to total energy intake (Figures 1 to 4) <strong>of</strong> blacks and coloureds were higher than those <strong>of</strong> <strong>the</strong> Indians and whites. In all age and gender groups, where comparative data were available, rural blacks had relatively greater carbohydrate intakes, illustrating <strong>the</strong> expected change in intake during urbanisation (Gross & Monteiro, 1989; Popkin, 1994). No data on starch and o<strong>the</strong>r saccharides are available. It is suspected that traditional preparation and cooking methods <strong>of</strong> maize, <strong>the</strong> staple food <strong>of</strong> black and some coloured groups, could result in formation <strong>of</strong> resistant starch, which has putative beneficial health effects (Venter et al., 1990). 3.3.7 DIETARY FIBRE INTAKES The fibre hypo<strong>the</strong>sis states that high fibre intakes help to protect against <strong>the</strong> development <strong>of</strong> chronic diseases <strong>of</strong> lifestyle. The hypo<strong>the</strong>sis was formulated after observations that Africans with high fibre intakes had low prevalences <strong>of</strong> <strong>the</strong>se diseases (reviewed by Vorster, 1994). Tables 51 (a), (b) and (c) show that many <strong>of</strong> <strong>the</strong> urban and rural black groups had relatively low fibre intakes compared to those <strong>of</strong> whites, coloureds and Indians. It seems, <strong>the</strong>refore, that present differences in prevalences <strong>of</strong> specific chronic diseases <strong>of</strong> lifestyle in <strong>the</strong> different ethnic groups could not have been caused only by differences in fibre intakes. Except for <strong>the</strong> one study on 95 rural Zulu women (De Villiers, 1988), <strong>the</strong> 24 hour recall method gave lower intakes than <strong>the</strong> “o<strong>the</strong>r” methods. With <strong>the</strong>se “o<strong>the</strong>r” methods, intakes which met dietary guidelines <strong>of</strong> 25 to 30 g/day, were measured in several groups, while with <strong>the</strong> 24-hour recall only one <strong>of</strong> <strong>the</strong> 35 groups met <strong>the</strong>se guidelines. Clearly, many South Africans are following fibre deficient diets. 3.3.8 SUGAR INTAKES Mean sugar intakes appear in Tables 52 (a) and (b). Rural blacks had <strong>the</strong> lowest intakes. Young white men, urban black men and women, as well as adult coloured men and women had <strong>the</strong> highest intakes. The value <strong>of</strong> 155 g measured with “o<strong>the</strong>r” methods in coloured men aged 25 to 64.9 years, would mean approximately 30 teaspoons (5 g) <strong>of</strong> added sugar per day! 3.3.9 CALCIUM INTAKES Tables 53 (a), (b) and (c) compare calcium intakes with <strong>the</strong> USA RDA’s for calcium. The United Kingdom (Department <strong>of</strong> <strong>Health</strong>) revised <strong>the</strong>ir Dietary Reference Values (DRV’s) in 1991. Their lower reference nutrient intakes (LRNI), which are 2 SD below <strong>the</strong> estimated average requirement (EAR) which assumes normal distribution <strong>of</strong> variability (Garrow & James, 1993), are also given in <strong>the</strong> tables. Both LRNI and EAR are much lower than <strong>the</strong> RDA’s. If compared with <strong>the</strong> RDA’s, only <strong>the</strong> children between 0 and 1.9 years and white, coloured and Indian children 2 to 5.9 years met <strong>the</strong>ir calcium requirements. If compared to <strong>the</strong> LRNI, data collected with <strong>the</strong> 24-hour recall method show that all <strong>the</strong> rural black groups as well as black, coloured and Indian women did not even reach <strong>the</strong>se lowest recommendations. The low calcium intakes are in agreement with many reports on low milk intakes <strong>of</strong> South Africans, especially Africans. Possible reasons are influences from previous cultural habits and taboos regarding milk consumption, lactose intolerance (which is high in Africans), as well as price. Milk and milk products are relatively expensive commodities. Despite <strong>the</strong>se low intakes, <strong>the</strong> prevalence <strong>of</strong> osteoporosis in black women is still much lower than in white women (Walker, 1981). 14
FIGURE 1: ENERGY DISTRIBUTION OF THE DIET OF SOUTH AFRICAN CHILDREN 100 PERCENTAGE ENERGY 80 60 40 20 N o a v a i l a b l e d a t a N o a v a i l a b l e d a t a Total protein Animal protein Plant protein Carbohydrate Polyunsaturated fat Monounsaturated fat Saturated fat Total fat 0 W B C I RB W B C I RB Age: 2-5.9 years Age: 6-10.9 years W=whites; B=blacks; C=coloureds; I=Indians(Asians); RB=rural blacks FIGURE 2: ENERGY DISTRIBUTION OF THE DIET OF SOUTH AFRICAN BOYS AND GIRLS AGED 11-15.9 YEARS 100 Protein PERCENTAGE ENERGY 80 60 40 20 Carbohydrate Fat 0 W B C I RB W B C I RB Boys Girls W=whites; B=blacks; C=coloureds; I=Indians(Asians); RB=rural blacks 15
- Page 2 and 3: THE NUTRITIONAL STATUS OF SOUTH AFR
- Page 4 and 5: PREFACE In this review, the Nutriti
- Page 6 and 7: 6. Recommendations It is suggested
- Page 8 and 9: CHAPTER 4 DETERMINANTS OF NUTRITION
- Page 10 and 11: 1.3 EVALUATION OF NUTRITIONAL STATU
- Page 13 and 14: RESULTS CHAPTER 3 3.1 ANTHROPOMETRY
- Page 15 and 16: distributions of weight-for-age and
- Page 17 and 18: Table 17 shows that the Northern Ca
- Page 19 and 20: Table 31 indicates that urban black
- Page 21: 3.3 NUTRIENT INTAKES 3.3.1 INTRODUC
- Page 25 and 26: 3.3.10 IRON INTAKES Tables 54 (a),
- Page 27 and 28: McLaren et al., 1993). In South Afr
- Page 29 and 30: CHAPTER 4 DETERMINANTS OF NUTRITION
- Page 31 and 32: Not many studies examined the direc
- Page 33 and 34: The complexity of the effects of ur
- Page 35: 4.3.10 ALCOHOL INTAKE Moderate drin
- Page 38 and 39: 5.5 Black South Africans Traditiona
- Page 40 and 41: 6.2.2 PRIMARY SCHOOL CHILDREN Preva
- Page 42 and 43: References Agenbag S, Matthée V. 1
- Page 44 and 45: Coovadia HM. 1993. Overview of maln
- Page 46 and 47: Ijsselmuiden CB. 1984. Nutritional
- Page 48 and 49: May J, Carter M, Posel D. 1995. The
- Page 50 and 51: Richter LM. 1993. Malnutrition and
- Page 52 and 53: Steyn NP, Wicht CL, Rossouw JE, Van
- Page 54 and 55: Walker ARP, Walker BF, Duvenhage A,