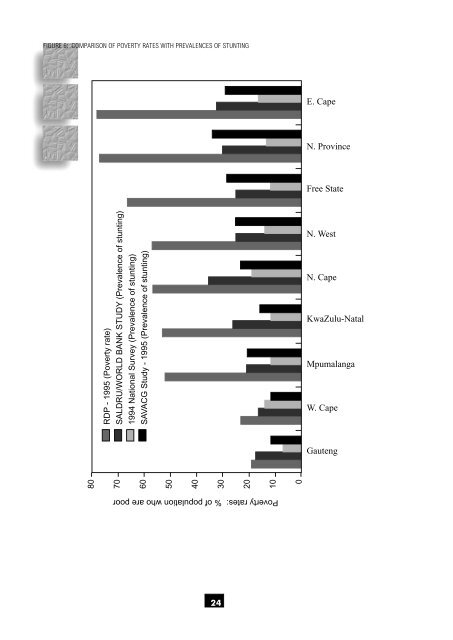
FIGURE 6: COMPARISON OF POVERTY RATES WITH PREVALENCES OF STUNTING E. Cape N. Province Free State 80 70 60 50 40 30 20 10 0 RDP - 1995 (Poverty rate) SALDRU/WORLD BANK STUDY (Prevalence <strong>of</strong> stunting) 1994 National Survey (Prevalence <strong>of</strong> stunting) SAVACG Study - 1995 (Prevalence <strong>of</strong> stunting) N. West N. Cape KwaZulu-Natal Mpumalanga W. Cape Gauteng Poverty rates: % <strong>of</strong> population who are poor 24
The complexity <strong>of</strong> <strong>the</strong> effects <strong>of</strong> urbanisation on <strong>nutritional</strong> <strong>status</strong> is fur<strong>the</strong>r demonstrated by Bourne et al. (1993) who showed in <strong>the</strong> BRISK study (n=983 adult Africans, aged 15-64 years from <strong>the</strong> Cape Peninsula) that although <strong>the</strong> subjects followed a prudent diet regarding fat and carbohydrate intake, <strong>the</strong>ir diet was low in fibre, vitamins and minerals. Compared with rural Africans, <strong>the</strong>ir diet was in a transition phase towards a progressively a<strong>the</strong>rogenic diet. The study <strong>of</strong> Jooste et al. (1990) described <strong>the</strong> same trends. Ndlovu (1983) identified <strong>the</strong> disrupting effect <strong>of</strong> urbanisation on <strong>the</strong> family unit and family life as a contributing cause <strong>of</strong> malnutrition. Urbanisation, and especially migration <strong>of</strong> men from <strong>the</strong> rural areas to earn money in urban areas, has led to broken homes and destitution with consequent malnutrition in <strong>the</strong> rural areas (Westcott & Stott, 1977). Gericke et al. (1987) in <strong>the</strong>ir studies on urban and rural Vendas, found that urbanisation with its accompanying westernisation and acculturation is a two-way process during which urban influences also spread into <strong>the</strong> rural areas. 4.3.4 FAMILY UNITY AND COHESION As mentioned above, urbanisation and migration, but also o<strong>the</strong>r factors, could lead to changes in family structures. The impact <strong>of</strong> <strong>the</strong> low social <strong>status</strong> <strong>of</strong> many South African women has not been studied, but several studies have identified family unity to be a major contributor to undernutrition, especially in children. Westcott & Stott (1977), Fincham (1982), Ndlovu (1983), Krynauw et al. (1983), Molteno & Kibel (1989), Howard (1990) and Sive et al. (1993) all found that children who came from disrupted family units and broken homes with less support from <strong>the</strong> fa<strong>the</strong>r and exposed to more social problems were more likely to be undernourished than children from stable, cohesive families. It seems that <strong>the</strong> extended families <strong>of</strong>ten seen in some communities provide a social support network that contributes to prevention <strong>of</strong> undernutrition. Child care competencies and arrangements are major determinants <strong>of</strong> <strong>nutritional</strong> <strong>status</strong> and sharing <strong>the</strong>se responsibilities obviously influences <strong>the</strong> <strong>nutritional</strong> <strong>status</strong> <strong>of</strong> children. 4.3.5 PHYSICAL ENVIRONMENT The standard <strong>of</strong> housing, occupational density, access to clean and safe water and sanitation, and easy cooking and refrigeration facilities have been identified in several studies as contributors to malnutrition (Fincham, 1982; Krynauw et al., 1983; Molteno & Kibel, 1989; Howard, 1990; Sive et al., 1993). However, two <strong>of</strong> <strong>the</strong>se studies (Howard, 1990; Sive et al., 1993) found that <strong>the</strong> number <strong>of</strong> people in <strong>the</strong> household and displacement by a younger sibling did not necessarily contribute to risk <strong>of</strong> malnutrition. 4.3.6 PREGNANCY Repeated pregnancies may jeopardise <strong>nutritional</strong> <strong>status</strong> <strong>of</strong> both mo<strong>the</strong>r and child, but especially <strong>of</strong> <strong>the</strong> mo<strong>the</strong>r. The total fertility rate in South Africa is high at 4.1 (RDP, 1995). It can <strong>the</strong>refore be expected that repeated pregnancies could play a role as determinant <strong>of</strong> <strong>nutritional</strong> <strong>status</strong> in South African women. Pregnant women have a high risk for developing iron deficiency anaemia. The global prevalence is 51 % and <strong>the</strong> World <strong>Health</strong> Organisation, <strong>the</strong>refore, advocates <strong>the</strong> use <strong>of</strong> iron supplements in developing countries during <strong>the</strong> second half <strong>of</strong> pregnancy (De Mayer et al., 1989). The need for this has, however, been questioned (Ross et al., 1981). Table 75 summarises reported prevalences <strong>of</strong> iron deficient anaemia in pregnant coloured and African women. Kruger et al. (1994) found that in <strong>the</strong> coloured women, primigravidas <strong>of</strong> 18-22 years <strong>of</strong> age who were unemployed, single and not related to <strong>the</strong> household head, were at <strong>the</strong> greatest risk for developing anaemia. Except for <strong>the</strong> study on <strong>the</strong> Gazankulu women (Baynes et al., 1986) which showed a higher prevalence <strong>of</strong> folate than iron deficiency, <strong>the</strong> o<strong>the</strong>r studies reported adequate folate and vitamin B12 <strong>status</strong>. Most authors agree that blanket iron supplements are justified during pregnancy, especially in <strong>the</strong> 3rd trimester in women from a poor socio-economic background. Baynes et al. (1986) also recommend folate supplementation in <strong>the</strong> form <strong>of</strong> <strong>the</strong> fortification <strong>of</strong> maize meal with folic acid. Vitamin A fortification may also be indicated. Fairney et al. (1987) reported that vitamin A <strong>status</strong> <strong>of</strong> rural black mo<strong>the</strong>rs and <strong>the</strong>ir babies was low. Vitamin D <strong>status</strong>, measured as 25-hydroxy-vitamin D, was adequate, suggesting that actinic syn<strong>the</strong>sis maintained Vitamin D <strong>status</strong>. 25
- Page 2 and 3: THE NUTRITIONAL STATUS OF SOUTH AFR
- Page 4 and 5: PREFACE In this review, the Nutriti
- Page 6 and 7: 6. Recommendations It is suggested
- Page 8 and 9: CHAPTER 4 DETERMINANTS OF NUTRITION
- Page 10 and 11: 1.3 EVALUATION OF NUTRITIONAL STATU
- Page 13 and 14: RESULTS CHAPTER 3 3.1 ANTHROPOMETRY
- Page 15 and 16: distributions of weight-for-age and
- Page 17 and 18: Table 17 shows that the Northern Ca
- Page 19 and 20: Table 31 indicates that urban black
- Page 21 and 22: 3.3 NUTRIENT INTAKES 3.3.1 INTRODUC
- Page 23 and 24: FIGURE 1: ENERGY DISTRIBUTION OF TH
- Page 25 and 26: 3.3.10 IRON INTAKES Tables 54 (a),
- Page 27 and 28: McLaren et al., 1993). In South Afr
- Page 29 and 30: CHAPTER 4 DETERMINANTS OF NUTRITION
- Page 31: Not many studies examined the direc
- Page 35: 4.3.10 ALCOHOL INTAKE Moderate drin
- Page 38 and 39: 5.5 Black South Africans Traditiona
- Page 40 and 41: 6.2.2 PRIMARY SCHOOL CHILDREN Preva
- Page 42 and 43: References Agenbag S, Matthée V. 1
- Page 44 and 45: Coovadia HM. 1993. Overview of maln
- Page 46 and 47: Ijsselmuiden CB. 1984. Nutritional
- Page 48 and 49: May J, Carter M, Posel D. 1995. The
- Page 50 and 51: Richter LM. 1993. Malnutrition and
- Page 52 and 53: Steyn NP, Wicht CL, Rossouw JE, Van
- Page 54 and 55: Walker ARP, Walker BF, Duvenhage A,