Implementing an Integrated Nutrition Programme - Health Systems ...
Implementing an Integrated Nutrition Programme - Health Systems ...
Implementing an Integrated Nutrition Programme - Health Systems ...

Create successful ePaper yourself
Turn your PDF publications into a flip-book with our unique Google optimized e-Paper software.
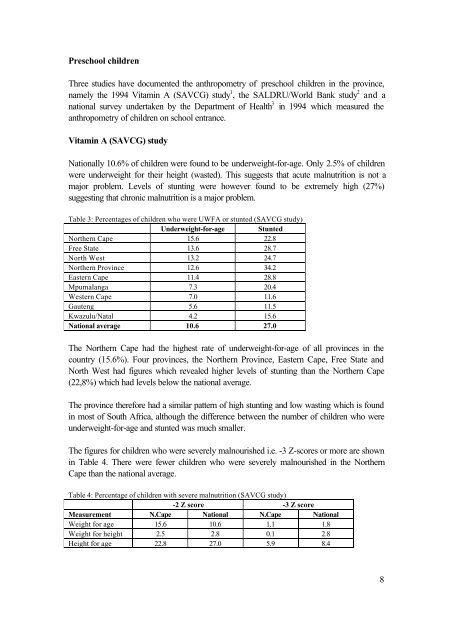
Preschool children<br />
Three studies have documented the <strong>an</strong>thropometry of preschool children in the province,<br />
namely the 1994 Vitamin A (SAVCG) study 1 , the SALDRU/World B<strong>an</strong>k study 2 <strong>an</strong>d a<br />
national survey undertaken by the Department of <strong>Health</strong> 3 in 1994 which measured the<br />
<strong>an</strong>thropometry of children on school entr<strong>an</strong>ce.<br />
Vitamin A (SAVCG) study<br />
Nationally 10.6% of children were found to be underweight-for-age. Only 2.5% of children<br />
were underweight for their height (wasted). This suggests that acute malnutrition is not a<br />
major problem. Levels of stunting were however found to be extremely high (27%)<br />
suggesting that chronic malnutrition is a major problem.<br />
Table 3: Percentages of children who were UWFA or stunted (SAVCG study)<br />
Underweight-for-age Stunted<br />
Northern Cape 15.6 22.8<br />
Free State 13.6 28.7<br />
North West 13.2 24.7<br />
Northern Province 12.6 34.2<br />
Eastern Cape 11.4 28.8<br />
Mpumal<strong>an</strong>ga 7.3 20.4<br />
Western Cape 7.0 11.6<br />
Gauteng 5.6 11.5<br />
Kwazulu/Natal 4.2 15.6<br />
National average 10.6 27.0<br />
The Northern Cape had the highest rate of underweight-for-age of all provinces in the<br />
country (15.6%). Four provinces, the Northern Province, Eastern Cape, Free State <strong>an</strong>d<br />
North West had figures which revealed higher levels of stunting th<strong>an</strong> the Northern Cape<br />
(22,8%) which had levels below the national average.<br />
The province therefore had a similar pattern of high stunting <strong>an</strong>d low wasting which is found<br />
in most of South Africa, although the difference between the number of children who were<br />
underweight-for-age <strong>an</strong>d stunted was much smaller.<br />
The figures for children who were severely malnourished i.e. -3 Z-scores or more are shown<br />
in Table 4. There were fewer children who were severely malnourished in the Northern<br />
Cape th<strong>an</strong> the national average.<br />
Table 4: Percentage of children with severe malnutrition (SAVCG study)<br />
-2 Z score -3 Z score<br />
Measurement N.Cape National N.Cape National<br />
Weight for age 15.6 10.6 1.1 1.8<br />
Weight for height 2.5 2.8 0.1 2.8<br />
Height for age 22.8 27.0 5.9 8.4<br />
8