The Reliability and Validity of Management/Impact® (M/I) - Human ...
The Reliability and Validity of Management/Impact® (M/I) - Human ...
The Reliability and Validity of Management/Impact® (M/I) - Human ...

You also want an ePaper? Increase the reach of your titles
YUMPU automatically turns print PDFs into web optimized ePapers that Google loves.
MANAGEMENT/IMPACT (M/I)<br />
humansynergistics.com<br />
<strong>The</strong> <strong>Reliability</strong> <strong>and</strong> <strong>Validity</strong> <strong>of</strong><br />
<strong>Management</strong>/Impact ® (M/I)<br />
Prepared by Janet L. Szumal, Ph.D.<br />
INTRODUCTION<br />
This report presents the results <strong>of</strong> reliability <strong>and</strong> validity analyses carried out on client <strong>Management</strong>/Impact (M/I) 1<br />
data from <strong>Human</strong> Synergistics (HS) <strong>of</strong>fices located in the United States, Australia, Canada, New Zeal<strong>and</strong>, the United<br />
Kingdom, <strong>and</strong> other European countries. 2 <strong>The</strong> Self-Reports <strong>of</strong> 650 managers from around the world along with the<br />
descriptions by 4,356 other people with whom they work (higher-level managers, peers, <strong>and</strong> direct reports) enabled<br />
us to examine the inventory’s psychometric properties. <strong>The</strong> data also provided an opportunity to generate a new set <strong>of</strong><br />
norms for M/I. <strong>The</strong> new norms are not substantially different from the original (which were based on 220 managers)<br />
but enable recipients <strong>of</strong> the feedback to compare their results to a larger <strong>and</strong> more diverse sample.<br />
<strong>The</strong> data are based on the English version <strong>of</strong> the inventory. <strong>The</strong> number <strong>of</strong> cases provided by each <strong>of</strong> the HS <strong>of</strong>fices is<br />
summarized in the table below.<br />
Table 1: Number <strong>of</strong> Cases Provided by Each HS Office<br />
Office Location<br />
Number <strong>of</strong> Cases Provided<br />
USA 174<br />
Australia 166<br />
Canada 167<br />
United Kingdom* 109<br />
Other European Countries 11<br />
New Zeal<strong>and</strong> 23<br />
Total 650<br />
*47 cases were from organizations located in the Middle East.<br />
Over two thirds <strong>of</strong> the focal managers in the total sample were in first- to middle-level management positions, most had been<br />
in their current positions for at least a year, <strong>and</strong> the majority held a bachelor’s or higher-level degree. Sixty-five percent <strong>of</strong> the<br />
focal individuals were male. Forty-six percent <strong>of</strong> those who described the managers were either direct reports or reported to<br />
someone below them; the rest were peers <strong>and</strong> associates, the person to whom the manager directly reported, <strong>and</strong> other highlevel<br />
managers. <strong>The</strong> majority <strong>of</strong> the people describing the managers reported having daily contact with them (58 percent) <strong>and</strong><br />
had known them for at least one year (82 percent).<br />
1<br />
Szumal, J. L. & Cooke, R. A. (2008). <strong>Management</strong>/Impact. Plymouth, MI: <strong>Human</strong> Synergistics International.<br />
2<br />
A report on the reliability <strong>and</strong> validity <strong>of</strong> M/I based on an earlier data set will appear in the upcoming edition <strong>of</strong> Leslie, J. B. & Fleenor, J. W.<br />
Feedback to Managers (Greensboro, NC: Center for Creative Leadership).<br />
Copyright © 2012 by <strong>Human</strong> Synergistics International. All Rights Reserved.<br />
1
MANAGEMENT/IMPACT (M/I)<br />
humansynergistics.com<br />
<strong>The</strong> <strong>Reliability</strong> <strong>and</strong> <strong>Validity</strong> <strong>of</strong> <strong>Management</strong>/Impact (M/I)<br />
OVERVIEW OF M/I<br />
M/I is a 360° feedback tool designed to provide those with management responsibilities with information regarding how they<br />
approach their work <strong>and</strong> the impact they have on the behavior <strong>and</strong> performance <strong>of</strong> the people around them. Because M/I measures<br />
the direction <strong>and</strong> degree to which managers influence the behavior <strong>of</strong> those around them, it is appropriate for programs <strong>and</strong> initiatives<br />
targeting management development, personal development, organizational culture change, <strong>and</strong> organizational development.<br />
M/I provides participants with information regarding their:<br />
• <strong>Management</strong> Approaches, in terms <strong>of</strong> the frequency with which they carry out their management responsibilities in<br />
Facilitating versus Inhibiting ways;<br />
• Impact on Others, in terms <strong>of</strong> the extent to which they motivate those around them to behave in Constructive<br />
versus Defensive ways; <strong>and</strong><br />
• Effectiveness along task, people, <strong>and</strong> personal criteria.<br />
Feedback is based on information collected using two forms <strong>of</strong> the M/I inventory. <strong>The</strong> Description by Others form is completed<br />
by at least three people selected by the participant to describe his or her management approaches, impact on others, <strong>and</strong><br />
overall effectiveness. <strong>The</strong> Self-Report form is completed by the participants themselves to identify their perceptions <strong>of</strong> the management<br />
approaches they use <strong>and</strong> the impact that they would ideally like to have on the behavior <strong>of</strong> others.<br />
<strong>Management</strong> Approaches<br />
Ninety <strong>of</strong> the items included in M/I are designed to measure the frequency with which the focal individual uses Facilitating <strong>and</strong><br />
Inhibiting approaches in carrying out 15 responsibilities common to the jobs <strong>of</strong> most managers. <strong>The</strong>se responsibilities vary in<br />
terms <strong>of</strong> their task, people, <strong>and</strong> personal focus. Task responsibilities include managing goals, change, problems, results, resources,<br />
<strong>and</strong> work activities. People responsibilities include managing inter-unit relations, teams, communication, learning, <strong>and</strong> personal<br />
relations. Personal responsibilities include managing integrity, self-development, <strong>and</strong> emotions.<br />
For each <strong>of</strong> the 15 responsibilities, three items measure the frequency with which activities are carried out in a Facilitating way<br />
<strong>and</strong> three items measure the frequency with which activities are carried out in an Inhibiting way. Facilitating approaches focus<br />
on maximizing the autonomy <strong>of</strong> other people <strong>and</strong> the integration <strong>of</strong> their work. Inhibiting approaches focus on maximizing the<br />
manager’s control over other people <strong>and</strong> their work. 3 <strong>The</strong> items that measure these approaches appear in both forms <strong>of</strong> the survey<br />
so that the manager can compare his or her self-perceptions to the descriptions by others.<br />
Feedback on approaches is intended to raise participants’ awareness <strong>of</strong> the ways in which they carry out their management<br />
responsibilities <strong>and</strong> the impact <strong>of</strong> their approaches on the behavior <strong>and</strong> performance <strong>of</strong> those around them. <strong>The</strong> theory behind<br />
M/I posits that Facilitating approaches are more functional than Inhibiting ones <strong>and</strong> promote Constructive behavior on the<br />
part <strong>of</strong> others. Inhibiting approaches should be used sparingly as they are likely to promote a Defensive impact when they are<br />
relied on more frequently.<br />
Impact on Others<br />
Sixty <strong>of</strong> the items included in M/I are designed to measure the impact <strong>of</strong> managers along two dimensions. <strong>The</strong> first dimension<br />
distinguishes between behaviors oriented toward task versus people that may be encouraged on the part <strong>of</strong> others. <strong>The</strong> second<br />
dimension distinguishes between the extent to which these behaviors are associated with higher-order needs for growth <strong>and</strong> satisfaction<br />
versus lower-order security needs. <strong>The</strong>se dimensions, based on the cultural styles measured by the Organizational Culture<br />
Inventory® 4 <strong>and</strong> the impact styles measured by Leadership/<strong>Impact®</strong> 5 , define three general types <strong>of</strong> impact <strong>and</strong> the 12 specific<br />
behavioral styles that managers may encourage or promote. Thus:<br />
3<br />
Szumal, J. L. & Cooke, R.A. (2008). <strong>Management</strong>/Impact Confidential Feedback Report. Plymouth, MI: <strong>Human</strong> Synergistics International.<br />
4<br />
Cooke, R. A. & Lafferty, J. C. (1989). Organizational Culture Inventory. Plymouth, MI: <strong>Human</strong> Synergistics International.<br />
5<br />
Cooke, R. A. (1992). Leadership/Impact. Plymouth, MI: <strong>Human</strong> Synergistics International.<br />
2 Copyright © 2012 by <strong>Human</strong> Synergistics International. All Rights Reserved.
MANAGEMENT/IMPACT (M/I)<br />
humansynergistics.com<br />
<strong>The</strong> <strong>Reliability</strong> <strong>and</strong> <strong>Validity</strong> <strong>of</strong> <strong>Management</strong>/Impact (M/I)<br />
• Managers who have a Constructive impact motivate others to relate to people <strong>and</strong> approach tasks in ways that will help<br />
them to personally meet their higher-order needs for growth <strong>and</strong> satisfaction (includes Achievement, Self-Actualizing,<br />
<strong>Human</strong>istic-Encouraging, <strong>and</strong> Affiliative behavioral styles).<br />
• Managers who have a Passive/Defensive impact encourage others to interact with the people around them in self-protective<br />
ways that will not threaten their own security (includes Approval, Conventional, Dependent, <strong>and</strong> Avoidance styles).<br />
• Managers who have an Aggressive/Defensive impact drive others to approach tasks in forceful ways that will protect their<br />
own personal status <strong>and</strong> security (includes Oppositional, Power, Competitive, <strong>and</strong> Perfectionistic styles).<br />
<strong>The</strong> Description by Others form measures the extent to which the manager currently promotes each <strong>of</strong> these 12 behavioral<br />
styles (i.e., the manager’s current impact). <strong>The</strong> Self-Report form assesses the extent to which the manager would ideally like to<br />
promote these behaviors on the part <strong>of</strong> others (i.e., the manager’s ideal impact). Results on the differences between current <strong>and</strong><br />
ideal impact highlight areas for change <strong>and</strong> improvement.<br />
Most participants will describe their ideal impact as Constructive. This is expected since the theory underlying M/I posits<br />
that a Constructive impact is appropriate <strong>and</strong> effective for most managers. Although differences do exist between countries,<br />
Constructive behaviors generally are consistent with the cultural values (e.g., independence <strong>and</strong> equal opportunity) <strong>and</strong> higherorder<br />
needs (e.g., achievement <strong>and</strong> self-actualization) reported by members <strong>of</strong> organizations within the U.S., Australia, Canada,<br />
New Zeal<strong>and</strong>, U.K., Western Europe, <strong>and</strong> a number <strong>of</strong> other countries. Given their consistency with those needs <strong>and</strong> values, the<br />
Constructive behaviors encouraged by managers have far greater motivational potential <strong>and</strong> are more effective (e.g., in terms <strong>of</strong><br />
promoting individual well-being, performance, <strong>and</strong> high-quality interpersonal relations) than Defensive impact styles.<br />
<strong>Management</strong> Effectiveness<br />
Fourteen items are included in the Description by Others form to measure overall management effectiveness. Feedback from<br />
these items is intended to encourage participants to use the M/I approaches <strong>and</strong> impact results for identifying ways to improve<br />
<strong>and</strong> maximize their future effectiveness.<br />
RELIABILITY<br />
Both the internal consistency <strong>and</strong> interrater reliability <strong>of</strong> the M/I approaches <strong>and</strong> impact scales were examined using the<br />
Description by Others data. Only the interrater reliability <strong>of</strong> the effectiveness items was examined since they are included (as<br />
items rather than as a scale) in the feedback received by managers. Though it is not used in providing managers with feedback,<br />
the reliability <strong>of</strong> the overall effectiveness scale was also estimated because it is used for this research to examine the criterionrelated<br />
validity <strong>of</strong> the impact scales.<br />
Cronbach’s alpha is considered to be the most conservative measure <strong>of</strong> a scale’s internal consistency. It can be interpreted as the<br />
average covariance among the items within the scale. Generally speaking, alpha coefficients above .60 are desirable <strong>and</strong> provide<br />
support for combining the responses to the relevant items into a single scale score.<br />
Interrater reliability, or the consistency between the reports <strong>of</strong> different raters who described the same manager, was examined<br />
using oneway analysis <strong>of</strong> variance (ANOVA) with the manager being described as the independent variable <strong>and</strong> the M/I scales<br />
as the dependent variables. Significant F-values provide evidence <strong>of</strong> interrater reliability <strong>and</strong> indicate that the variance in the<br />
reports <strong>of</strong> those who described different managers is appreciably greater than the variance in the reports <strong>of</strong> those who described<br />
the same manager. Eta 2 statistics provide an estimate <strong>of</strong> the percent <strong>of</strong> variance explained in the M/I scale scores by the manager<br />
being described by respondents.<br />
Copyright © 2012 by <strong>Human</strong> Synergistics International. All Rights Reserved.<br />
3
MANAGEMENT/IMPACT (M/I)<br />
humansynergistics.com<br />
<strong>The</strong> <strong>Reliability</strong> <strong>and</strong> <strong>Validity</strong> <strong>of</strong> <strong>Management</strong>/Impact (M/I)<br />
<strong>Management</strong> Approaches<br />
As shown in Table 2, the overall measures <strong>of</strong> Facilitating <strong>and</strong> Inhibiting approaches demonstrate high levels <strong>of</strong> internal<br />
consistency. For the total sample, the alpha coefficients for both <strong>of</strong> the overall approaches are .97.<br />
<strong>The</strong> alphas for the approaches to specific management responsibilities are lower than those for the overall Facilitating <strong>and</strong><br />
Inhibiting scales. This is to be expected since these subscales are based on only three items each <strong>and</strong> alpha coefficients usually<br />
decrease as the number <strong>of</strong> items per scale decreases. <strong>The</strong> coefficients range from .62 (for Managing Integrity—Facilitating,<br />
Results—Inhibiting, <strong>and</strong> Work Activities—Inhibiting) to .85 (for Managing Personal Relations—Facilitating), with the<br />
majority <strong>of</strong> the coefficients greater than .70. <strong>The</strong>se findings demonstrate that it is reliable <strong>and</strong> meaningful to combine the<br />
management approaches items into both the overall <strong>and</strong> specific scales used for M/I feedback.<br />
<strong>The</strong> ANOVA results provide strong support for the interrater reliability <strong>of</strong> all <strong>of</strong> the management approaches scales. <strong>The</strong> F<br />
statistics for the overall approaches, as well as for the subscales are all significant at p
MANAGEMENT/IMPACT (M/I)<br />
humansynergistics.com<br />
<strong>The</strong> <strong>Reliability</strong> <strong>and</strong> <strong>Validity</strong> <strong>of</strong> <strong>Management</strong>/Impact (M/I)<br />
<strong>The</strong> eta 2 statistics are .33 <strong>and</strong> .37 for the overall Facilitating <strong>and</strong> Inhibiting scales, respectively, <strong>and</strong> range from .26<br />
(Managing Work Activities—Facilitating) to .36 (Managing Personal Relations—Inhibiting <strong>and</strong> Self-Development—Inhibiting)<br />
for the use <strong>of</strong> the approaches in carrying out specific responsibilities. Taken together, the ANOVA<br />
<strong>and</strong> eta 2 results demonstrate the interrater reliability <strong>of</strong> the management approaches scales <strong>and</strong> justify using aggregated<br />
scores based on the combined descriptions <strong>of</strong> each manager’s respondents.<br />
Impact on Others<br />
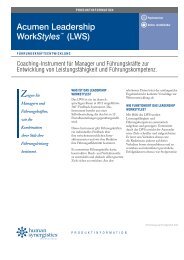
<strong>The</strong> internal consistency results for the M/I impact scales are presented in Table 3. <strong>The</strong> current impact scales show<br />
acceptable levels <strong>of</strong> internal consistency with alpha coefficients ranging from .69 (for Avoidance <strong>and</strong> Oppositional)<br />
to .87 (for Affiliative). <strong>The</strong>se results provide strong evidence <strong>of</strong> the stability <strong>of</strong> the impact scales <strong>and</strong> support for<br />
combining the items into the scales postulated by M/I.<br />
Table 3: <strong>Reliability</strong> <strong>of</strong> the Impact Scales<br />
Impact Scales alpha F* Eta 2<br />
<strong>Human</strong>istic-Encouraging .85 2.64 .32<br />
Affiliative .87 2.45 .30<br />
Approval .75 3.78 .40<br />
Conventional .74 3.84 .40<br />
Dependent .73 3.01 .35<br />
Avoidance .69 3.73 .40<br />
Oppositional .69 2.74 .32<br />
Power .76 3.91 .41<br />
Competitive .78 4.51 .44<br />
Perfectionistic .77 4.80 .46<br />
Achievement .84 2.35 .29<br />
Self-Actualizing .85 2.47 .30<br />
n=4,356 respondents describing 650 focal managers. F statistics <strong>and</strong> eta 2 statistics based on Oneway Analysis <strong>of</strong> Variance.<br />
<strong>The</strong> M/I impact styles are from J. L. Szumal <strong>and</strong> R. A. Cooke, <strong>Management</strong>/Impact ® , <strong>Human</strong> Synergistics International,<br />
Plymouth, MI. All Rights Reserved. *All F statistics are significant at p
MANAGEMENT/IMPACT (M/I)<br />
humansynergistics.com<br />
<strong>The</strong> <strong>Reliability</strong> <strong>and</strong> <strong>Validity</strong> <strong>of</strong> <strong>Management</strong>/Impact (M/I)<br />
Table 4: <strong>Reliability</strong> <strong>of</strong> the <strong>Management</strong> Effectiveness Measures<br />
<strong>Management</strong> Effectiveness Measures alpha F* Eta 2<br />
Overall <strong>Management</strong> Effectiveness .96 2.73 .33<br />
Moves the organization toward its vision <strong>and</strong> goals 2.10 .27<br />
Has a positive impact on his/her unit’s effectiveness 2.67 .32<br />
Enhances others’ productivity 1.89 .25<br />
Solves problems 2.07 .27<br />
Motivates others to exceed expectations 1.90 .25<br />
Promotes self-confidence 2.15 .27<br />
Makes people's jobs more satisfying 2.35 .29<br />
Has a calming effect on others 3.12 .35<br />
Makes people want to stay 2.54 .31<br />
Trusted by others 2.55 .31<br />
Continues to grow as a manager 2.35 .29<br />
Energized by the job 2.47 .30<br />
Influential 2.23 .28<br />
Ready for promotion 2.30 .29<br />
n=4,356 respondents describing 650 focal managers. F statistics <strong>and</strong> eta 2 statistics based on Oneway Analysis <strong>of</strong> Variance. <strong>The</strong> M/I effectiveness items are from<br />
J. L Szumal <strong>and</strong> R. A. Cooke, <strong>Management</strong>/Impact ® , <strong>Human</strong> Synergistics International, Plymouth, MI. All Rights Reserved. *All F statistics are significant at<br />
p
MANAGEMENT/IMPACT (M/I)<br />
humansynergistics.com<br />
<strong>The</strong> <strong>Reliability</strong> <strong>and</strong> <strong>Validity</strong> <strong>of</strong> <strong>Management</strong>/Impact (M/I)<br />
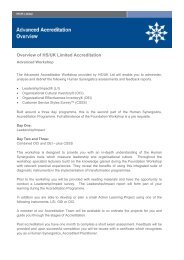
Both the pattern <strong>and</strong> structure coefficients are reported for the management approaches <strong>and</strong> impact scales because they provide<br />
unique information. <strong>The</strong> pattern coefficients show the relationships among the scales included in the analyses, controlling<br />
for the other factors (similar to beta coefficients in a multiple regression), whereas structure coefficients reflect the correlation<br />
between the scale <strong>and</strong> each factor. In cases such as this, where the underlying constructs are known <strong>and</strong> assumed to be correlated,<br />
the pattern coefficients are more useful in naming factors. 8 Convergent validity is demonstrated when scales assumed to<br />
belong to a single factor all have loadings above .40 on the same factor. Discriminant validity is demonstrated when the same<br />
scales have loadings less than .40 <strong>and</strong> greater than -.40 on the other factors.<br />
Eigenvalues before rotation <strong>and</strong> the percent <strong>of</strong> variance explained after rotation are also reported. <strong>The</strong> eigenvalues indicate<br />
the total amount <strong>of</strong> variance in all <strong>of</strong> the scales explained by each factor. Factors with eigenvalues greater than 1.0 are usually<br />
extracted or retained (because they imply that the factor accounts for more variance than that <strong>of</strong> just one scale). However, when<br />
the purpose <strong>of</strong> the analysis is to confirm an existing conceptual framework (as is the case here), the number <strong>of</strong> factors extracted<br />
from the data can be forced to equal the number <strong>of</strong> factors in the conceptual framework, regardless <strong>of</strong> their eigenvalues. <strong>The</strong><br />
percent <strong>of</strong> variance explained indicates the percent <strong>of</strong> variance in all <strong>of</strong> the scales explained by the retained factors after rotation.<br />
<strong>The</strong> higher the percent, the more variance accounted for in the scales by each <strong>of</strong> the final factors.<br />
<strong>Management</strong> Approaches<br />
<strong>The</strong> 30 specific management approaches sub-scales are presumed to measure two forms <strong>of</strong> management: Facilitating <strong>and</strong> Inhibiting.<br />
Thus, for the principle components analyses carried out on the approaches scales, a two-factor solution was imposed. As<br />
shown in Table 5, two factors explain a total <strong>of</strong> 66.5% <strong>of</strong> the variance in the Description by Others data. <strong>The</strong> pattern coefficients<br />
show that the loadings for all <strong>of</strong> the Facilitating sub-scales are above .40 on the second factor (supporting their convergent<br />
validity) <strong>and</strong> below .40 on the first factor (supporting their discriminant validity). Similarly, all <strong>of</strong> the Inhibiting sub-scales have<br />
loadings above .40 on the first factor <strong>and</strong> below .40 on the second factor.<br />
<strong>The</strong> dual loadings <strong>of</strong> the structure coefficients on the two factors reflect the expected correlations between the Facilitating <strong>and</strong><br />
Inhibiting approaches. As with the pattern coefficients, the highest loadings for the Facilitating scales are all on the second factor<br />
whereas the highest loadings for the Inhibiting scales are all on the first.<br />
Impact on Others<br />
<strong>The</strong> 12 impact scales are designed to measure three general types <strong>of</strong> behavioral styles that managers can motivate or encourage<br />
on the part <strong>of</strong> other people: Constructive, Passive/Defensive, <strong>and</strong> Aggressive/Defensive. For this reason, a three-factor solution<br />
was imposed. Table 6 shows that the three factors explain a total <strong>of</strong> 79.4% <strong>of</strong> the variance in the data. Focusing on the pattern<br />
coefficients, the first factor is defined by the Constructive styles, the second factor by the Aggressive/Defensive styles, <strong>and</strong> the<br />
third by the Passive/Defensive styles. All <strong>of</strong> the scales only load on the correct factor, supporting their convergent <strong>and</strong><br />
discriminant validity.<br />
With respect to the structure coefficients, the dual loadings <strong>of</strong> the Passive/Defensive <strong>and</strong> Aggressive/Defensive styles on the<br />
second <strong>and</strong> third factors reflect the impact <strong>of</strong> both sets <strong>of</strong> styles on other people’s needs for safety <strong>and</strong> security. <strong>The</strong> highest<br />
loadings, however, are on the correct factor, lending further evidence <strong>and</strong> support regarding the convergent validity <strong>of</strong> the scales.<br />
8<br />
Kahn, J. H. (2006). Factor analysis in counseling psychology research, training, <strong>and</strong> practice: Principles, advances, <strong>and</strong> applications. <strong>The</strong> Counseling Psychologist, 34, 684-718.<br />
Copyright © 2012 by <strong>Human</strong> Synergistics International. All Rights Reserved.<br />
7
MANAGEMENT/IMPACT (M/I)<br />
humansynergistics.com<br />
<strong>The</strong> <strong>Reliability</strong> <strong>and</strong> <strong>Validity</strong> <strong>of</strong> <strong>Management</strong>/Impact (M/I)<br />
Table 5: Construct <strong>Validity</strong> <strong>of</strong> the <strong>Management</strong> Approaches Scales<br />
Pattern Coefficients<br />
Structure Coefficients<br />
<strong>Management</strong> Approaches Scales Factor 1 Factor 2 Factor 1 Factor 2<br />
Facilitating<br />
Managing Goals .097 .932 -.580 .861<br />
Managing Change .176 .917 -.491 .789<br />
Managing Problems -.119 .739 -.656 .825<br />
Managing Results .104 .930 -.572 .854<br />
Managing Resources -.064 .825 -.663 .871<br />
Managing Work Activities -.046 .771 -.606 .804<br />
Managing Inter-Unit Relations -.061 .767 -.619 .811<br />
Managing Teams .044 .788 -.529 .756<br />
Managing Communications -.346 .547 -.744 .798<br />
Managing Rewards -.063 .762 -.617 .808<br />
Managing Learning -.044 .827 -.646 .859<br />
Managing Personal Relations -.368 .466 -.706 .733<br />
Managing Integrity -.191 .626 -.646 .765<br />
Managing Self-Development -.109 .745 -.651 .824<br />
Managing Emotions -.324 .562 -.732 .797<br />
Inhibiting<br />
Managing Goals .797 -.044 .828 -.623<br />
Managing Change .750 -.086 .812 -.632<br />
Managing Problems .789 -.007 .795 -.581<br />
Managing Results .765 .021 .750 -.535<br />
Managing Resources .730 -.106 .807 -.637<br />
Managing Work Activities .821 .067 .772 -.530<br />
Managing Inter-Unit Relations .856 .072 .804 -.551<br />
Managing Teams .779 -.053 .817 -.619<br />
Managing Communications .838 .008 .832 -.601<br />
Managing Rewards .677 -.176 .805 -.668<br />
Managing Learning .750 -.067 .799 -.612<br />
Managing Personal Relations .791 -.048 .826 -.623<br />
Managing Integrity .794 -.043 .825 -.620<br />
Managing Self-Development .855 -.012 .864 -.634<br />
Managing Emotions .836 .070 .785 -.538<br />
Eigenvalues 17.680 2.267<br />
% Variance 58.935 7.558<br />
n=4,356 respondents describing 650 focal managers. Factors based on principal components analysis with Promax rotation. Loadings<br />
above .40 are italicized. Highest loadings are in boldface. <strong>The</strong> M/I management approaches are from J. L. Szumal <strong>and</strong> R. A. Cooke,<br />
<strong>Management</strong>/Impact ® , <strong>Human</strong> Synergistics International, Plymouth, MI. All Rights Reserved.<br />
8 Copyright © 2012 by <strong>Human</strong> Synergistics International. All Rights Reserved.
MANAGEMENT/IMPACT (M/I)<br />
humansynergistics.com<br />
<strong>The</strong> <strong>Reliability</strong> <strong>and</strong> <strong>Validity</strong> <strong>of</strong> <strong>Management</strong>/Impact (M/I)<br />
Table 6: Construct <strong>Validity</strong> <strong>of</strong> the Impact Scales<br />
Pattern Coefficients Structure Coefficients<br />
Impact Scales Factor 1 Factor 2 Factor 3 Factor 1 Factor 2 Factor 3<br />
<strong>Human</strong>istic-Encouraging .936 -.092 .067 .935 -.209 -.231<br />
Affiliative .925 -.191 .136 .924 -.258 -.228<br />
Approval -.013 .383 .512 -.209 .738 .779<br />
Conventional .025 -.059 .950 -.203 .592 .904<br />
Dependent -.054 .008 .857 -.270 .609 .876<br />
Avoidance -.103 .218 .664 -.308 .694 .840<br />
Oppositional -.164 .974 -.198 -.284 .867 .515<br />
Power .166 .728 .183 -.006 .825 .643<br />
Competitive .029 .753 .177 -.147 .870 .689<br />
Perfectionistic .073 .603 .349 -.120 .830 .746<br />
Achievement .928 .089 -.058 .927 -.113 -.230<br />
Self-Actualizing .893 .193 -.223 .916 -.116 -.314<br />
Eigenvalues 5.849 3.013 .665<br />
% Variance 48.739 25.108 5.545<br />
n=4,356 respondents describing 650 focal managers. Factors based on principal components analysis with Promax rotation. Loadings above .40 are italicized. Highest<br />
loadings are in boldface. <strong>The</strong> M/I impact styles are from J. L. Szumal <strong>and</strong> R. A. Cooke, <strong>Management</strong>/Impact ® , <strong>Human</strong> Synergistics International, Plymouth, MI.<br />
All Rights Reserved.<br />
CRITERION-RELATED VALIDITY<br />
Criterion-related validity refers to a scale’s effectiveness in predicting performance in terms <strong>of</strong> measures <strong>of</strong> other constructs or<br />
outcomes. 9 <strong>The</strong> criterion-related validity <strong>of</strong> the M/I scales was examined using Pearson correlation coefficients as estimates <strong>of</strong><br />
the degree <strong>of</strong> association between the measures <strong>of</strong> management approaches <strong>and</strong> impact, as well as between impact <strong>and</strong> management<br />
effectiveness.<br />
<strong>The</strong> theoretical framework underlying M/I posits that Facilitating approaches have a Constructive impact on others, while<br />
Inhibiting approaches have a Defensive impact. Thus, positive correlations between Facilitating approaches <strong>and</strong> Constructive<br />
impact styles <strong>and</strong> positive correlations between Inhibiting approaches <strong>and</strong> the Defensive impact styles would provide evidence<br />
<strong>of</strong> the criterion-related validity <strong>of</strong> these scales. In turn, a Constructive impact should help managers <strong>and</strong> those around them to<br />
be more effective <strong>and</strong> accomplish more. A Defensive impact should interfere with the effectiveness <strong>of</strong> managers, as well as the<br />
performance <strong>of</strong> those with whom they work or interact. Positive correlations between the measures <strong>of</strong> Constructive impact<br />
<strong>and</strong> management effectiveness <strong>and</strong> negative correlations between the Defensive impact measures <strong>and</strong> effectiveness would<br />
demonstrate the validity <strong>of</strong> these relationships.<br />
<strong>Management</strong> Approaches<br />
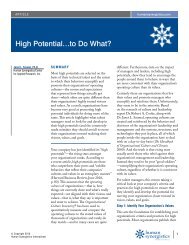
<strong>The</strong> correlations between management approaches <strong>and</strong> current impact are presented in Table 7. Consistent with the theoretical<br />
framework underlying M/I, overall Facilitating approaches are positively related to a Constructive impact <strong>and</strong>, to a lesser extent,<br />
negatively related to the Defensive impact styles. Similarly, overall Inhibiting approaches are positively related to both Passive/<br />
Defensive <strong>and</strong> Aggressive/Defensive impacts <strong>and</strong>, to a lesser extent, negatively related to a Constructive impact. With respect to<br />
specific management responsibilities, all were significantly correlated with the current impact measures in the manner predicted.<br />
Overall, these results provide strong support for the criterion-related validity <strong>of</strong> the management approaches <strong>and</strong> impact scales.<br />
<strong>The</strong>y also provide support for the contention that by more frequently approaching their work in a Facilitating manner (<strong>and</strong> less<br />
frequently in an Inhibiting one), managers can have a more Constructive (<strong>and</strong> less Defensive) impact on the people around them.<br />
9<br />
Kerlinger, F. N. (1986). Foundations <strong>of</strong> behavioral research, 3 rd edition. Fort Worth, TX: Holt, Rinehart, <strong>and</strong> Winston.<br />
Copyright © 2012 by <strong>Human</strong> Synergistics International. All Rights Reserved.<br />
9
MANAGEMENT/IMPACT (M/I)<br />
humansynergistics.com<br />
<strong>The</strong> <strong>Reliability</strong> <strong>and</strong> <strong>Validity</strong> <strong>of</strong> <strong>Management</strong>/Impact (M/I)<br />
Table 7: Criterion-Related <strong>Validity</strong>: Correlations Between <strong>Management</strong> Approaches <strong>and</strong> Impact<br />
Impact<br />
<strong>Management</strong> Approaches Constructive Passive/Defensive Aggressive/Defensive<br />
Overall Facilitating .85 -.54 -.44<br />
Managing Goals .76 -.35 -.21<br />
Managing Change .72 -.39 -.19<br />
Managing Problems .66 -.43 -.36<br />
Managing Results .72 -.35 -.23<br />
Managing Resources .73 -.46 -.36<br />
Managing Work Activities .69 -.52 -.42<br />
Managing Inter-Unit Relations .75 -.46 -.36<br />
Managing Teams .65 -.36 -.27<br />
Managing Communications .72 -.55 -.52<br />
Managing Rewards .79 -.49 -.39<br />
Managing Learning .82 -.39 -.27<br />
Managing Personal Relations .66 -.51 -.54<br />
Managing Integrity .64 -.62 -.51<br />
Managing Self-Development .73 -.46 -.40<br />
Managing Emotions .65 -.54 -.51<br />
Overall Inhibiting -.61 .73 .71<br />
Managing Goals -.51 .60 .58<br />
Managing Change -.56 .71 .59<br />
Managing Problems -.47 .60 .58<br />
Managing Results -.48 .65 .64<br />
Managing Resources -.51 .59 .52<br />
Managing Work Activities -.51 .64 .62<br />
Managing Inter-Unit Relations -.49 .58 .65<br />
Managing Teams -.51 .64 .62<br />
Managing Communications -.55 .67 .66<br />
Managing Rewards -.64 .62 .57<br />
Managing Learning -.57 .66 .58<br />
Managing Personal Relations .57 .64 .67<br />
Managing Integrity -.52 .66 .60<br />
Managing Self-Development -.55 .69 .67<br />
n=aggregated descriptions by 4,356 others <strong>of</strong> 650 focal managers. All correlations are significant at p
MANAGEMENT/IMPACT (M/I)<br />
humansynergistics.com<br />
<strong>The</strong> <strong>Reliability</strong> <strong>and</strong> <strong>Validity</strong> <strong>of</strong> <strong>Management</strong>/Impact (M/I)<br />
Impact<br />
<strong>The</strong> correlation coefficients between current impact <strong>and</strong> overall management effectiveness are presented in Table 8. <strong>The</strong> results<br />
indicate that a Constructive impact is positively associated with the managers’ overall effectiveness whereas Passive/Defensive<br />
<strong>and</strong> Aggressive/Defensive impacts are negatively associated with their effectiveness. <strong>The</strong>se findings provide evidence <strong>of</strong> the<br />
criterion-related validity <strong>of</strong> the impact scales <strong>and</strong> support for the claim that managers can improve their effectiveness by having<br />
a more Constructive (<strong>and</strong> less Defensive) impact.<br />
Table 8: Criterion-Related <strong>Validity</strong>: Correlations Between Impact <strong>and</strong> <strong>Management</strong> Effectiveness<br />
Impact<br />
<strong>Management</strong> Effectiveness Measures Constructive Passive/Defensive Aggressive/Defensive<br />
Overall <strong>Management</strong> Effectiveness .71 -.50 -.41<br />
Moves organization toward vision <strong>and</strong> goals .61 -.39 -.27<br />
Positive impact on unit effectiveness .64 -.49 -.39<br />
Enhances others’ productivity .66 -.45 -.38<br />
Solves problems .57 -.41 -.34<br />
Motivates others to exceed expectations .67 -.44 -.31<br />
Promotes self-confidence .68 -.47 -.39<br />
Makes people's jobs more satisfying .70 -.49 -.40<br />
Calming effect on others .53 -.49 -.55<br />
Makes people want to stay .62 -.49 -.45<br />
Trusted by others .56 -.44 -.39<br />
Continues to grow as a manager .63 -.41 -.30<br />
Energized by job .57 -.36 -.22<br />
Influential .61 -.38 -.23<br />
Ready for promotion .58 -.34 -.25<br />
n=aggregated descriptions by 4,356 others <strong>of</strong> 650 focal managers. All correlations are significant at p
MANAGEMENT/IMPACT (M/I)<br />
humansynergistics.com<br />
<strong>The</strong> <strong>Reliability</strong> <strong>and</strong> <strong>Validity</strong> <strong>of</strong> <strong>Management</strong>/Impact (M/I)<br />
More generally, the findings presented provide clear guidance to managers who want to improve their effectiveness in their roles.<br />
Managers who frequently use Facilitating approaches in carrying out their responsibilities <strong>and</strong> sparingly use Inhibiting approaches<br />
tend to have a Constructive impact <strong>and</strong> are viewed as highly effective in their roles. In contrast, managers who less frequently use<br />
Facilitating approaches to carry out their responsibilities or who approach their responsibilities in an Inhibiting way, tend to have<br />
a Passive/Defensive <strong>and</strong> Aggressive/Defensive impact on the people around them. In turn, managers with a Defensive impact are<br />
viewed as less effective in their roles.<br />
Thus, M/I provides managers with reliable <strong>and</strong> valid information about how they are carrying out their responsibilities <strong>and</strong> the<br />
impact that they are having on those around them. It also provides managers with a clear direction in terms <strong>of</strong> what they personally<br />
can do to have a more Constructive impact on the behavior <strong>of</strong> the people with whom they interact in particular as well as their<br />
organization’s culture in general, thereby increasing their own effectiveness as well as that <strong>of</strong> their organizations.<br />
12 Copyright © 2012 by <strong>Human</strong> Synergistics International. All Rights Reserved.