Reliability and Validity of the OEI. Arlington Heights, IL - Human ...
Reliability and Validity of the OEI. Arlington Heights, IL - Human ...
Reliability and Validity of the OEI. Arlington Heights, IL - Human ...

Create successful ePaper yourself
Turn your PDF publications into a flip-book with our unique Google optimized e-Paper software.
RELIAB<strong>IL</strong>ITY & VALIDITY<br />
humansynergistics.com<br />
Organizational Effectiveness<br />
Inventory ® (<strong>OEI</strong>)<br />
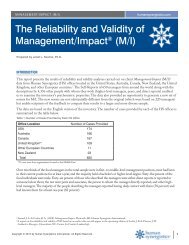
The <strong>Reliability</strong> <strong>and</strong> <strong>Validity</strong> <strong>of</strong> <strong>the</strong> Organizational Effectiveness Inventory ®<br />
Prepared by Janet L. Szumal, Ph.D.<br />
What is <strong>the</strong> <strong>OEI</strong>?<br />
The Organizational Effectiveness Inventory® (<strong>OEI</strong>; Cooke, 1995, 1997) is a survey designed to measure attitudinal<br />
<strong>and</strong> behavioral indicators <strong>of</strong> effectiveness (e.g., teamwork, motivation, <strong>and</strong> satisfaction). It also measures <strong>the</strong> internal<br />
factors <strong>and</strong> conditions (e.g., human resource management practices, leadership, <strong>and</strong> job design) that can directly <strong>and</strong><br />
indirectly—through an organization’s culture—impact effectiveness. The <strong>OEI</strong> was developed as a companion to <strong>the</strong><br />
Organizational Culture Inventory® (OCI®; Cooke & Lafferty, 1983, 1994), a survey that assesses <strong>the</strong> normative beliefs<br />
<strong>and</strong> shared behavioral expectations which may reflect <strong>the</strong> more abstract aspects <strong>of</strong> culture, such as shared assumptions<br />
<strong>and</strong> values. However, <strong>the</strong> <strong>OEI</strong> is also a valuable tool in its own right for evaluating organizational effectiveness <strong>and</strong><br />
directing <strong>and</strong> monitoring organizational change.<br />
This report describes <strong>the</strong> reliability <strong>of</strong> <strong>the</strong> <strong>OEI</strong> based on a sample <strong>of</strong> 6,444 members <strong>of</strong> 1,080 organizational units.<br />
Criterion-related validity is also addressed by examining <strong>the</strong> relationships between <strong>the</strong> <strong>OEI</strong> scales <strong>and</strong> <strong>the</strong> OCI<br />
measures <strong>of</strong> organizational culture.<br />
The Organizational Effectiveness Inventory (<strong>OEI</strong>)<br />
The <strong>OEI</strong> was originally designed as a customized survey that organizations could administer along with <strong>the</strong> OCI. The OCI<br />
provides a picture <strong>of</strong> an organization’s culture at <strong>the</strong> level <strong>of</strong> behavioral norms <strong>and</strong> expectations. The <strong>OEI</strong>, on <strong>the</strong> o<strong>the</strong>r h<strong>and</strong>,<br />
enables an organization to evaluate <strong>the</strong> impact <strong>of</strong> its culture on outcomes <strong>and</strong> identify <strong>the</strong> internal factors <strong>and</strong> conditions that<br />
shape <strong>and</strong> reinforce that culture. Initially, organizations were asked to select <strong>the</strong> measures <strong>the</strong>y wanted included in <strong>the</strong>ir <strong>OEI</strong><br />
from a database <strong>of</strong> scales from various prototypes. However, because all <strong>of</strong> <strong>the</strong> scales in <strong>the</strong> database were consistently selected,<br />
<strong>the</strong> current version <strong>of</strong> <strong>the</strong> <strong>OEI</strong> contains a st<strong>and</strong>ard set <strong>of</strong> questions measuring 31 causal factors <strong>and</strong> 12 outcomes, as well as a<br />
section for adding up to 40 questions <strong>of</strong> particular interest to <strong>the</strong> organization.<br />
The Theoretical Model<br />
The causal factors <strong>and</strong> outcomes measured by <strong>the</strong> <strong>OEI</strong> were determined based on a review <strong>of</strong> contemporary articles <strong>and</strong> books,<br />
established <strong>the</strong>ories, <strong>and</strong> classic writings in <strong>the</strong> areas <strong>of</strong> organizational culture, human resource management, organizational<br />
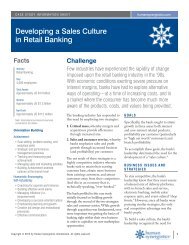
behavior, organization <strong>the</strong>ory, <strong>and</strong> social psychology. The <strong>the</strong>oretical model presented by Cooke <strong>and</strong> Szumal (2000) <strong>and</strong> shown<br />
on <strong>the</strong> next page describes <strong>the</strong> hypo<strong>the</strong>sized relationships among causal factors, culture, <strong>and</strong> outcomes.<br />
Copyright © 2012 by <strong>Human</strong> Synergistics International<br />
1
RELIAB<strong>IL</strong>ITY & VALIDITY<br />
humansynergistics.com<br />
Organizational Effectiveness Inventory ®<br />
The Theoretical Model<br />
Ideal Culture<br />
Values<br />
Causal Factors<br />
Levers for Change<br />
Operating Culture<br />
Behavioral Norms<br />
Outcomes<br />
Effectiveness Criteria<br />
Structures<br />
Individual<br />
Outcomes<br />
Systems<br />
Mission<br />
<strong>and</strong><br />
Philosophy<br />
Technology<br />
Group<br />
Outcomes<br />
Skills/<br />
Qualities<br />
Organizational<br />
Outcomes<br />
Based on Cooke & Szumal (2000). Model copyright © 1997 by Robert A. Cooke, Ph.D.; Circumplex copyright © 1987 by <strong>Human</strong> Synergistics International.<br />
As depicted by <strong>the</strong> model, causal factors affect outcomes both directly <strong>and</strong> through an organization’s operating culture. The<br />
causal factors that most directly influence culture <strong>and</strong> outcomes are structures, systems, technology, <strong>and</strong> skills/qualities.<br />
• Structures describe <strong>the</strong> manner in which system components (such as people, tasks, <strong>and</strong> roles) are ordered <strong>and</strong><br />
coupled to create organization (Georgopoulos, 1986).<br />
• Systems are <strong>the</strong> interrelated sets <strong>of</strong> procedures—such as human resource management, accounting, <strong>and</strong><br />
quality control systems—an organization uses to support its core activities <strong>and</strong> solve problems.<br />
• Technology includes <strong>the</strong> methods by which an organization transforms inputs into outputs.<br />
• Skills/qualities refer to those demonstrated by <strong>the</strong> organization’s members, including those in leadership positions.<br />
Mission <strong>and</strong> philosophy are also important causal factors, though <strong>the</strong>ir impact on culture <strong>and</strong> outcomes is more indirect<br />
than that <strong>of</strong> structures, systems, technology, <strong>and</strong> skills/qualities. Mission <strong>and</strong> philosophy represent <strong>the</strong> mechanisms by which<br />
organizations explicitly communicate <strong>the</strong>ir values to members. A clear <strong>and</strong> well-understood mission <strong>and</strong> philosophy statement<br />
is more likely to be consistently used (in making decisions about structures, systems, technology, <strong>and</strong> skills/qualities) than one<br />
that is unclear or not understood.<br />
To <strong>the</strong> extent that causal factors are aligned with <strong>the</strong> organization’s values, <strong>the</strong> operating culture will more closely reflect <strong>the</strong><br />
ideal culture <strong>and</strong> <strong>the</strong> organization will perform more favorably along outcomes. In contrast, when causal factors are not aligned<br />
with values (ei<strong>the</strong>r because <strong>the</strong> organization’s mission <strong>and</strong> philosophy do not explicitly communicate its values or because <strong>the</strong><br />
mission <strong>and</strong> philosophy are not used), <strong>the</strong> operating culture will be considerably different from <strong>the</strong> ideal <strong>and</strong> <strong>the</strong> outcomes<br />
realized will be less favorable.<br />
2 Copyright © 2012 by <strong>Human</strong> Synergistics International
RELIAB<strong>IL</strong>ITY & VALIDITY<br />
humansynergistics.com<br />
Organizational Effectiveness Inventory ®<br />
<strong>OEI</strong> Measures <strong>of</strong> Causal Factors<br />
In contrast to traditional attitude surveys that focus exclusively on outcomes, <strong>the</strong> <strong>OEI</strong> includes measures <strong>of</strong> various<br />
internal factors <strong>and</strong> conditions that directly <strong>and</strong> indirectly impact outcomes. These causal factors can help to<br />
pinpoint what is driving an organization’s current operating culture <strong>and</strong> effectiveness <strong>and</strong> be used to identify where<br />
modifications or changes are needed. Thirty-one causal factors are assessed by <strong>the</strong> <strong>OEI</strong> <strong>and</strong> are organized into <strong>the</strong> five<br />
categories identified by <strong>the</strong> <strong>the</strong>oretical model (i.e., mission <strong>and</strong> philosophy, structures, systems, technology, <strong>and</strong> skill/<br />
qualities). Except where noted, all <strong>of</strong> <strong>the</strong> causal factors are measured on 5-point scales that range from 1 (disagree, not<br />
at all, or not likely at all) to 5 (agree, to a very great extent, or almost certain).<br />
Mission <strong>and</strong> philosophy. As described by o<strong>the</strong>rs (e.g., Deal & Kennedy, 1982; Lawler, 1996; Ouchi, 1981; Tunstall,<br />
1986), an organization’s mission <strong>and</strong> philosophy can impact its culture <strong>and</strong> effectiveness. However, <strong>the</strong> extent <strong>and</strong><br />
desirability <strong>of</strong> this impact depend on whe<strong>the</strong>r <strong>the</strong> mission <strong>and</strong> philosophy are clearly defined, exemplified, <strong>and</strong> understood<br />
by <strong>the</strong> organization’s members. Therefore, <strong>the</strong> <strong>OEI</strong> includes two measures <strong>of</strong> mission <strong>and</strong> philosophy:<br />
• articulation <strong>of</strong> mission (i.e., extent to which mission is clearly defined, illustrated, <strong>and</strong> understood by<br />
members) <strong>and</strong><br />
• customer-service focus (i.e., <strong>the</strong> extent to which members underst<strong>and</strong> <strong>the</strong>y are responsible for identifying <strong>and</strong><br />
satisfying <strong>the</strong> needs <strong>of</strong> customers/clients).<br />
Structures. Structures are an important determinant <strong>of</strong> both organizational culture <strong>and</strong> organizational effectiveness<br />
(e.g., Lawler, 1996; Peters & Waterman, 1982; Schein, 1983). Thus, <strong>the</strong> <strong>OEI</strong> includes measures <strong>of</strong> <strong>the</strong> extent to which<br />
structures promote or restrict <strong>the</strong> influence, empowerment, <strong>and</strong> involvement <strong>of</strong> <strong>the</strong> organization’s members.<br />
The measures <strong>of</strong> influence are based on <strong>the</strong> work <strong>of</strong> Tannenbaum (1968), who found that <strong>the</strong> greater <strong>the</strong> total amount<br />
<strong>of</strong> influence being exercised within an organization <strong>and</strong> <strong>the</strong> less hierarchical its distribution, <strong>the</strong> higher <strong>the</strong> levels <strong>of</strong><br />
performance <strong>and</strong> member satisfaction. Like Tannenbaum, <strong>the</strong> <strong>OEI</strong> uses single items to assess <strong>the</strong> influence <strong>of</strong> employees,<br />
<strong>the</strong>ir immediate supervisors/managers, <strong>and</strong> higher-level managers over departmental decisions. Responses are<br />
based on a 5-point scale that ranges from 1 (no influence at all) to 5 (very great influence). Total influence is estimated<br />
by adding <strong>the</strong> amount <strong>of</strong> influence that is exercised by members at each organizational level (i.e., employees, <strong>the</strong>ir<br />
supervisors/managers, <strong>and</strong> higher-level managers). Distribution <strong>of</strong> influence is calculated by subtracting employees’<br />
influence from <strong>the</strong> influence <strong>of</strong> higher-level managers.<br />
In addition to <strong>the</strong> influence measures, <strong>the</strong> <strong>OEI</strong> assesses structure in terms <strong>of</strong>:<br />
• empowerment (i.e., <strong>the</strong> extent to which people are given what <strong>the</strong>y need to perform <strong>the</strong>ir tasks autonomously)<br />
<strong>and</strong><br />
• employee involvement (i.e., <strong>the</strong> extent to which all members actively participate in shaping <strong>the</strong> organization<br />
<strong>and</strong> in helping it to achieve its mission).<br />
Systems. <strong>Human</strong> resource management systems, appraisal <strong>and</strong> reinforcement systems, <strong>and</strong> goal setting systems, in particular,<br />
have been described as potentially powerful levels for promoting organizational change <strong>and</strong> improvement (e.g.,<br />
Allen, 1985; Latham & Locke, 1979; Lawler, 1996; Pritchard, Jones, Roth, Stuebing, & Ekeberg, 1988; Sethia & Von<br />
Glinow, 1985; Tubbs, 1986). The <strong>OEI</strong> measures human resource management systems in terms <strong>of</strong>:<br />
• selection/placement (i.e., <strong>the</strong> extent to which people <strong>and</strong> jobs are appropriately matched),<br />
Copyright © 2012 by <strong>Human</strong> Synergistics International<br />
3
RELIAB<strong>IL</strong>ITY & VALIDITY<br />
humansynergistics.com<br />
Organizational Effectiveness Inventory ®<br />
• training & development (i.e., <strong>the</strong> extent to which both new <strong>and</strong> existing members are provided with training),<br />
<strong>and</strong><br />
• respect for members (i.e., <strong>the</strong> extent to which members are treated fairly <strong>and</strong> justly).<br />
Aspects <strong>of</strong> appraisal <strong>and</strong> reinforcement systems that are measured by <strong>the</strong> <strong>OEI</strong> include:<br />
• fairness <strong>of</strong> appraisals (i.e., <strong>the</strong> likelihood that evaluations will be based on performance <strong>and</strong> objective criteria),<br />
• use <strong>of</strong> rewards (i.e., <strong>the</strong> likelihood that good performance will be noticed <strong>and</strong> reinforced in positive ways), <strong>and</strong><br />
• use <strong>of</strong> punishment (i.e., <strong>the</strong> likelihood that mistakes will be accentuated <strong>and</strong> punished).<br />
The <strong>OEI</strong> assesses goal setting systems in terms <strong>of</strong> <strong>the</strong> characteristics <strong>of</strong> <strong>the</strong> goals toward which people work on<br />
<strong>the</strong>ir jobs. The characteristics evaluated are based primarily on <strong>the</strong> work <strong>of</strong> Latham <strong>and</strong> Locke (1978) <strong>and</strong> are each<br />
measured by a single item on a 3-point ordinal scale with endpoints that vary with <strong>the</strong> characteristic assessed. The<br />
characteristics assessed include:<br />
• goal clarity (i.e., <strong>the</strong> extent to which goals are clear <strong>and</strong> specific versus unclear <strong>and</strong> ambiguous),<br />
• goal challenge (i.e., <strong>the</strong> extent to which goals are fairly challenging ra<strong>the</strong>r than too easy or too difficult),<br />
• participative goal setting (i.e., <strong>the</strong> extent to which goals are jointly set by members <strong>and</strong> superiors ra<strong>the</strong>r than<br />
set unilaterally by ei<strong>the</strong>r party), <strong>and</strong><br />
• goal acceptance (i.e., <strong>the</strong> extent to which goals are fully accepted versus marginally accepted by members).<br />
Technology. The <strong>OEI</strong> measures <strong>of</strong> technology are based primarily on <strong>the</strong> work <strong>of</strong> Hackman <strong>and</strong> Oldham (1980), who,<br />
among o<strong>the</strong>rs (e.g., Lawler, 1996; Trist & Bamforth, 1951), have described how <strong>the</strong> design <strong>of</strong> jobs can shape behavioral<br />
norms <strong>and</strong> expectations <strong>and</strong>, in turn, have implications for <strong>the</strong> motivation, performance, <strong>and</strong> satisfaction <strong>of</strong> job<br />
holders. The <strong>OEI</strong> assesses technology in terms <strong>of</strong>:<br />
• autonomy (i.e., <strong>the</strong> degree to which jobs provide members with discretion in terms <strong>of</strong> scheduling <strong>and</strong> work<br />
procedures),<br />
• skill variety (i.e., <strong>the</strong> degree to which jobs require members to use a wide range <strong>of</strong> skills <strong>and</strong> competencies),<br />
• feedback (i.e., <strong>the</strong> degree to which carrying out <strong>the</strong>ir jobs provides members with information about <strong>the</strong>ir<br />
performance),<br />
• task identity (i.e., <strong>the</strong> degree to which jobs enable members to carry out a complete <strong>and</strong> identifiable task from<br />
beginning to end),<br />
• significance (i.e., <strong>the</strong> degree to which jobs are viewed by members as having an important impact on o<strong>the</strong>r<br />
people), <strong>and</strong><br />
• interdependence (i.e., <strong>the</strong> degree to which members must cooperate <strong>and</strong> work with o<strong>the</strong>rs in order to carry out<br />
<strong>the</strong>ir jobs).<br />
Skills/Qualities. The skills <strong>and</strong> qualities <strong>of</strong> members—particularly those in leadership positions—can shape, reinforce,<br />
<strong>and</strong> change <strong>the</strong> operating culture <strong>of</strong> an organization <strong>and</strong> influence its effectiveness (e.g., Lawler, 1996; Peters &<br />
Waterman, 1982; Schein, 1983). The <strong>OEI</strong> measures <strong>of</strong> skills/qualities focus on communication, leadership styles, <strong>and</strong><br />
supervisory/managerial sources <strong>of</strong> power.<br />
4 Copyright © 2012 by <strong>Human</strong> Synergistics International
RELIAB<strong>IL</strong>ITY & VALIDITY<br />
humansynergistics.com<br />
Organizational Effectiveness Inventory ®<br />
The quality <strong>of</strong> organizational communications is measured by three sets <strong>of</strong> bi-polar adjectives. For each pair <strong>of</strong><br />
adjectives, respondents indicate on a 5-point continuum <strong>the</strong> relative extent to which each word describes one <strong>of</strong> <strong>the</strong><br />
following dimensions <strong>of</strong> communication within <strong>the</strong>ir organization:<br />
• upward communication (i.e., <strong>the</strong> effectiveness with which information is sent from employees to people in<br />
higher-level positions),<br />
• downward communication (i.e., <strong>the</strong> effectiveness with which information about <strong>the</strong> organization is sent to<br />
employees), or<br />
• communication for learning (i.e., <strong>the</strong> degree to which communications reflect a systems orientation <strong>and</strong><br />
emphasis on learning).<br />
Four different styles <strong>of</strong> leadership are assessed by <strong>the</strong> <strong>OEI</strong>, based on <strong>the</strong> research <strong>of</strong> Bowers <strong>and</strong> Seashore (1966).<br />
These styles include:<br />
• interaction facilitation (i.e., <strong>the</strong> extent to which managers encourage <strong>the</strong>ir direct reports to work as a team),<br />
• task facilitation (i.e., <strong>the</strong> extent to which managers help <strong>the</strong>ir direct reports to solve problems <strong>and</strong> implement<br />
better procedures),<br />
• goal emphasis (i.e., <strong>the</strong> extent to which managers reinforce expectations for excellence), <strong>and</strong><br />
• consideration (i.e., <strong>the</strong> extent to which managers are personally supportive <strong>of</strong> <strong>the</strong>ir direct reports).<br />
Finally, based on <strong>the</strong> work <strong>of</strong> French <strong>and</strong> Raven (1959), <strong>the</strong> <strong>OEI</strong> measures two different “bases” or sources <strong>of</strong> power<br />
that supervisors <strong>and</strong> managers might rely on to influence <strong>the</strong> behavior <strong>of</strong> <strong>the</strong>ir employees:<br />
• personal bases <strong>of</strong> power (i.e., <strong>the</strong> extent to which employees are influenced by <strong>the</strong>ir supervisor’s/manager’s<br />
technical expertise or competence, <strong>the</strong> respect that <strong>the</strong>y have for <strong>the</strong>ir supervisor/manager, <strong>and</strong> <strong>the</strong>ir<br />
supervisor’s/manager’s willingness to be influenced by <strong>the</strong>m) <strong>and</strong><br />
• organizational bases <strong>of</strong> power (i.e., <strong>the</strong> extent to which employees are influenced because <strong>of</strong> <strong>the</strong>ir supervisor’s/<br />
manager’s control over desirable extrinsic outcomes, formal position, <strong>and</strong> ability to punish those who fail to<br />
comply).<br />
<strong>OEI</strong> Measures <strong>of</strong> Outcomes<br />
Twelve outcomes are measured by <strong>the</strong> <strong>OEI</strong> <strong>and</strong> are organized into four categories: individual outcomes—positive<br />
indices, individual outcomes—negative indices, group outcomes, <strong>and</strong> organizational outcomes. All <strong>of</strong> <strong>the</strong> outcomes<br />
are measured on 5-point scales that range from 1 (disagree or not at all) to 5 (agree or to a very great extent).<br />
Individual outcomes—positive indices. The positive attitudes <strong>and</strong> sentiments that individuals hold toward <strong>the</strong>ir jobs or<br />
organizations have been used as criteria <strong>of</strong> organizational effectiveness (e.g., Friedl<strong>and</strong>er & Pickle, 1968; Hitt, 1988;<br />
Kaplan & Norton, 1996; Kreitner & Kinicki, 1998; Lawler, 1996; Pennings, 1975; Seashore, 1965) <strong>and</strong> have been<br />
identified as outcomes <strong>of</strong> organizational culture (e.g., Cooke & Szumal, 1993, 2000; O’Reilly, 1989). The positive<br />
individual outcomes measured by <strong>the</strong> <strong>OEI</strong> include:<br />
• role clarity (i.e., <strong>the</strong> extent to which members receive clear messages regarding expectations),<br />
• motivation (i.e., <strong>the</strong> extent to which members are inspired to behave in ways consistent with organizational<br />
goals),<br />
Copyright © 2012 by <strong>Human</strong> Synergistics International<br />
5
RELIAB<strong>IL</strong>ITY & VALIDITY<br />
humansynergistics.com<br />
Organizational Effectiveness Inventory ®<br />
• satisfaction (i.e., <strong>the</strong> extent to which members feel positively about <strong>the</strong>ir work situation), <strong>and</strong><br />
• intention to stay (i.e., <strong>the</strong> extent to which members plan to remain with <strong>the</strong>ir current organization).<br />
Individual outcomes—negative indices. The extent to which members experience excessive or conflicting dem<strong>and</strong>s or<br />
pressures (stressors) <strong>and</strong> psychological reactions to such dem<strong>and</strong>s <strong>and</strong> pressures (stress or strain) have been described as<br />
indicators <strong>of</strong> organizational ineffectiveness (e.g., Georgopolous & Tannenbaum, 1957; Kreitner & Kinicki, 1998; Pennings,<br />
1975) <strong>and</strong> as outcomes <strong>of</strong> an organization’s operating culture <strong>and</strong> behavioral norms (e.g., Kahn, Wolfe, Quinn,<br />
Snoek, & Rosenthal, 1964; Katz & Kahn, 1966; van der Velde & Class, 1995). The <strong>OEI</strong> measures three types <strong>of</strong> negative<br />
individual outcomes:<br />
• role conflict (i.e., <strong>the</strong> extent to which members receive inconsistent messages from <strong>the</strong> organization <strong>and</strong> are<br />
expected to do things that conflict with <strong>the</strong>ir own preferences),<br />
• job insecurity (i.e., <strong>the</strong> extent to which members are apprehensive about <strong>the</strong>ir continued employment with <strong>the</strong><br />
organization), <strong>and</strong><br />
• stress (i.e., <strong>the</strong> extent to which members feel <strong>the</strong>y are pushed beyond <strong>the</strong>ir normal range <strong>of</strong> comfort by<br />
organizational dem<strong>and</strong>s, pressures, or conflicts).<br />
Group Outcomes. Group-level outcomes such as teamwork have been used as indicators <strong>of</strong> organizational effectiveness<br />
(e.g., Cunningham, 1977; Georgopolous & Tannenbaum, 1957; Kaplan & Norton, 1996) <strong>and</strong> have been proposed to<br />
be outcomes <strong>of</strong> organizational culture <strong>and</strong> behavioral norms (e.g., Cooke & Szumal, 1993, 2000; Hackman & Oldham,<br />
1980; Ouchi, 1981). The <strong>OEI</strong> measures three types <strong>of</strong> group-level outcomes:<br />
• intra-unit cooperation (i.e., cooperation within groups),<br />
• inter-unit coordination (i.e., coordination between groups), <strong>and</strong><br />
• departmental-level quality (i.e., <strong>the</strong> quality <strong>of</strong> work performed by one’s own department).<br />
Organizational outcomes. Quality <strong>of</strong> service is commonly used as an indicator <strong>of</strong> organizational effectiveness (e.g.,<br />
Cunningham, 1977; Friedl<strong>and</strong>er & Pickle, 1968; Hitt, 1988; Kreitner & Kinicki, 1998; Seashore, 1965) <strong>and</strong> has been<br />
identified as an outcome <strong>of</strong> organizational culture <strong>and</strong> behavioral norms (e.g., B<strong>and</strong>, 1991; Cooke & Szumal, 2000;<br />
Jablonski, 1990; Klein, 1992; Zeithaml, Parasuraman, <strong>and</strong> Berry, 1990). Similarly, an organization’s ability to successfully<br />
adapt to changes in its external environment has been used as an indicator <strong>of</strong> organizational effectiveness <strong>and</strong> has<br />
been proposed to be an outcome <strong>of</strong> culture (e.g., Kotter & Heskett, 1992; Peters & Waterman, 1983). Thus, <strong>the</strong> <strong>OEI</strong><br />
includes two measures <strong>of</strong> organizational-level outcomes:<br />
• organizational-level quality (i.e., <strong>the</strong> extent to which members believe <strong>the</strong> organization provides high quality<br />
products <strong>and</strong> services to external clients) <strong>and</strong><br />
• external adaptability (i.e., <strong>the</strong> extent to which <strong>the</strong> organization effectively recognizes <strong>and</strong> responds to changes<br />
in its external environment).<br />
Method<br />
Sample<br />
The reliability <strong>and</strong> validity <strong>of</strong> <strong>the</strong> <strong>OEI</strong> scales were examined with a sample <strong>of</strong> 6,444 members <strong>of</strong> 1,080 organizational<br />
units that were r<strong>and</strong>omly selected to participate in a project directed by Dr. Robert A. Cooke that included completing<br />
both <strong>the</strong> OCI <strong>and</strong> <strong>OEI</strong> primarily for research purposes. An organizational unit is defined here as a group <strong>of</strong> people<br />
6 Copyright © 2012 by <strong>Human</strong> Synergistics International
RELIAB<strong>IL</strong>ITY & VALIDITY<br />
humansynergistics.com<br />
Organizational Effectiveness Inventory ®<br />
who work under <strong>the</strong> same manager or supervisor. For most <strong>of</strong> <strong>the</strong> organizational units, a sample <strong>of</strong> 4 to 6 members<br />
were asked to complete both <strong>the</strong> OCI <strong>and</strong> <strong>the</strong> <strong>OEI</strong>.<br />
Procedure<br />
Data collection on various prototype versions <strong>of</strong> <strong>the</strong> <strong>OEI</strong> began over a decade ago <strong>and</strong> remains ongoing with <strong>the</strong> current<br />
marketed version. Although <strong>the</strong>re is considerable overlap in <strong>the</strong> different <strong>OEI</strong> prototypes <strong>and</strong> versions, <strong>the</strong>re are<br />
also some differences. Due to concerns regarding survey length, some prototype versions included measures <strong>of</strong> outcomes<br />
or causal factors that were not included in o<strong>the</strong>r versions. In addition, some scales were modified over time to<br />
enhance <strong>the</strong>ir reliability <strong>and</strong> validity or to reduce <strong>the</strong> overall length <strong>of</strong> <strong>the</strong> survey. The analyses reported here focus on<br />
<strong>the</strong> scales included in <strong>the</strong> current marketed version <strong>of</strong> <strong>the</strong> <strong>OEI</strong>.<br />
Analyses<br />
Means <strong>and</strong> st<strong>and</strong>ard deviations were computed for all <strong>of</strong> <strong>the</strong> <strong>OEI</strong> scales. Scores for multiple-item scales are based on<br />
<strong>the</strong> mean <strong>of</strong> <strong>the</strong> responses to <strong>the</strong> items included in <strong>the</strong> scales. Responses to <strong>OEI</strong> items that are worded in terms <strong>of</strong> <strong>the</strong><br />
opposite extreme <strong>of</strong> <strong>the</strong> scales that <strong>the</strong>y measure were reversed before computing scale scores <strong>and</strong> conducting internal<br />
consistency analyses.<br />
Internal consistency. Thirty-seven <strong>of</strong> <strong>the</strong> 43 <strong>OEI</strong> scales consist <strong>of</strong> multiple items. The internal consistency <strong>of</strong> <strong>the</strong>se<br />
scales was estimated using Cronbach’s alpha. Cronbach’s alpha represents <strong>the</strong> average correlation among all items<br />
included in a given scale <strong>and</strong> provides an estimate <strong>of</strong> <strong>the</strong> extent to which <strong>the</strong> observed score for a particular scale is<br />
representative <strong>of</strong> <strong>the</strong> “true” score for that measure (i.e., a score that does not contain any measurement error). Alphas<br />
that are too high (i.e., close to 1.00) suggest that <strong>the</strong> scale may be too narrow in focus <strong>and</strong> <strong>the</strong> items too similar to<br />
make a unique contribution. Alphas that are too low (i.e., close to 0.00) suggest that <strong>the</strong> items may be covering too<br />
broad a domain, are measuring different constructs, or are ambiguous in <strong>the</strong>ir meaning. Alpha coefficients between .70<br />
<strong>and</strong> .80 are generally considered to be ideal <strong>and</strong> provide strong support for <strong>the</strong> stability <strong>of</strong> <strong>the</strong> scale scores.<br />
Inter-rater reliability. Inter-rater reliability was tested by conducting a series <strong>of</strong> one-way analyses <strong>of</strong> variance<br />
(ANOVA) with organizational unit as <strong>the</strong> independent variable <strong>and</strong> <strong>the</strong> <strong>OEI</strong> outcomes <strong>and</strong> causal factors as <strong>the</strong><br />
dependent variables. The F statistics from <strong>the</strong> ANOVAs were used to determine whe<strong>the</strong>r <strong>the</strong> variance in responses <strong>of</strong><br />
members from different organizational units were significantly greater than <strong>the</strong> variance in responses <strong>of</strong> members from<br />
<strong>the</strong> same unit. Significant F statistics provide support for inter-rater consistency <strong>and</strong> <strong>the</strong> aggregation <strong>of</strong> respondents’<br />
<strong>OEI</strong> scores to <strong>the</strong> unit- or organizational-level. The eta 2 statistics from <strong>the</strong> ANOVAs are also reported as <strong>the</strong>y provide<br />
an estimate <strong>of</strong> <strong>the</strong> percentage <strong>of</strong> variance in respondents’ <strong>OEI</strong> scores that is explained by unit membership.<br />
Demonstration <strong>of</strong> inter-rater consistency is particularly important for <strong>OEI</strong> measures <strong>of</strong> unit- or organizational-level<br />
phenomena (i.e., mission <strong>and</strong> philosophy, structures, human resource management, appraisal <strong>and</strong> reinforcement, skills/<br />
qualities, <strong>and</strong> group <strong>and</strong> organizational outcomes). Unlike <strong>the</strong> measures <strong>of</strong> individual- or job-level phenomena (i.e.,<br />
goal setting, technology, <strong>and</strong> individual outcomes), <strong>the</strong> variance in reports <strong>of</strong> group- <strong>and</strong> organizational-level phenomena<br />
by members <strong>of</strong> <strong>the</strong> same unit is more likely due to error than true variance. In turn, <strong>the</strong> inter-rater reliability results<br />
provide an indication <strong>of</strong> <strong>the</strong> stability <strong>of</strong> unit or organizational averages along particular measures.<br />
Copyright © 2012 by <strong>Human</strong> Synergistics International<br />
7
RELIAB<strong>IL</strong>ITY & VALIDITY<br />
humansynergistics.com<br />
Organizational Effectiveness Inventory ®<br />
Criterion-related validity. Since it is presumed that <strong>the</strong> causal factors <strong>and</strong> outcomes measured by <strong>the</strong> <strong>OEI</strong> are related<br />
to organizational culture, correlational analyses were carried out between <strong>the</strong> <strong>OEI</strong> scales <strong>and</strong> <strong>the</strong> OCI measures <strong>of</strong> culture.<br />
The OCI measures 12 sets <strong>of</strong> behavioral norms <strong>and</strong> expectations associated with three general types <strong>of</strong> cultures<br />
(Cooke, 1989, pp. 12-13):<br />
• Constructive cultures, in which members are encouraged to interact with o<strong>the</strong>rs <strong>and</strong> approach tasks in ways<br />
that will help <strong>the</strong>m to meet <strong>the</strong>ir higher-order satisfaction needs (include Achievement, Self-Actualizing,<br />
<strong>Human</strong>istic-Encouraging, <strong>and</strong> Affiliative norms).<br />
• Passive/Defensive cultures, in which members believe <strong>the</strong>y must interact with people in a way that will not<br />
threaten <strong>the</strong>ir own security (include Approval, Conventional, Dependent, <strong>and</strong> Avoidance norms).<br />
• Aggressive/Defensive cultures, in which members are expected to approach tasks in forceful ways to protect<br />
<strong>the</strong>ir status <strong>and</strong> security (include Oppositional, Power, Competitive, <strong>and</strong> Perfectionistic norms).<br />
Previous studies based on <strong>the</strong> OCI suggest <strong>the</strong> relationships to be expected between <strong>the</strong> OCI <strong>and</strong> <strong>OEI</strong> measures (e.g.,<br />
Cooke & Szumal, 1993, 2000; Klein, 1992; Klein, Masi, & Weidner, 1995; Kosmoski-Goepfert, 1994; Szumal, 1998,<br />
van der Velde & Class, 1995). On <strong>the</strong> causal factor side, all <strong>of</strong> <strong>the</strong> <strong>OEI</strong> measures, with <strong>the</strong> exception <strong>of</strong> distribution<br />
<strong>of</strong> influence, use <strong>of</strong> punishment, <strong>and</strong> organizational sources <strong>of</strong> power, should be positively related to Constructive cultures<br />
<strong>and</strong> negatively related to Passive/Defensive <strong>and</strong> Aggressive/Defensive cultures. Distribution <strong>of</strong> influence, use <strong>of</strong><br />
punishment, <strong>and</strong> organizational sources <strong>of</strong> power all work against motivation, satisfaction, <strong>and</strong> high performance <strong>and</strong><br />
<strong>the</strong>refore should be negatively related to Constructive cultures <strong>and</strong> positively related to both types <strong>of</strong> defensive cultures.<br />
<strong>OEI</strong> measures <strong>of</strong> desirable outcomes (i.e., individual outcomes—positive indices, group outcomes, <strong>and</strong> organizational<br />
outcomes) should be positively related to <strong>the</strong> OCI’s Constructive cultures <strong>and</strong> negatively related to Passive/Defensive<br />
<strong>and</strong>, to a lesser degree, Aggressive/Defensive cultures. In contrast, <strong>the</strong> negative individual outcomes (role conflict, job<br />
insecurity, <strong>and</strong> stress) should be negatively related to Constructive cultures <strong>and</strong> positively related to Passive/Defensive<br />
<strong>and</strong> Aggressive/Defensive cultures.<br />
To test <strong>the</strong> criterion-related validity <strong>of</strong> <strong>the</strong> <strong>OEI</strong>, respondents’ <strong>OEI</strong> <strong>and</strong> OCI scale scores were aggregated to <strong>the</strong> unitlevel<br />
by computing <strong>the</strong> means for each unit. For <strong>the</strong> OCI, unit-level means along each <strong>of</strong> <strong>the</strong> 12 styles were converted<br />
to percentile scores <strong>and</strong> <strong>the</strong>n <strong>the</strong> average percentile scores for <strong>the</strong> Constructive, Passive/Defensive, <strong>and</strong> Aggressive/<br />
Defensive clusters were computed. Zero-order correlations were <strong>the</strong>n carried out between <strong>the</strong> aggregated <strong>OEI</strong> <strong>and</strong><br />
OCI scores. Evidence <strong>of</strong> criterion-related validity is provided by correlations that are significant <strong>and</strong> in <strong>the</strong> expected<br />
direction.<br />
Results <strong>and</strong> Interpretation<br />
<strong>Reliability</strong> <strong>of</strong> <strong>the</strong> Causal Factor Measures<br />
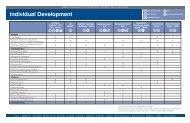
Mission <strong>and</strong> philosophy. The reliability results for <strong>the</strong> mission <strong>and</strong> philosophy scales are reported in Table 1 on <strong>the</strong> next<br />
page. Both scales demonstrate acceptable levels <strong>of</strong> internal consistency <strong>and</strong> inter-rater reliability. The alpha coefficients<br />
(.76 for articulation <strong>of</strong> mission <strong>and</strong> .72 for customer-service focus) are within <strong>the</strong> ideal range. In addition, <strong>the</strong> F statistics<br />
suggest that a significant amount <strong>of</strong> variance in respondents’ mission <strong>and</strong> philosophy scores are explained by <strong>the</strong>ir<br />
unit membership (p
RELIAB<strong>IL</strong>ITY & VALIDITY<br />
humansynergistics.com<br />
Organizational Effectiveness Inventory ®<br />
Table 1<br />
<strong>Reliability</strong> <strong>of</strong> <strong>the</strong> Mission <strong>and</strong> Philosophy Measures<br />
Table 1: <strong>Reliability</strong> <strong>of</strong> <strong>the</strong> Mission <strong>and</strong><br />
Philosophy Measures<br />
n M SD alpha F eta 2<br />
Articulation <strong>of</strong> Mission a 2743 3.53 0.92 .76 3.87*** .34<br />
Objectives/priorities are clear <strong>and</strong> understood by mem bers<br />
People have a clear underst<strong>and</strong>ing <strong>of</strong> mission <strong>and</strong> role<br />
Widely-shared philosophy provides employees an underst<strong>and</strong>ing<br />
Ceremonies are held to celebrate outst<strong>and</strong>ing work<br />
Members' actions illustrate philosophy <strong>and</strong> priorities<br />
Customer-Service Focus b 2046 3.63 0.82 .72 3.20*** .34<br />
Your department is responsible for client satisfaction<br />
You are encouraged to emphasize <strong>the</strong> perspective <strong>and</strong> needs <strong>of</strong> customers<br />
You are relied on to provide information about customers<br />
Your organization relies on you to help win customers <strong>and</strong> generate sales<br />
The organization responds effectively to changing needs <strong>of</strong> clients c<br />
Note. Scales are in boldface <strong>and</strong> are shaded. Item are listed below scales.<br />
a<br />
Scores for articulation <strong>of</strong> mission can range from 1 (disagree ) to 5 (agree ).<br />
b<br />
Scores for customer-service focus can range from 1 (not at all ) to 5 (to a very great extent ). Alpha=.75, F =3.63***, <strong>and</strong> eta 2 =.33 when <strong>the</strong><br />
OCI item measuring customer-service focus is not included in <strong>the</strong> scale.<br />
c<br />
OCI item.<br />
*p
RELIAB<strong>IL</strong>ITY & VALIDITY<br />
humansynergistics.com<br />
Organizational Effectiveness Inventory ®<br />
Systems. The reliability results for <strong>the</strong> <strong>OEI</strong> measures <strong>of</strong> systems are presented in Table 3. The alpha coefficients for<br />
<strong>the</strong> human resource management <strong>and</strong> appraisal <strong>and</strong> reinforcement scales are all within <strong>the</strong> ideal range <strong>and</strong> <strong>the</strong>refore<br />
provide support for <strong>the</strong>ir internal consistency. (Since each <strong>of</strong> <strong>the</strong> goal-setting scales consists <strong>of</strong> one item, only <strong>the</strong>ir<br />
inter-rater reliability could be examined.) Based on <strong>the</strong> ANOVA results, all <strong>of</strong> <strong>the</strong> <strong>OEI</strong> measures <strong>of</strong> systems demonstrate<br />
acceptable levels <strong>of</strong> inter-rater reliability (with approximately 23 to 32 percent <strong>of</strong> <strong>the</strong> variance in respondents’<br />
scale scores explained by <strong>the</strong>ir unit membership). In turn, <strong>the</strong>se results provide justification for aggregating respondents’<br />
scores to <strong>the</strong> unit- or organizational-levels.<br />
Table 3: <strong>Reliability</strong> <strong>of</strong> <strong>the</strong> Systems Measures<br />
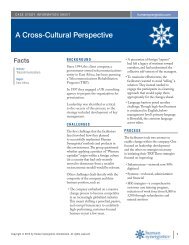
Technology. The reliability results for <strong>the</strong> <strong>OEI</strong> technology scales are reported in Table 4. The internal consistency <strong>of</strong><br />
<strong>the</strong> autonomy, variety, feedback, task identity, <strong>and</strong> significance scales are acceptable, but most are slightly below <strong>the</strong><br />
ideal range (alphas range from .62 for <strong>the</strong> task identity scale to .70 for <strong>the</strong> variety scale). These moderately low coefficients<br />
were expected for two reasons. First, because so many job characteristics were being measured, an effort was<br />
made to measure each with as few items as possible. (The likelihood <strong>of</strong> achieving high alpha coefficients decreases as<br />
<strong>the</strong> number <strong>of</strong> items per scale decreases.) Second, to reduce <strong>the</strong> creation <strong>of</strong> response sets, negatively worded items were<br />
included in a number <strong>of</strong> <strong>the</strong>se measures. (Reversed items suppress alpha coefficients but enhance <strong>the</strong> overall quality<br />
<strong>of</strong> <strong>the</strong> measures by ensuring that respondents do not systematically <strong>and</strong> indiscriminately select high or low responses<br />
without regard to <strong>the</strong> content <strong>of</strong> <strong>the</strong> questions.)<br />
Even though <strong>the</strong> scales focus on technology at <strong>the</strong> job-level, <strong>the</strong> results <strong>of</strong> <strong>the</strong> one-way ANOVAs indicate a reasonable<br />
level <strong>of</strong> consistency in <strong>the</strong> reports <strong>of</strong> members within <strong>the</strong> same unit. Approximately 19 to 36 percent <strong>of</strong> <strong>the</strong> variance in<br />
respondents’ reports <strong>of</strong> technology is explained by <strong>the</strong>ir unit membership. Taken toge<strong>the</strong>r, <strong>the</strong> internal consistency <strong>and</strong><br />
inter-rater reliability results provide reasonable support for stability <strong>of</strong> <strong>the</strong> <strong>OEI</strong> technology measures.<br />
10 Copyright © 2012 by <strong>Human</strong> Synergistics International
RELIAB<strong>IL</strong>ITY & VALIDITY<br />
humansynergistics.com<br />
Organizational Effectiveness Inventory ®<br />
Table 4<br />
<strong>Reliability</strong> <strong>of</strong> <strong>the</strong> Technology Measures<br />
Table 4: <strong>Reliability</strong> <strong>of</strong> <strong>the</strong> Technology Measures<br />
n M SD alpha F eta 2<br />
Autonomy 4946 4.18 0.97 .67 3.03*** .36<br />
It is my responsibility to decide how my job gets done<br />
I am allow ed to plan how my work is carried out<br />
Variety 4947 4.31 0.94 .70 2.89*** .35<br />
I get to do a lot <strong>of</strong> different things on my job<br />
My job requires that I use a variety <strong>of</strong> different skills<br />
Feedback 2454 3.94 0.85 .65 1.73*** .19<br />
Just doing <strong>the</strong> work required by my job provides feedback<br />
I can see how well I'm doing even if no one tells me<br />
The design <strong>of</strong> my job makes it difficult to m onitor my performance a<br />
Task Identity 2455 3.83 0.95 .62 2.02*** .21<br />
My job involves performing a complete service<br />
My job allows me to do a "whole piece" <strong>of</strong> work<br />
My job limits me to only a small fragment <strong>of</strong> some larger task a<br />
Significance 2459 4.28 0.77 .65 2.01*** .21<br />
A lot <strong>of</strong> people can be affected by how well I do my work<br />
My job has a significant im pact on <strong>the</strong> work/lives <strong>of</strong> o<strong>the</strong>rs<br />
Poor performance on my part would have little or no impact on o<strong>the</strong>rs a<br />
Interdependence 3438 4.22 1.15 1.93*** .23<br />
My job is basically a "one person show" a<br />
Note. Scale are in boldface <strong>and</strong> are shaded. Items are listed below scales. Scale scores can range from 1 (disagree ) to 5 (agree ).<br />
a<br />
Reversed item.<br />
*p
RELIAB<strong>IL</strong>ITY & VALIDITY<br />
humansynergistics.com<br />
Organizational Effectiveness Inventory ®<br />
Skills/Qualities. The reliability results for <strong>the</strong> <strong>OEI</strong> measures <strong>of</strong> skills/qualities are shown in Table 5 (on previous page). All <strong>of</strong><br />
<strong>the</strong> scales demonstrate reasonable levels <strong>of</strong> both internal consistency <strong>and</strong> inter-rater reliability. Alpha coefficients range from<br />
.65 for <strong>the</strong> organizational bases <strong>of</strong> power scale to .86 for <strong>the</strong> upward communication <strong>and</strong> consideration scales. (Note that <strong>the</strong><br />
organizational bases <strong>of</strong> power scale as well as <strong>the</strong> personal bases scale are abbreviated versions <strong>of</strong> lengthier scales with higher reliability<br />
coefficients.) The F statistics are all significant <strong>and</strong> <strong>the</strong> eta 2 s indicate that approximately 21 to 37 percent <strong>of</strong> <strong>the</strong> variance in<br />
respondents’ descriptions is explained by <strong>the</strong>ir unit membership.<br />
Criterion-Related <strong>Validity</strong> <strong>of</strong> <strong>the</strong> Causal Factor Measures<br />
The criterion-related validity <strong>of</strong> <strong>the</strong> <strong>OEI</strong> measures <strong>of</strong> causal factors with respect to organizational culture is demonstrated by <strong>the</strong><br />
correlations presented in Table 6. As expected, all <strong>of</strong> <strong>the</strong> causal factors except distribution <strong>of</strong> influence, use <strong>of</strong> punishment, <strong>and</strong><br />
organizational bases <strong>of</strong> power are positively related to Constructive cultures, negatively related to Passive/Defensive cultures, <strong>and</strong>,<br />
in most cases, negatively related to Aggressive/Defensive cultures. Also consistent with expectations, distribution <strong>of</strong> influence <strong>and</strong><br />
use <strong>of</strong> punishment are positively related to both types <strong>of</strong> Defensive cultures <strong>and</strong> are negatively related to Constructive cultures.<br />
Organizational bases <strong>of</strong> power are negatively related to both types <strong>of</strong> Defensive cultures, as predicted; however, organizational<br />
bases <strong>of</strong> power are not significantly correlated with Constructive cultures. Overall, <strong>the</strong> correlations provide fairly strong support for<br />
<strong>the</strong> criterion-related validity <strong>of</strong> <strong>the</strong> <strong>OEI</strong> causal factor measures.<br />
Table 6<br />
Criterion-Related <strong>Validity</strong> <strong>of</strong> <strong>OEI</strong> Causal Factor Measures<br />
Table 6: Criterion-Related <strong>Validity</strong> <strong>of</strong> <strong>OEI</strong><br />
Causal Factor Measures<br />
OCI Culture Measures<br />
Passive/ Aggressive/<br />
<strong>OEI</strong> Causal Factor Measures Constructive Defensive Defensive<br />
Mission <strong>and</strong> Philosophy<br />
Articulation <strong>of</strong> Mission (n =321) .66*** -.42*** -.23***<br />
Customer-Service Focus (n =287) .54*** -.20** .02<br />
Structures<br />
Total Influence (n =1077) .43*** -.16*** -.06*<br />
Distribution <strong>of</strong> Influence (n =1077) -.19*** .19*** .14***<br />
Empowerment (n =292) .44*** -.31*** -.24***<br />
Employee Involvement (n =321) .61*** -.63*** -.37***<br />
Systems<br />
Selection/Placement (n =292) .57*** -.46*** -.31***<br />
Training & Development (n =321) .67*** -.44*** -.24***<br />
Respect for Members (n =292) .60*** -.60*** -.45***<br />
Fairness <strong>of</strong> Appraisals (n =416) .53*** -.41*** -.22***<br />
Use <strong>of</strong> Rewards (n =321) .51*** -.42*** -.22***<br />
Use <strong>of</strong> P unishment (n =321) -.42*** .56*** .56***<br />
Goal Clarity a (n =983) .27*** -.11** -.06*<br />
Goal Difficulty a (n =983) .19*** -.20*** -.09**<br />
Participation in Goal Setting a (n =982) .30*** -.30*** -.20***<br />
Goal Acceptance a (n =624) .29*** -.28*** -.25***<br />
Technology<br />
Autonomy (n =775) .25*** -.35*** -.21***<br />
Variety (n =775) .31*** -.24*** -.14***<br />
Feedback (n =292) .28*** -.30*** -.22***<br />
Task Identity (n =292) .28*** -.25*** -.17***<br />
Significance (n =292) .20** -.25*** -.16**<br />
Interdependence (n =465) .17*** -.13** -.08<br />
Skills/Qualities<br />
Downward Communication (n=321) .56*** -.47*** -.30***<br />
Upward Communication (n =321) .57*** -.54*** -.38***<br />
Communication for Learning (n =292) .58*** -.49*** -.34***<br />
Interaction Facilitation (n =574) .51*** -.26*** -.10*<br />
Task Facilitation (n =574) .47*** -.14*** -.05<br />
Goal Emphasis (n =574) .53*** -.27*** -.13**<br />
C onsideration (n =464) .48*** -.30*** -.25***<br />
Personal Bases <strong>of</strong> Power (n =624) .51*** -.31*** -.20***<br />
Organizational Bases <strong>of</strong> Power (n =465) .03 .14** .27***<br />
Note. Zero-order correlations are presented based on analyses carried out at <strong>the</strong> unit-level. The number<br />
<strong>of</strong> units on which particular correlations are based is indicated next to <strong>the</strong> causal factor scales.<br />
a<br />
These m easures reflect <strong>the</strong> percentage <strong>of</strong> respondents within each unit w ho endorsed <strong>the</strong> most<br />
desirable option (e.g., clear <strong>and</strong> specific , fairly challenging , jointly set by you <strong>and</strong> your superiors ,<br />
<strong>and</strong> fully accepted by you ) for a particular goal-setting item.<br />
*p
RELIAB<strong>IL</strong>ITY & VALIDITY<br />
humansynergistics.com<br />
Organizational Effectiveness Inventory ®<br />
<strong>Reliability</strong> <strong>of</strong> <strong>the</strong> Outcome Measures<br />
Table 7 summarizes <strong>the</strong> results <strong>of</strong> <strong>the</strong> reliability analyses carried out on <strong>the</strong> <strong>OEI</strong> outcome measures. All <strong>of</strong> <strong>the</strong> scales demonstrate<br />
acceptable levels <strong>of</strong> internal consistency <strong>and</strong> inter-rater reliability, as indicated by <strong>the</strong> alpha, F, <strong>and</strong> eta 2 statistics. Alphas for <strong>the</strong><br />
outcome measures range from .69 (for inter-unit teamwork <strong>and</strong> cooperation) to .82 (for satisfaction, department-level quality, <strong>and</strong><br />
organizational-level quality). All <strong>of</strong> <strong>the</strong> F statistics are significant at p
RELIAB<strong>IL</strong>ITY & VALIDITY<br />
humansynergistics.com<br />
Organizational Effectiveness Inventory ®<br />
Criterion-Related <strong>Validity</strong> <strong>of</strong> <strong>the</strong> Outcome Measures<br />
The results <strong>of</strong> <strong>the</strong> correlational analyses carried out between <strong>the</strong> <strong>OEI</strong> outcome scales <strong>and</strong> <strong>the</strong> three OCI measures <strong>of</strong><br />
culture are shown in Table 8. It was hypo<strong>the</strong>sized that <strong>the</strong> desirable <strong>OEI</strong> outcome measures would be positively related<br />
to Constructive cultures <strong>and</strong> negatively related to Passive/Defensive <strong>and</strong> Aggressive/Defensive cultures. Consistent<br />
with this prediction, <strong>the</strong> individual outcomes—positive indices, group outcomes, <strong>and</strong> organizational outcomes are all<br />
positively related to Constructive cultures <strong>and</strong> are all negatively related to both Passive/Defensive <strong>and</strong> Aggressive/<br />
Defensive cultures.<br />
The undesirable outcomes measured by <strong>the</strong> <strong>OEI</strong> (i.e., role conflict, job insecurity, <strong>and</strong> stress) were predicted to be negatively<br />
related to Constructive cultures <strong>and</strong> positively related to Passive/Defensive <strong>and</strong> Aggressive/Defensive cultures.<br />
As shown in Table 8, <strong>the</strong>se outcomes are all negatively related to Constructive cultures <strong>and</strong> are positively related to<br />
both Passive/Defensive <strong>and</strong> Aggressive/Defensive cultures. Thus, <strong>the</strong> results <strong>of</strong> <strong>the</strong> correlational analyses provide support<br />
Table for <strong>the</strong> 8 criterion-related validity <strong>of</strong> <strong>the</strong> <strong>OEI</strong> outcome measures.<br />
Criterion-Related <strong>Validity</strong> <strong>of</strong> <strong>OEI</strong> Outcome Measures<br />
Table 8: Criterion-Related <strong>Validity</strong> <strong>of</strong> <strong>OEI</strong><br />
OCI Culture Measures<br />
Outcome Measures<br />
Passive/ Aggressive/<br />
<strong>OEI</strong> Outcome Measures Constructive Defensive Defensive<br />
Individual Outcomes--Positive Indices<br />
Role Clarity (n =320) .55*** -.43*** -.31***<br />
Motivation (n =291) .61*** -.48*** -.29***<br />
Satisfaction (n =320) .64*** -.51*** -.35***<br />
Intention to Stay (n =463) .36*** -.31*** -.18***<br />
Individual Outcomes--Negative Indices<br />
Role Conflict (n =291) -.46*** .61*** .53***<br />
Job Insecurity (n =480) -.27*** .21*** .18***<br />
Stress (n =624) -.29*** .29*** .33***<br />
Group Outcomes<br />
Intra-Unit Teamwork <strong>and</strong> Cooperation (n =321) .36*** -.50*** -.48***<br />
Inter-Unit Coordination (n =292) .49*** -.33*** -.21***<br />
Departmental-Level Quality (n =321) .50*** -.37*** -.21***<br />
Organizational Outcomes<br />
Organizational-Level Quality (n =287) .50*** -.33*** -.12*<br />
External A daptability (n =288) .55*** -.34*** -.14*<br />
Note. Zero-order correlations are presented based on analyses carried out at <strong>the</strong> unit-level. The number<br />
<strong>of</strong> units on which particular correlations are based is specified next to <strong>the</strong> outcome scales.<br />
*p
RELIAB<strong>IL</strong>ITY & VALIDITY<br />
humansynergistics.com<br />
Organizational Effectiveness Inventory ®<br />
Reporting <strong>OEI</strong> Results<br />
All <strong>of</strong> <strong>the</strong> multiple-item scales included in <strong>the</strong> <strong>OEI</strong> demonstrated reasonable—<strong>and</strong>, in many cases, ideal—levels <strong>of</strong><br />
internal consistency. Thus, while results for individual items should be examined to provide a deeper underst<strong>and</strong>ing <strong>of</strong><br />
<strong>the</strong> scale, <strong>the</strong> results for <strong>the</strong> scale as a whole provides a more stable measure <strong>of</strong> <strong>the</strong> particular outcome or causal factor.<br />
Demonstration <strong>of</strong> inter-rater reliability is critical to establishing <strong>the</strong> psychometric adequacy <strong>of</strong> scales purported to<br />
measure unit-level or organizational-level phenomena. Responses to all <strong>of</strong> <strong>the</strong> <strong>OEI</strong> scales measuring organizationallevel<br />
phenomena (i.e., <strong>the</strong> measures <strong>of</strong> mission <strong>and</strong> philosophy, structures, human resource management, quality <strong>of</strong><br />
communication, <strong>and</strong> organizational outcomes) were found to be significantly more consistent within units than <strong>the</strong>y<br />
were between units. Similarly, responses to scales measuring unit-level phenomena (i.e., measures <strong>of</strong> appraisal <strong>and</strong><br />
reinforcement, supervisory/managerial leadership, supervisory/managerial bases <strong>of</strong> power, <strong>and</strong> group outcomes) were<br />
all found to be significantly more consistent within units than between units. In turn, <strong>the</strong>se results suggest that <strong>OEI</strong><br />
scores based on unit or organizational averages are both meaningful <strong>and</strong> appropriate.<br />
Although demonstration <strong>of</strong> inter-rater reliability is not critical for <strong>the</strong> measures <strong>of</strong> individual-level phenomena, <strong>the</strong><br />
responses to many <strong>of</strong> <strong>the</strong> individual-level <strong>OEI</strong> scales showed significant levels <strong>of</strong> consistency within organizational<br />
units. The responses to all <strong>of</strong> <strong>the</strong> measures <strong>of</strong> goal setting, technology, <strong>and</strong> individual outcomes showed significantly<br />
greater consistency within units than between units or organizations. These results are expected given that respondents<br />
within <strong>the</strong> same unit tended to hold similar types <strong>of</strong> jobs. Subsequently, aggregated results along <strong>the</strong>se measures are<br />
likely to be stable <strong>and</strong> meaningful, particularly when respondents hold similar types <strong>of</strong> jobs or carry out similar types <strong>of</strong><br />
tasks.<br />
Streng<strong>the</strong>ning <strong>the</strong> <strong>OEI</strong><br />
The reliability results also provide direction in terms <strong>of</strong> streng<strong>the</strong>ning particular measures. For example, <strong>the</strong> alpha coefficients<br />
for <strong>the</strong> empowerment, feedback, task identify, significance, <strong>and</strong> organizational bases <strong>of</strong> power scales were low<br />
relative to <strong>the</strong> o<strong>the</strong>r scales <strong>and</strong> were slightly below <strong>the</strong> ideal range for internal consistency reliability. As noted above,<br />
<strong>the</strong>se modest coefficients were anticipated in consideration <strong>of</strong> <strong>the</strong> brevity <strong>of</strong> most <strong>of</strong> <strong>the</strong>se scales <strong>and</strong> <strong>the</strong>ir inclusion<br />
<strong>of</strong> negatively worded items. The significant amount <strong>of</strong> agreement among raters along <strong>the</strong>se measures suggests that <strong>the</strong><br />
lower levels <strong>of</strong> internal consistency are likely due to <strong>the</strong>se factors <strong>and</strong> breadth <strong>of</strong> <strong>the</strong> domains assessed as opposed to<br />
<strong>the</strong> construction <strong>of</strong> <strong>the</strong> items <strong>the</strong>mselves. Thus, if higher alpha coefficients were desired, simply adding items ra<strong>the</strong>r<br />
than deleting any <strong>of</strong> <strong>the</strong> existing items could achieve this.<br />
Similarly, while <strong>the</strong> single-item measures <strong>of</strong> goal setting <strong>and</strong> interdependence demonstrate reasonable levels <strong>of</strong> interrater<br />
reliability, exp<strong>and</strong>ing <strong>the</strong>se scales to include multiple items would permit tests <strong>of</strong> internal consistency that would<br />
fur<strong>the</strong>r streng<strong>the</strong>n support for <strong>the</strong>ir stability. Exp<strong>and</strong>ing <strong>the</strong> number <strong>of</strong> items measuring influence at different levels<br />
might also be considered; however, responses along <strong>the</strong> current measures are well distributed, demonstrate reasonable<br />
levels <strong>of</strong> inter-rater reliability, <strong>and</strong> follow <strong>the</strong> format described by Tannenbaum (1968) for measuring <strong>the</strong> structure <strong>of</strong><br />
influence within organizations.<br />
Whereas <strong>the</strong> reliability results suggest that adding items to <strong>the</strong> <strong>OEI</strong> would likely improve <strong>the</strong> stability <strong>of</strong> certain<br />
scales, <strong>the</strong> downside would be a longer survey that would require more time to complete. In turn, <strong>the</strong>re is a risk that<br />
by leng<strong>the</strong>ning <strong>the</strong> survey <strong>the</strong> reliability <strong>of</strong> <strong>the</strong> existing measures could be compromised (for example, if people answer<br />
questions less carefully in an effort to finish <strong>the</strong> survey in a certain amount <strong>of</strong> time). While <strong>the</strong> <strong>OEI</strong> is currently not<br />
Copyright © 2012 by <strong>Human</strong> Synergistics International<br />
15
RELIAB<strong>IL</strong>ITY & VALIDITY<br />
humansynergistics.com<br />
Organizational Effectiveness Inventory ®<br />
an unreasonably long survey, it is usually administered along with <strong>the</strong> OCI. One alternative would be to develop items<br />
that could be added to <strong>the</strong> supplementary question section <strong>of</strong> <strong>the</strong> <strong>OEI</strong> when an organization expresses particular<br />
interest in increasing <strong>the</strong> reliability <strong>of</strong> any <strong>of</strong> <strong>the</strong> single-item scales or <strong>the</strong> scales with less than ideal levels <strong>of</strong> internal<br />
consistency. (Supplementary items are already available for scales such as organizational bases <strong>of</strong> power, which are condensed<br />
versions <strong>of</strong> lengthier scales <strong>and</strong> sub-scales that have been previously tested.)<br />
Conclusion<br />
The <strong>OEI</strong> is a unique <strong>and</strong> potentially powerful tool for measuring behaviors <strong>and</strong> attitudes associated with organizational<br />
effectiveness as well as <strong>the</strong> internal factors <strong>and</strong> conditions that influence effectiveness <strong>and</strong>, in turn, be used as<br />
levers for change. All <strong>of</strong> <strong>the</strong> <strong>OEI</strong> scales demonstrate reasonable levels <strong>of</strong> reliability <strong>and</strong> validity. Subsequently, <strong>the</strong> <strong>OEI</strong><br />
provides an excellent alternative to <strong>the</strong> use <strong>of</strong> more traditional (<strong>and</strong> limited) attitudinal surveys, an appropriate supplement<br />
to measures <strong>of</strong> organizational culture, <strong>and</strong> an efficient means by which organizations can identify important<br />
levers for change <strong>and</strong> improvement.<br />
16 Copyright © 2012 by <strong>Human</strong> Synergistics International
RELIAB<strong>IL</strong>ITY & VALIDITY<br />
humansynergistics.com<br />
Organizational Effectiveness Inventory ®<br />
References<br />
Allen, R. F. (1985). Four phases for bringing about cultural change. In R. H. Kilmann, M. J. Saxton, & R. Serpa<br />
(Eds.), Gaining control <strong>of</strong> <strong>the</strong> corporate culture. San Francisco, CA: Jossey-Bass.<br />
B<strong>and</strong>, W. A. (1991). Creating value for customers: Designing <strong>and</strong> implementing a total corporate strategy. New York, NY:<br />
John Wiley & Sons.<br />
Bowers, D. G., & Seashore, S. E. (1966). Predicting organizational effectiveness with a four-factor <strong>the</strong>ory <strong>of</strong><br />
leadership. Administrative Science Quarterly, 11, 238-263.<br />
Cooke, R. A. (1997). Organizational Effectiveness Inventory. <strong>Arlington</strong> <strong>Heights</strong>, <strong>IL</strong>: <strong>Human</strong> Synergistics/Center for<br />
Applied Research.<br />
Cooke, R. A. (1995). Organizational Effectiveness Inventory. <strong>Arlington</strong> <strong>Heights</strong>, <strong>IL</strong>: <strong>Human</strong> Synergistics/Center for<br />
Applied Research.<br />
Cooke, R. A. (1989). Organizational Culture Inventory, leader’s guide (2nd ed.). Plymouth, MI: <strong>Human</strong> Synergistics.<br />
Cooke, R. A., & Lafferty, J. C. (1994). Level V: Organizational Culture Inventory (Form III). Plymouth, MI: <strong>Human</strong><br />
Synergistics.<br />
Cooke, R. A., & Lafferty, J. C. (1983). Level V: Organizational Culture Inventory (Form I). Plymouth, MI: <strong>Human</strong><br />
Synergistics.<br />
Cooke, R. A., & Szumal, J. L. (2000). Using <strong>the</strong> Organizational Culture Inventory to underst<strong>and</strong> <strong>the</strong> operating<br />
cultures <strong>of</strong> organizations. In N. M. Ashkanasy, C. P. M. Wilderom, & M. F. Peterson (Eds.), H<strong>and</strong>book <strong>of</strong><br />
organizational culture <strong>and</strong> climate. Thous<strong>and</strong> Oaks, CA: Sage.<br />
Cooke, R. A., & Szumal, J. L. (1993). Measuring normative beliefs <strong>and</strong> shared behavioral expectations in<br />
organizations: The reliability <strong>and</strong> validity <strong>of</strong> <strong>the</strong> Organizational Culture Inventory. Psychological Reports, 72,<br />
1299-1330.<br />
Cooke, R. A., & Szumal, J. L. (1987). Interpreting <strong>the</strong> cultural styles measured by <strong>the</strong> OCI. In R. A. Cooke (Ed.),<br />
Organizational Culture Inventory: Level V leader’s manual. Plymouth, MI: <strong>Human</strong> Synergistics.<br />
Cunningham, J. B. (1977). Approaches to <strong>the</strong> evaluation <strong>of</strong> organizational effectiveness. Academy <strong>of</strong> Management<br />
Review, 2, 463-474.<br />
Deal, T. E., & Kennedy, A. A. (1982). Corporate cultures: The rites <strong>and</strong> rituals <strong>of</strong> corporate life. Reading, MA: Irwin.<br />
Friedl<strong>and</strong>er, F., & Pickle, H. (1968). Components <strong>of</strong> effectiveness in small organizations. Administrative Science<br />
Quarterly, 13, 289-304.<br />
Georgopoulos, B. S. (1986). Organizational structure, problem solving, <strong>and</strong> effectiveness. San Francisco: Jossey-Bass.<br />
Georgopoulos, B. S., & Tannenbaum, A. S. (1957). A study <strong>of</strong> organizational effectiveness. American Sociological<br />
Review, 22, 534-540.<br />
Kosmoski-Goepfert, K. (1994). Effects <strong>of</strong> registered nurses’ work design on hospital culture, quality, <strong>and</strong> cost <strong>of</strong><br />
patient care. Unpublished doctoral dissertation, University <strong>of</strong> Illinois at Chicago.<br />
Hackman, J. R. & Oldham, G. R. (1980). Work redesign. Reading, MA: Addison-Wesley.<br />
Copyright © 2012 by <strong>Human</strong> Synergistics International<br />
17
RELIAB<strong>IL</strong>ITY & VALIDITY<br />
humansynergistics.com<br />
Organizational Effectiveness Inventory ®<br />
Hitt, M. A. (1988). The measuring <strong>of</strong> organizational effectiveness: Multiple domains <strong>and</strong> constituencies.<br />
Management International Review, 28, 28-40.<br />
Jablonski, J. R. (1990). Total quality management: Competing in <strong>the</strong> 1990s. Albuquerque, NM: Technical Management<br />
Consortium.<br />
Kahn, R. L., Wolfe, D. M., Quinn, R. P., Snoek, J. D., & Rosenthal, R. A. (1964). Organizational stress: Studies in role<br />
conflict <strong>and</strong> ambiguity. New York, NY: Wiley.<br />
Kaplan, R. S., & Norton, D. P. (1996). The balanced scorecard. Boston, MA: Harvard Business School Press.<br />
Katz, D., & Kahn, R. L. (1966). The social psychology <strong>of</strong> organizations. New York, NY: Wiley.<br />
Klein, M. I. (1992). Corporate culture <strong>and</strong> store performance: Differences among high performance <strong>and</strong> low<br />
performance stores. Unpublished dissertation, Temple University.<br />
Klein, A. S., Masi, R. J., & Weidner, C. K. (1995). Organizational culture, distribution <strong>and</strong> amount <strong>of</strong> control, <strong>and</strong><br />
perceptions <strong>of</strong> quality. Group <strong>and</strong> Organization Management, 20, 122-148.<br />
Kotter, J. P., & Heskett, J. L. (1992). Corporate culture <strong>and</strong> performance. New York, NY: The Free Press.<br />
Kreitner, R., & Kinicki, A. (1998). Organizational behavior (4th ed.). Boston, MA: Irwin/McGraw-Hill.<br />
Latham, G. P., & Locke, E. A. (1979). Goal setting—a motivational technique that works. Organizational Dynamics,<br />
8, 68-80.<br />
Lawler, E. E., III. (1996). From <strong>the</strong> ground up: Six principles for building <strong>the</strong> new logic corporation. San Francisco,<br />
CA: Jossey-Bass.<br />
O’Reilly, C. (1989). Corporations, culture, <strong>and</strong> commitment: Motivation <strong>and</strong> social control in organizations.<br />
California Management Review, 31, 9-25.<br />
Ouchi, W. G. (1981). Theory Z. Reading, MA: Addison-Wesley.<br />
Pennings, J. M. (1975). The relevance <strong>of</strong> <strong>the</strong> structural-contingency model for organizational effectiveness.<br />
Administrative Science Quarterly, 20, 393-410.<br />
Peters, T. J., & Waterman, R. H. (1982). In search <strong>of</strong> excellence: Lessons from America’s best run companies. New York,<br />
NY: Harper & Row.<br />
Pritchard, R. D., Jones, S. D., Roth, P. L., Stuebing, K. K., & Ekeberg, S. E. (1988). Effects <strong>of</strong> group feedback, goal<br />
setting, <strong>and</strong> incentives on organizational productivity. Journal <strong>of</strong> Applied Psychology, 73, 337-358.<br />
Schein, E. H. (1983). The role <strong>of</strong> <strong>the</strong> founder in creating organizational culture. Organizational Dynamics, 12, 13-28.<br />
Seashore, S. E. (1965). Criteria <strong>of</strong> organizational effectiveness. In <strong>the</strong> Michigan Business Review ( July issue). Ann<br />
Arbor, MI: Graduate School <strong>of</strong> Business Administration, The University <strong>of</strong> Michigan.<br />
Sethia, N. K., & Van Glinow, M. A. (1985). Arriving at four cultures by managing <strong>the</strong> reward system. In R. H.<br />
Kilmann, M. J. Saxton, & R. Serpa (Eds.), Gaining control <strong>of</strong> <strong>the</strong> corporate culture. San Francisco, CA: Jossey-Bass.<br />
Szumal, J. L. (1998). The Organizational Culture Inventory interpretation <strong>and</strong> development guide. Plymouth, MI:<br />
<strong>Human</strong> Synergistics.<br />
18 Copyright © 2012 by <strong>Human</strong> Synergistics International
RELIAB<strong>IL</strong>ITY & VALIDITY<br />
humansynergistics.com<br />
Organizational Effectiveness Inventory ®<br />
Tannenbaum, A. S. (1968). Control in organizations. New York, NY: McGraw-Hill.<br />
Trist, E. L., & Bamforth, K. W. (1951). Some social <strong>and</strong> psychological consequences <strong>of</strong> <strong>the</strong> longwall method <strong>of</strong> coalgetting.<br />
<strong>Human</strong> Relations, 4, 3-38.<br />
Tubbs, M. E. (1986). Goal setting: A meta-analytic examination <strong>of</strong> <strong>the</strong> empirical evidence. Journal <strong>of</strong> Applied<br />
Psychology, 71, 474-483.<br />
Tunstall, W. B. (1986). The breakup <strong>of</strong> <strong>the</strong> Bell System: A case study in cultural transformation. California<br />
Management Review, 28, 110-124.<br />
van der Velde, M., & Class, M. D. (1995). The relationship <strong>of</strong> role conflict <strong>and</strong> ambiguity to organizational culture.<br />
In S. L. Suater & L. R. Murphy (Eds.), Organizational risk factors for job stress. Washington, DC: American<br />
Psychological Association.<br />
Zeithaml, V. A., Parasuraman, A., & Berry, L. L. (1990). Delivering quality service: Balancing customer perceptions <strong>and</strong><br />
expectations. New York, NY: The Free Press.<br />
Copyright © 2012 by <strong>Human</strong> Synergistics International<br />
19
RELIAB<strong>IL</strong>ITY & VALIDITY<br />
humansynergistics.com<br />
Organizational Effectiveness Inventory ®<br />
About <strong>the</strong> Circumplex<br />
<strong>Human</strong> Synergistics International’s Circumplex provides a way to “see” what drives <strong>the</strong> performance <strong>of</strong> individual contributors, leaders, work teams <strong>and</strong>,<br />
in short, <strong>the</strong> entire organization. It illustrates <strong>the</strong> factors underlying performance in terms <strong>of</strong> 12 styles <strong>of</strong> thinking <strong>and</strong> behaving. Some styles lead to<br />
effectiveness <strong>and</strong> productivity; some do not. Regardless <strong>of</strong> <strong>the</strong>ir impact, <strong>the</strong>y all describe what’s happening inside <strong>the</strong> organization <strong>and</strong> provide a direction<br />
for change <strong>and</strong> development.<br />
Effective individuals in groups <strong>and</strong><br />
organizations show STRONGER<br />
tendencies along <strong>the</strong> Constructive styles.<br />
12<br />
Creative <strong>and</strong> original thinker<br />
Receptive to change<br />
High personal integrity<br />
Self respecting<br />
11<br />
Works toward self-set goals<br />
Accepts <strong>and</strong> shares responsibility<br />
Believes that individual effort is important<br />
Takes on challenging tasks<br />
10<br />
Never wants to make a mistake<br />
Sets unrealistic goals<br />
Personally takes care <strong>of</strong> every detail<br />
Tries hard to prove self<br />
1<br />
Resolves conflicts constructively<br />
Encourages growth <strong>and</strong> development in o<strong>the</strong>rs<br />
Involves o<strong>the</strong>rs in decision making<br />
Develops o<strong>the</strong>rs<br />
2<br />
Cooperative<br />
Friendly<br />
Genuine concern for o<strong>the</strong>rs<br />
At ease with people<br />
9<br />
Competes ra<strong>the</strong>r than cooperates<br />
Strong need to win<br />
Constantly compares self to o<strong>the</strong>rs<br />
Inclined to be reckless<br />
3<br />
Sets goals that please o<strong>the</strong>rs<br />
Agrees with everyone<br />
Over-optimistic<br />
Spoils people with kindness<br />
8<br />
Wants to control everything<br />
Believes in force<br />
Abrupt<br />
On <strong>the</strong> <strong>of</strong>fensive<br />
4<br />
Treats rules as more important than ideas<br />
Follows policies <strong>and</strong> practices<br />
Sets predictable goals <strong>and</strong> objectives<br />
Conforming<br />
Effective individuals in groups<br />
<strong>and</strong> organizations show<br />
WEAKER tendencies along <strong>the</strong><br />
Aggressive/Defensive styles.<br />
7<br />
Opposes new ideas<br />
Looks for mistakes<br />
Cynical<br />
Critical <strong>of</strong> o<strong>the</strong>rs<br />
6<br />
Leaves decisions to o<strong>the</strong>rs<br />
Noncommittal<br />
“Lays low” when things get tough<br />
Lacks self-confidence<br />
5<br />
Relies on o<strong>the</strong>rs for direction<br />
Doesn’t challenge o<strong>the</strong>rs<br />
Research & Development by:<br />
Robert<br />
A good<br />
A. Cooke,<br />
follower<br />
Ph.D.<br />
J. Clayton Lafferty, Ph.D.<br />
Copyright Compliant © 1973-2009<br />
by <strong>Human</strong> Synergistics International.<br />
All rights reserved.<br />
Effective individuals in groups<br />
<strong>and</strong> organizations show<br />
WEAKER tendencies along <strong>the</strong><br />
Passive/Defensive styles.<br />
Research & Development by Robert A. Cooke, Ph.D., <strong>and</strong> J. Clayton Lafferty, Ph.D. Copyright © by <strong>Human</strong> Synergistics International. All Rights Reserved.<br />
U.S.A. AUSTRALIA BELGIUM BRITISH ISLES BULGARIA CANADA FINLAND GERMANY HUNGARY JAPAN THE NETHERLANDS NEW ZEALAND ROMANIA SERBIA SOUTH KOREA<br />
humansynergistics.com<br />
Creators <strong>of</strong> <strong>the</strong> Organizational Culture Inventory ® , Desert Survival Situation,<br />
Life Styles Inventory <strong>and</strong> Leadership/Impact ® .<br />
HSI v. 2.0<br />
6/2012<br />
20<br />
Changing <strong>the</strong> World—<br />
One Organization at a Time ®<br />
Copyright © 2012 by <strong>Human</strong> Synergistics International. No part <strong>of</strong> this work may be reproduced, translated, stored in a retrieval system,<br />
transcribed in any form or by any means, including, but not limited to electronic, mechanical, photocopying, recording or o<strong>the</strong>r means,<br />
without prior written permission <strong>of</strong> <strong>Human</strong> Synergistics International. Please direct correspondence to <strong>Human</strong> Synergistics International<br />
at 39819 Plymouth Road, Plymouth, MI 48170 U.S.A., (1.734.459.1030). While we’re not vengeful, we are provokable ® .