Cutten School Accountability Report Card
Cutten School Accountability Report Card
Cutten School Accountability Report Card

Create successful ePaper yourself
Turn your PDF publications into a flip-book with our unique Google optimized e-Paper software.
<strong>Cutten</strong> <strong>School</strong><br />
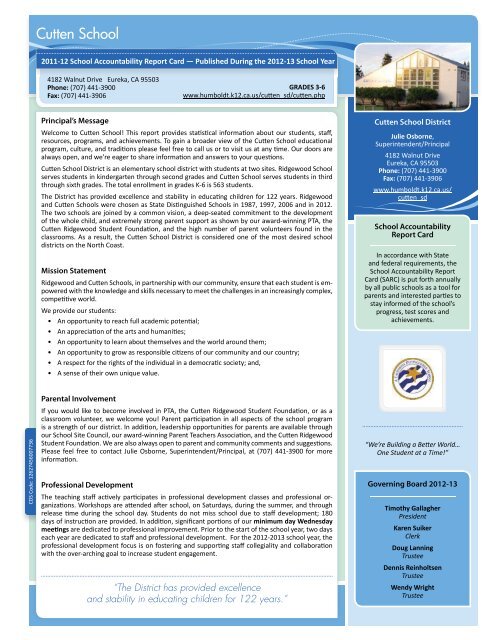
2011-12 <strong>School</strong> <strong>Accountability</strong> <strong>Report</strong> <strong>Card</strong> — Published During the 2012-13 <strong>School</strong> Year<br />
4182 Walnut Drive Eureka, CA 95503<br />
Phone: (707) 441-3900<br />
Fax: (707) 441-3906<br />
GRADES 3-6<br />
www.humboldt.k12.ca.us/cuen_sd/cuen.php<br />
Principal’s Message<br />
Welcome to Cuen <strong>School</strong>! This report provides stascal informaon about our students, staff,<br />
resources, programs, and achievements. To gain a broader view of the Cuen <strong>School</strong> educaonal<br />
program, culture, and tradions please feel free to call us or to visit us at any me. Our doors are<br />
always open, and we’re eager to share informaon and answers to your quesons.<br />
Cuen <strong>School</strong> District is an elementary school district with students at two sites. Ridgewood <strong>School</strong><br />
serves students in kindergarten through second grades and Cuen <strong>School</strong> serves students in third<br />
through sixth grades. The total enrollment in grades K-6 is 563 students.<br />
The District has provided excellence and stability in educang children for 122 years. Ridgewood<br />
and Cuen <strong>School</strong>s were chosen as State Disnguished <strong>School</strong>s in 1987, 1997, 2006 and in 2012.<br />
The two schools are joined by a common vision, a deep-seated commitment to the development<br />
of the whole child, and extremely strong parent support as shown by our award-winning PTA, the<br />
Cuen Ridgewood Student Foundaon, and the high number of parent volunteers found in the<br />
classrooms. As a result, the Cuen <strong>School</strong> District is considered one of the most desired school<br />
districts on the North Coast.<br />
Mission Statement<br />
Ridgewood and Cuen <strong>School</strong>s, in partnership with our community, ensure that each student is empowered<br />
with the knowledge and skills necessary to meet the challenges in an increasingly complex,<br />
compeve world.<br />
We provide our students:<br />
• An opportunity to reach full academic potenal;<br />
• An appreciaon of the arts and humanies;<br />
• An opportunity to learn about themselves and the world around them;<br />
• An opportunity to grow as responsible cizens of our community and our country;<br />
• A respect for the rights of the individual in a democrac society; and,<br />
• A sense of their own unique value.<br />
<strong>Cutten</strong> <strong>School</strong> District<br />
Julie Osborne,<br />
Superintendent/Principal<br />
4182 Walnut Drive<br />
Eureka, CA 95503<br />
Phone: (707) 441-3900<br />
Fax: (707) 441-3906<br />
www.humboldt.k12.ca.us/<br />
cuen_sd<br />
<strong>School</strong> <strong>Accountability</strong><br />
<strong>Report</strong> <strong>Card</strong><br />
In accordance with State<br />
and federal requirements, the<br />
<strong>School</strong> <strong>Accountability</strong> <strong>Report</strong><br />
<strong>Card</strong> (SARC) is put forth annually<br />
by all public schools as a tool for<br />
parents and interested pares to<br />
stay informed of the school’s<br />
progress, test scores and<br />
achievements.<br />
CDS Code: 12627456007736<br />
Parental Involvement<br />
If you would like to become involved in PTA, the Cuen Ridgewood Student Foundaon, or as a<br />
classroom volunteer, we welcome you! Parent parcipaon in all aspects of the school program<br />
is a strength of our district. In addion, leadership opportunies for parents are available through<br />
our <strong>School</strong> Site Council, our award-winning Parent Teachers Associaon, and the Cuen Ridgewood<br />
Student Foundaon. We are also always open to parent and community comments and suggesons.<br />
Please feel free to contact Julie Osborne, Superintendent/Principal, at (707) 441-3900 for more<br />
informaon.<br />
Professional Development<br />
The teaching staff acvely parcipates in professional development classes and professional organizaons.<br />
Workshops are aended aer school, on Saturdays, during the summer, and through<br />
release me during the school day. Students do not miss school due to staff development; 180<br />
days of instrucon are provided. In addion, significant porons of our minimum day Wednesday<br />
meengs are dedicated to professional improvement. Prior to the start of the school year, two days<br />
each year are dedicated to staff and professional development. For the 2012-2013 school year, the<br />
professional development focus is on fostering and supporng staff collegiality and collaboraon<br />
with the over-arching goal to increase student engagement.<br />
“The District has provided excellence<br />
and stability in educating children for 122 years.”<br />
“We’re Building a Beer World…<br />
One Student at a Time!”<br />
Governing Board 2012-13<br />
Timothy Gallagher<br />
President<br />
Karen Suiker<br />
Clerk<br />
Doug Lanning<br />
Trustee<br />
Dennis Reinholtsen<br />
Trustee<br />
Wendy Wright<br />
Trustee
<strong>Cutten</strong> <strong>School</strong> • 2011-12 SARC<br />
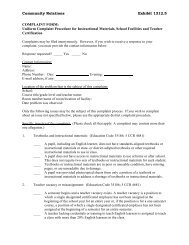
Class Size<br />
Class Size Distribution — Average Class Size<br />
Three-Year Data Comparison<br />
09-10 10-11 11-12<br />
28<br />
26 27 27 28 28 28<br />
25 26<br />
27<br />
22 22<br />
23<br />
26<br />
Class Size<br />
2<br />
The bar graph displays the three-year<br />
data for average class size and the table<br />
displays the three-year data for the<br />
number of classrooms by size.<br />
3 4 5 6 3-4 Combo 5-6 Combo<br />
Class Size Distribution — Number of Classrooms by Size<br />
Three-Year Data Comparison<br />
09-10 10-11 11-12<br />
Grade 1-20 21-32 33+ 1-20 21-32 33+ 1-20 21-32 33+<br />
2011-12 12 SARC<br />
3 3 3 3<br />
4 2 3 3<br />
5 3 2 2<br />
6 3 3 2<br />
3-4 (Combo) 1<br />
5-6 (Combo) 1<br />
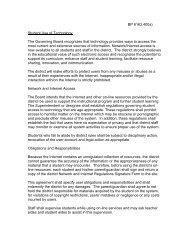
Enrollment and Demographics<br />
The total enrollment at the school was 299 students for the 2011-12 school year.*<br />
Demographics<br />
White<br />
65%<br />
Black or African<br />
American<br />
1%<br />
Asian<br />
3%<br />
2011-12 <strong>School</strong> Year<br />
Two or More<br />
Races No Response<br />
13% 1% Hispanic or<br />
Latino<br />
12%<br />
American Indian<br />
or Alaska Native<br />
4%<br />
Native Hawaiian<br />
or Pacific<br />
Islander<br />
Filipino
<strong>Cutten</strong> <strong>School</strong> • 2011-12 SARC<br />
3<br />
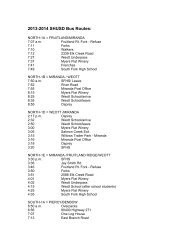
<strong>School</strong> Facility Items Inspected<br />
The tables show the results of the school’s most recent inspecon using the Facility Inspecon Tool<br />
(FIT) or equivalent school form. The following is a list of items inspected.<br />
• Systems: Gas Systems and Pipes, Sewer,<br />
Mechanical Systems (heang, venlaon,<br />
and air condioning)<br />
• Interior: Interior Surfaces (floors,<br />
ceilings, walls, and window casings)<br />
• Cleanliness: Pest/Vermin Control, Overall<br />
Cleanliness (school grounds, buildings,<br />
rooms, and common areas)<br />
• Electrical: Electrical Systems<br />
(interior and exterior)<br />
• Restrooms/Fountains: Restrooms,<br />
Sinks/Drinking Fountains (interior<br />
and exterior)<br />
• Safety: Fire Safety Equipment,<br />
Emergency Systems, Hazardous<br />
Materials (interior and exterior)<br />
• Structural: Structural Condion,<br />
Roofs<br />
• External: Windows/Doors/Gates/Fences,<br />
Playgrounds/<strong>School</strong> Grounds<br />
<strong>School</strong> Facility Good Repair Status<br />
This inspecon determines the school facility’s good repair status using rangs of good condion,<br />
fair condion, or poor condion. The overall summary of facility condions uses rangs of exemplary,<br />
good, fair, or poor condion.<br />
<strong>School</strong> Facility Good Repair Status<br />
2012-13 <strong>School</strong> Year<br />
Items Inspected Repair Status Items Inspected Repair Status<br />
Systems Good Restrooms/Fountains Good<br />
Interior Good Safety Good<br />
Cleanliness Good Structural Good<br />
Electrical Good External Good<br />
Public Internet Access<br />
Internet access is available at public<br />
libraries and other locaons that are<br />
publicly accessible (i.e., the California<br />
State Library). Access to the Internet<br />
at libraries and public locaons is<br />
generally provided on a first-come,<br />
first-served basis. Other use restricons<br />
include the hours of operaon, the<br />
length of me that a workstaon may<br />
be used (depending on availability),<br />
the types of soware programs available<br />
at a workstaon, and the ability<br />
to print documents.<br />
Overall Summary of Facility Condions<br />
Good<br />
Date of the Most Recent <strong>School</strong> Site Inspecon 12/17/2012<br />
Date of the Most Recent Compleon of the Inspecon Form 12/17/2012<br />
Deficiencies and Repairs<br />
The table lists the repairs required for all deficiencies found during the school site inspecon. Regardless<br />
of each item’s repair status, all deficiencies are listed.<br />
Deficiencies and Repairs<br />
Items Inspected<br />
2012-13 <strong>School</strong> Year<br />
Deficiencies, Acon Taken or Planned, and Date of Acon<br />
2011-12 12 SARC<br />
Systems Single classroom heater replaced 11/2012.<br />
<strong>School</strong> Facilities<br />
Cuen <strong>School</strong> provides a safe, clean, tobacco-free educaonal environment for students. One maintenance<br />
employee and two custodians ensure the good condion and cleanliness of our buildings,<br />
restrooms, and grounds. All classrooms and support services rooms are equipped with a telephone,<br />
an intercom system, and access to the Internet. A security system is present to protect every room.<br />
Visitors are welcomed at Cuen <strong>School</strong> and sign in at the school office. Due to the close-knit nature<br />
of our school, unfamiliar visitors on campus are very rare and are immediately greeted by school<br />
personnel.<br />
Cuen Elementary <strong>School</strong> was built in 1951. The school has eleven regular classrooms, a library, a<br />
computer lab, a mulpurpose room, a student support resource room, a tutoring center, a music<br />
room, and an aer-school program room. One relocatable classroom was purchased during the<br />
2005-06 school year to meet the needs of increased student enrollment.<br />
Connued on sidebar<br />
<strong>School</strong> Facilities<br />
Connued from boom le<br />
Another relocatable was added in 2007<br />
to house the speech/language and tutoring<br />
programs. Facilies also include<br />
two baseball fields, a mul-dimensional<br />
playground structure, three wall ball<br />
courts, and a large athlec field.<br />
Our Internet wiring infrastructure at<br />
Cuen was recently replaced and our<br />
electrical capacity was increased using<br />
Deferred Maintenance Funding. Addional<br />
computer “drops” were also<br />
added in all classrooms, allowing more<br />
convenient teacher/student access to<br />
the Internet.
<strong>Cutten</strong> <strong>School</strong> • 2011-12 SARC<br />
4<br />
Textbooks and Instructional Materials<br />
The Cuen Elementary <strong>School</strong> District connually reviews and updates its textbooks and instruc-<br />
onal materials in order to ensure that they:<br />
1. Are available in sufficient numbers;<br />
2. Are consistent with the content and cycles of the State Curriculum Frameworks;<br />
3. Have been adopted by the State Board of Educaon; and,<br />
4. Are the best possible tools for supporng the curriculum.<br />
Teachers and administrators are all involved in the selecon process. Decisions are also reviewed by<br />
our <strong>School</strong> Site Council. The most recent public hearing held to adopt a resoluon on the sufficiency<br />
of instruconal materials was September 10, 2012.<br />
Textbooks and Instructional Materials List<br />
2012-13 <strong>School</strong> Year<br />
Subject Textbook Adopted<br />
English-Language Arts Houghton Mifflin 2002<br />
English-Language Arts Write Source 1999<br />
Mathemacs Sco Foresman 2008<br />
Science Full Opon Science System (FOSS) (3-5) 2007<br />
Science Sco Foresman (6) 2007<br />
History-Social Science Sco Foresman (3-5) 2006<br />
History-Social Science Teachers’ Curriculum Instute (6) 2006<br />
Availability of Textbooks and Instructional Materials<br />
The following lists the percentage of pupils who lack their own assigned textbooks and instruconal<br />
materials.<br />
Percentage of Students Lacking Materials by Subject<br />
Subject<br />
2012-13 <strong>School</strong> Year<br />
Cuen <strong>School</strong><br />
Percent Lacking<br />
Reading/Language Arts 0%<br />
Mathemacs 0%<br />
Science 0%<br />
Quality of Textbooks<br />
The following table outlines the criteria<br />
required for choosing textbooks and<br />
instruconal materials.<br />
Quality of Textbooks<br />
2012-13 <strong>School</strong> Year<br />
Criteria<br />
Yes/No<br />
Are the textbooks adopted<br />
from the most recent<br />
state-approved or local No<br />
governing board approved<br />
list?<br />
Are the textbooks<br />
consistent with the<br />
content and cycles of the<br />
Yes<br />
curriculum frameworks<br />
adopted by the State<br />
Board of Educaon?<br />
Does every student,<br />
including English Learners,<br />
have access to their own<br />
Yes<br />
textbooks and instruconal<br />
materials to use in class<br />
and to take home?<br />
History-Social Science 0%<br />
Visual and Performing Arts<br />
<br />
2011-12 12 SARC<br />
Foreign Language<br />
Health<br />
<br />
<br />
Currency of Textbook Data<br />
This table displays the date when the textbook and instruconal materials informaon was collected<br />
and verified.<br />
2012-13 <strong>School</strong> Year<br />
Currency of Textbook Data<br />
Data Collecon Date 09/2012<br />
Not applicable.<br />
The Cuen <strong>School</strong> District did not purchase English/Language Arts materials at the 2008 adopon due<br />
to budget constraints; however all materials are consistent with current framework and state standards.
<strong>Cutten</strong> <strong>School</strong> • 2011-12 SARC<br />
STAR Results for All Students<br />
The Standardized Tesng and Reporng (STAR) results are evaluated and compared to state standards<br />
using the following five performance levels: Advanced (exceeds state standards); Proficient<br />
(meets state standards); Basic; Below Basic; and Far Below Basic. Students scoring at the Proficient<br />
or Advanced level meet state standards in that content area. The tables show the percentage of<br />
students that scored at Proficient or Advanced levels in English-language arts, mathemacs, and<br />
science.<br />
Students Scoring at Proficient or Advanced Levels<br />
STAR Results by Student Group:<br />
English-Language Arts, Mathematics, and Science<br />
Students Scoring at Proficient or Advanced Levels<br />
Group<br />
Cuen <strong>School</strong><br />
(Grades 3-6)<br />
Cuen <strong>School</strong> District<br />
(Grades 2-6)<br />
English-<br />
Language Arts<br />
Three-Year Data Comparison<br />
Mathemacs<br />
California<br />
Subject 09-10 10-11 11-12 09-10 10-11 11-12 09-10 10-11 11-12<br />
English-Language Arts 63% 65% 72% 62% 66% 69% 52% 54% 56%<br />
Mathemacs 67% 72% 74% 69% 74% 72% 48% 50% 51%<br />
Science (Grade 5) 72% 74% 69% 72% 74% 69% 54% 57% 60%<br />
Spring 2012 Results<br />
Science<br />
(Grade 5)<br />
All Students in the District (Grades 2-6) 69% 72% 69%<br />
All Students at the <strong>School</strong> (Grades 3-6) 72% 74% 69%<br />
Male 74% 78% 83%<br />
Female 70% 70% 58%<br />
Black or African American <br />
American Indian or Alaska Nave <br />
Asian <br />
Filipino <br />
Hispanic or Lano 82% 76% <br />
5<br />
Standardized Testing and<br />
<strong>Report</strong>ing Program<br />
Based upon single point-in-me, mul-<br />
ple choice test.<br />
The Standardized Tesng and <strong>Report</strong>ing<br />
(STAR) Program aims to idenfy<br />
strengths and weaknesses to improve<br />
student learning. STAR consists of<br />
several key tests that are designed for<br />
the student’s age and individual needs.<br />
These tests include: the California<br />
Standards Test (CST), California Modified<br />
Assessment (CMA), and California<br />
Alternate Performance Assessment<br />
(CAPA).<br />
The CSTs are mulple choice tests in<br />
English-language arts, mathemacs,<br />
science, and history-social science<br />
for varying grade levels. The fourth<br />
grade parcipates in an essay wring<br />
test. The CSTs are used to determine<br />
students’ achievement of the California<br />
Academic Content Standards. These<br />
standards describe the knowledge and<br />
skills that students are expected to<br />
learn at each grade level and subject.<br />
The CMA is a modified assessment for<br />
students with disabilies who have an<br />
individualized educaon program (IEP).<br />
It is designed to assess those students<br />
whose disabilies prevent them from<br />
achieving grade-level proficiency on an<br />
assessment of the content standards<br />
with or without accommodaons.<br />
The CAPA is an alternate assessment<br />
for students with significant cognive<br />
disabilies who are unable to take the<br />
CST with accommodaons or modifica-<br />
ons or the CMA with accommoda-<br />
ons.<br />
For more informaon on the STAR<br />
program including tests, parcipaon,<br />
groups, and scores by grade level,<br />
please visit hp://star.cde.ca.gov/.<br />
Nave Hawaiian or Pacific Islander <br />
2011-12 12 SARC<br />
White 72% 76% 72%<br />
Two or More Races 70% 68% 58%<br />
Socioeconomically Disadvantaged 64% 66% 67%<br />
English Learners <br />
Students with Disabilies 36% 61% <br />
Students Receiving<br />
Migrant Educaon Services<br />
<br />
Scores are not shown when the number of students tested is 10 or less, or because the number of<br />
students tested in this category is too small for stascal accuracy or to protect student privacy.
<strong>Cutten</strong> <strong>School</strong> • 2011-12 SARC<br />
Academic Performance Index<br />
The Academic Performance Index (API) is an annual measure of the academic performance and<br />
progress of the schools within California based solely upon the mulple choice STAR test scores. API<br />
is measured on a scale from 200 to 1,000. This score reflects the school, district or a student group’s<br />
performance level, based on the results of statewide tesng. The state has set an API score of 800<br />
as the statewide target.<br />
The annual API reporng cycle consists of the Base and Growth API. The Base API begins the reporting<br />
cycle and the results are released approximately a year aer tesng occurs (e.g. The 2011 Base<br />
API is calculated from results of statewide tesng in spring 2011, but the results are not released un-<br />
l May 2012). Growth API, calculates test results in the same fashion and with the same indicators<br />
as the Base API but from test results of the following year (e.g. The 2012 Growth API is calculated<br />
from results of statewide tesng in spring 2012 and released in September 2012). The year of the<br />
API corresponds to the year of tesng. Therefore, for the 2011-12 API reporng cycle, the 2011 Base<br />
indicator and 2012 Growth indicator are used. To represent how much a school’s API changed from<br />
2011-12 (known as the 2011-12 API Growth), the 2011 Base API is subtracted from the 2012 Growth<br />
API. The Base API <strong>Report</strong> includes the Base API, targets, and ranks. The Growth API <strong>Report</strong> includes<br />
Growth API, growth achieved, and whether or not targets were met.<br />
To learn more about API, visit the API informaon guide at www.cde.ca.gov/ta/ac/ap/documents/infoguide12.pdf<br />
and the API overview guide at www.cde.ca.gov/ta/ac/ay/documents/overview12.pdf.<br />
API Ranks<br />
API Ranks<br />
Three-Year Data Comparison<br />
2009 2010 2011<br />
Statewide API Rank 7 7 7<br />
Similar <strong>School</strong>s API Rank 6 6 5<br />
API Testing<br />
6<br />
Assessment data is reported only for<br />
numerically significant groups. To be<br />
considered numerically significant for<br />
the API, the group must have either:<br />
(1) at least 50 students with valid STAR<br />
Program scores who make up at least<br />
15% of the total valid STAR Program<br />
scores, or (2) at least 100 students with<br />
valid STAR Program scores.<br />
API Ranks<br />
<strong>School</strong>s are ranked in ten categories<br />
of equal size, called deciles, from 1<br />
(lowest) to 10 (highest) based on their<br />
API Base reports. A school’s “statewide<br />
API rank” compares its API to the APIs<br />
of all other schools statewide of the<br />
same type (elementary, middle, or<br />
high school). A “similar schools API<br />
rank” reflects how a school compares<br />
to 100 stascally matched similar<br />
schools. This table shows the school’s<br />
three-year data for statewide API rank<br />
and similar schools API rank, for which<br />
informaon is available.<br />
API Growth by Student Group<br />
This table displays, by student group, first, the 2012 Growth API at the school, district, and state level followed by the actual API change in points<br />
added or lost for the past three years at the school.<br />
2012 Growth API and Three-Year Data Comparison<br />
API Growth by Student Group<br />
Group<br />
Cuen <strong>School</strong><br />
(Grades 3-6)<br />
Number<br />
of Students<br />
Growth<br />
API<br />
2012 Growth API<br />
Cuen <strong>School</strong> District<br />
(Grades 2-6)<br />
Number Growth<br />
of Students API<br />
Number<br />
of Students<br />
California<br />
Growth<br />
API<br />
Cuen <strong>School</strong> –<br />
Actual API Change<br />
09-10 10-11 11-12<br />
All Students 284 878 365 867 4,664,264 788 +9 +9 +26<br />
Black or African American 3 5 313,201 710 • • •<br />
American Indian or Alaska Nave 9 12 777 31,606 742 • • •<br />
Asian 7 10 404,670 905 • • •<br />
Filipino 2 2 124,824 869 • • •<br />
2011-12 12 SARC<br />
Hispanic or Lano 32 882 37 872 2,425,230 740 • • •<br />
Nave Hawaiian or Pacific Islander 0 0 26,563 775 • • •<br />
White 186 884 237 876 1,221,860 853 +2 +11 +26<br />
Two or More Races 40 884 54 872 88,428 849 • • •<br />
Socioeconomically Disadvantaged 113 842 149 827 2,779,680 737 +6 +20 +32<br />
English Learners 3 7 1,530,297 716 • • •<br />
Students with Disabilies 39 767 52 737 530,935 607 • • •<br />
•Data are reported only for numerically significant groups.<br />
Scores are not shown when the number of students tested is 10 or less, or because the number of students tested in this category is too small for stascal<br />
accuracy or to protect student privacy.
<strong>Cutten</strong> <strong>School</strong> • 2011-12 SARC<br />
Adequate Yearly Progress<br />
The Federal No Child Le Behind (NCLB) Act requires that all schools and districts meet Adequate<br />
Yearly Progress (AYP) requirements. California public schools and districts are required to meet or<br />
exceed criteria in these four target areas:<br />
1. Parcipaon rate on statewide assessments in English-language arts and mathemacs<br />
2. Percentage of students scoring proficient on statewide assessments in English-language arts<br />
and mathemacs<br />
3. API scores<br />
4. Graduaon rate for high schools<br />
The table displays whether or not the school and district met each of the AYP criteria and made<br />
overall AYP for 2011-12. For more informaon, visit www.cde.ca.gov/ta/ac/ay/.<br />
Adequate Yearly Progress Criteria<br />
2011-12 <strong>School</strong> Year<br />
Cuen <strong>School</strong> (Grades 3-6) Cuen <strong>School</strong> District (Grades 2-6)<br />
Met Overall AYP Yes No<br />
AYP Criteria<br />
English-<br />
Language Arts<br />
Mathemacs<br />
English-<br />
Language Arts<br />
Mathemacs<br />
Parcipaon Rate Yes Yes Yes Yes<br />
Percent Proficient Yes Yes Yes No<br />
API Yes Yes<br />
Graduaon Rate <br />
Federal Intervention Program<br />
Districts and schools receiving Title I funding that fail to meet AYP over two consecuve years in the<br />
same content area (English-language arts or mathemacs) or on the same indicator (API or gradua-<br />
on rate) can enter into Program Improvement (PI). Each addional year that the district or schools<br />
do not meet AYP results in advancement to the next level of intervenon. This table displays the<br />
2012-13 Program Improvement status for the school and district. For more informaon, please visit<br />
www.cde.ca.gov/ta/ac/ay/.<br />
Types of Services Funded<br />
7<br />
In the Cuen Elementary <strong>School</strong> District,<br />
in addion to regular classroom<br />
instrucon, we parcipate in the following<br />
programs:<br />
• Aer <strong>School</strong> Child Care<br />
• Class Size Reducon<br />
• Computer Educaon<br />
• Counseling<br />
• Drug Free <strong>School</strong><br />
• Economic Impact Aid (EIA)<br />
• English Learners<br />
• Gied and Talented Educaon<br />
(GATE)<br />
• Improving Teacher Quality<br />
• Library<br />
• Loery – Instruconal Materials<br />
• Music<br />
• Speech and Language Pathologist<br />
• Rural Educaon Achievement<br />
• <strong>School</strong> Improvement<br />
• Title I (Basic Grants – Low Income)<br />
• Title II (Enhance Educaon<br />
Through Technology)<br />
• Title V (Innovave Educaonal<br />
Strategies)<br />
• Transportaon – Home to <strong>School</strong><br />
Federal Intervention Program<br />
2012-13 <strong>School</strong> Year<br />
Cuen <strong>School</strong><br />
(Grades 3-6)<br />
Cuen <strong>School</strong> District<br />
(Grades 2-6)<br />
Program Improvement Status Not In PI Not In PI<br />
First Year of Program Improvement <br />
Year in Program Improvement <br />
2011-12 12 SARC<br />
Number of <strong>School</strong>s Idenfied for Program Improvement 0<br />
Percent of <strong>School</strong>s Idenfied for Program Improvement 0.00%<br />
Not applicable. The graduaon rate for AYP criteria applies to high schools.<br />
Not applicable.<br />
“Parent participation in all aspects of<br />
the school program is a strength of our district.”<br />
<strong>School</strong> Safety<br />
The Comprehensive <strong>School</strong> Safety Plan<br />
is undergoing a complete review and<br />
revision during the 2012-13 school<br />
year. Key elements of the plan, including<br />
monthly fire drills, earthquake<br />
evacuaon procedures, and lockdown<br />
policies are reviewed in early October<br />
each year, and are in effect throughout<br />
the year.
<strong>Cutten</strong> <strong>School</strong> • 2011-12 SARC<br />
Teacher Qualifications<br />
This table shows informaon about teacher credenals and teacher qualificaons. More informa-<br />
on can be found by vising hp://data1.cde.ca.gov/dataquest/.<br />
Teacher Credential Information<br />
Cuen <strong>School</strong> District<br />
Teacher Misassignments and Vacant Teacher Positions<br />
Three-Year Data Comparison<br />
Cuen <strong>School</strong><br />
Teachers 11-12 09-10 10-11 11-12<br />
With Full Credenal 28 15 14 14<br />
Without Full Credenal 0 0 0 0<br />
Teaching Outside Subject Area of Competence 0 0 0<br />
This table displays the number of teacher misassignments (teachers assigned without proper legal<br />
authorizaon) and the number of vacant teacher posions (not filled by a single designated teacher<br />
assigned to teach the enre course at the beginning of the school year or semester). Please note: Total<br />
teacher misassignments includes the number of misassignments of teachers of English Learners.<br />
Teacher Misassignments and Vacant Teacher Positions<br />
Three-Year Data Comparison<br />
Cuen <strong>School</strong><br />
Teachers 10-11 11-12 12-13<br />
Teacher Misassignments of English Learners 0 0 0<br />
Academic Counselors and<br />
<strong>School</strong> Support Staff<br />
8<br />
This table displays informaon about<br />
academic counselors and support staff<br />
at the school and their full-me equivalent<br />
(FTE).<br />
Academic Counselors<br />
and <strong>School</strong> Support Staff Data<br />
2011-12 <strong>School</strong> Year<br />
Academic Counselors<br />
FTE of Academic Counselors 0.000<br />
Rao of Students Per<br />
Academic Counselor<br />
Support Staff<br />
Social/Behavioral or Career<br />
Development Counselors<br />
Library Media Teacher<br />
(Librarian)<br />
Library Media Services<br />
Staff (Paraprofessional)<br />
<br />
FTE<br />
0.000<br />
0.000<br />
0.800<br />
Psychologist 0.100<br />
Social Worker 0.500<br />
2011-12 12 SARC<br />
Total Teacher Misassignments 0 0 0<br />
Vacant Teacher Posions 0 0 0<br />
No Child Left Behind Compliant Teachers<br />
NCLB requires that all teachers of core academic subject areas be “highly qualified.” In general, for<br />
a teacher to be considered highly qualified, they must have a bachelor’s degree, an appropriate<br />
California teaching credenal, and have demonstrated competence for each core subject he or she<br />
teaches. The table displays data regarding NCLB compliant teachers from the 2011-12 school year.<br />
For more informaon on teacher qualificaons related to NCLB, visit www.cde.ca.gov/nclb/sr/tq.<br />
No Child Left Behind Compliant Teachers<br />
2011-12 <strong>School</strong> Year<br />
Percent of Classes in Core Academic Subjects<br />
Taught by NCLB<br />
Compliant Teachers<br />
Taught by Non-NCLB<br />
Compliant Teachers<br />
Cuen <strong>School</strong> 100.00% 0.00%<br />
All <strong>School</strong>s in District 100.00% 0.00%<br />
High-Poverty <strong>School</strong>s in District 100.00% 0.00%<br />
Nurse 0.050<br />
Speech/Language/Hearing<br />
Specialist<br />
Resource Specialist<br />
(non-teaching)<br />
Other<br />
Resource Specialist<br />
Assistant<br />
0.400<br />
1.000<br />
FTE<br />
0.700<br />
Computer Technician 0.875<br />
Classroom Assistants<br />
(1 Assistant in every<br />
classroom, daily)<br />
3.440<br />
Low-Poverty <strong>School</strong>s in District 100.00% 0.00%<br />
NCLB Note<br />
High-poverty schools are defined as those schools with student parcipaon of approximately 40%<br />
or more in the free and reduced priced meals program. Low-poverty schools are those with student<br />
parcipaon of approximately 25% or less in the free and reduced priced meals program.<br />
Not applicable.
<strong>Cutten</strong> <strong>School</strong> • 2011-12 SARC<br />
Financial Data<br />
The financial data displayed in the SARC is from the 2010-11 fiscal year. The most current fiscal informaon<br />
available provided by the state is always two years behind the current school year, and<br />
one year behind most other data included in this report. For more detailed financial informaon,<br />
please visit www.cde.ca.gov/ds/fd/cs and www.cde.ca.gov/ds/fd/ec.<br />
District Financial Data<br />
This table displays district teacher and administrave salary informaon and compares the figures<br />
to the state averages for districts of the same type and size based on the salary schedule. Note the<br />
district salary data does not include benefits.<br />
District Salary Data<br />
Cuen <strong>School</strong> District<br />
2010-11 Fiscal Year<br />
Similar Sized District<br />
Beginning Teacher Salary $39,693 $38,625<br />
Mid-Range Teacher Salary $60,707 $55,530<br />
<strong>School</strong> Financial Data<br />
9<br />
The following table displays the<br />
school’s average teacher salary and a<br />
breakdown of the school’s expenditures<br />
per pupil from unrestricted and<br />
restricted sources.<br />
<strong>School</strong> Financial Data<br />
2010-11 Fiscal Year<br />
Total Expenditures<br />
Per Pupil<br />
$7,206<br />
Expenditures Per Pupil<br />
From Restricted Sources<br />
$1,919<br />
Expenditures Per Pupil<br />
From Unrestricted Sources<br />
$5,287<br />
Annual Average<br />
Teacher Salary<br />
$60,093<br />
Highest Teacher Salary $71,709 $70,729<br />
Average Principal Salary $83,382 $92,955<br />
Superintendent Salary $116,875 $106,757<br />
Teacher Salaries — Percent of Budget 43% 36%<br />
Administrave Salaries — Percent of Budget 5% 7%<br />
2011-12 12 SARC<br />
Financial Data Comparison<br />
The following table displays the school’s per pupil expenditures from unrestricted sources and the<br />
school’s average teacher salary and compares it to the district and state data.<br />
Financial Data Comparison<br />
Expenditures<br />
Per Pupil From<br />
Unrestricted Sources<br />
2010-11 Fiscal Year<br />
Annual<br />
Average Teacher<br />
Salary<br />
Cuen <strong>School</strong> $5,287 $60,093<br />
Cuen <strong>School</strong> District $5,496 $59,944<br />
California $5,455 $57,019<br />
<strong>School</strong> and District — Percent Difference +4.0% +0.2%<br />
<strong>School</strong> and California — Percent Difference -3.2% +5.1%<br />
Suspensions and Expulsions<br />
This table shows the rate of suspensions<br />
and expulsions (the total number<br />
of incidents divided by the school’s<br />
total enrollment) for the most recent<br />
three-year period.<br />
Suspension and Expulsion Rates<br />
Cuen <strong>School</strong><br />
09-10 10-11 11-12<br />
Suspension<br />
Rates<br />
0.049 0.043 0.013<br />
Expulsion<br />
Rates<br />
0.000 0.000 0.000<br />
Cuen <strong>School</strong> District<br />
Suspension<br />
Rates<br />
Expulsion<br />
Rates<br />
09-10 10-11 11-12<br />
0.032 0.027 0.016<br />
0.000 0.000 0.000<br />
Data for this year’s SARC was provided by the California Department of Educaon (CDE), school and district offices. For addional<br />
informaon on California schools and districts, please visit DataQuest at hp://data1.cde.ca.gov/dataquest. DataQuest is an online<br />
resource that provides reports for accountability, test data, enrollment, graduates, dropouts, course enrollments, staffing, and<br />
data regarding English Learners. Addionally, Ed-Data in partnership with the CDE, provides extensive financial, demographic,<br />
and performance informaon about California’s public kindergarten through grade twelve school districts and schools. More<br />
informaon can be found at www.ed-data.k12.ca.us/Pages/Home.aspx. Per Educaon Code Secon 35256, each school district<br />
shall make hard copies of its annually updated report card available, upon request, on or before February 1 of each year.<br />
All data accurate as of November 29, 2012.