Cutten School Accountability Report Card
Cutten School Accountability Report Card
Cutten School Accountability Report Card

Create successful ePaper yourself
Turn your PDF publications into a flip-book with our unique Google optimized e-Paper software.
<strong>Cutten</strong> <strong>School</strong> • 2011-12 SARC<br />
Academic Performance Index<br />
The Academic Performance Index (API) is an annual measure of the academic performance and<br />
progress of the schools within California based solely upon the mulple choice STAR test scores. API<br />
is measured on a scale from 200 to 1,000. This score reflects the school, district or a student group’s<br />
performance level, based on the results of statewide tesng. The state has set an API score of 800<br />
as the statewide target.<br />
The annual API reporng cycle consists of the Base and Growth API. The Base API begins the reporting<br />
cycle and the results are released approximately a year aer tesng occurs (e.g. The 2011 Base<br />
API is calculated from results of statewide tesng in spring 2011, but the results are not released un-<br />
l May 2012). Growth API, calculates test results in the same fashion and with the same indicators<br />
as the Base API but from test results of the following year (e.g. The 2012 Growth API is calculated<br />
from results of statewide tesng in spring 2012 and released in September 2012). The year of the<br />
API corresponds to the year of tesng. Therefore, for the 2011-12 API reporng cycle, the 2011 Base<br />
indicator and 2012 Growth indicator are used. To represent how much a school’s API changed from<br />
2011-12 (known as the 2011-12 API Growth), the 2011 Base API is subtracted from the 2012 Growth<br />
API. The Base API <strong>Report</strong> includes the Base API, targets, and ranks. The Growth API <strong>Report</strong> includes<br />
Growth API, growth achieved, and whether or not targets were met.<br />
To learn more about API, visit the API informaon guide at www.cde.ca.gov/ta/ac/ap/documents/infoguide12.pdf<br />
and the API overview guide at www.cde.ca.gov/ta/ac/ay/documents/overview12.pdf.<br />
API Ranks<br />
API Ranks<br />
Three-Year Data Comparison<br />
2009 2010 2011<br />
Statewide API Rank 7 7 7<br />
Similar <strong>School</strong>s API Rank 6 6 5<br />
API Testing<br />
6<br />
Assessment data is reported only for<br />
numerically significant groups. To be<br />
considered numerically significant for<br />
the API, the group must have either:<br />
(1) at least 50 students with valid STAR<br />
Program scores who make up at least<br />
15% of the total valid STAR Program<br />
scores, or (2) at least 100 students with<br />
valid STAR Program scores.<br />
API Ranks<br />
<strong>School</strong>s are ranked in ten categories<br />
of equal size, called deciles, from 1<br />
(lowest) to 10 (highest) based on their<br />
API Base reports. A school’s “statewide<br />
API rank” compares its API to the APIs<br />
of all other schools statewide of the<br />
same type (elementary, middle, or<br />
high school). A “similar schools API<br />
rank” reflects how a school compares<br />
to 100 stascally matched similar<br />
schools. This table shows the school’s<br />
three-year data for statewide API rank<br />
and similar schools API rank, for which<br />
informaon is available.<br />
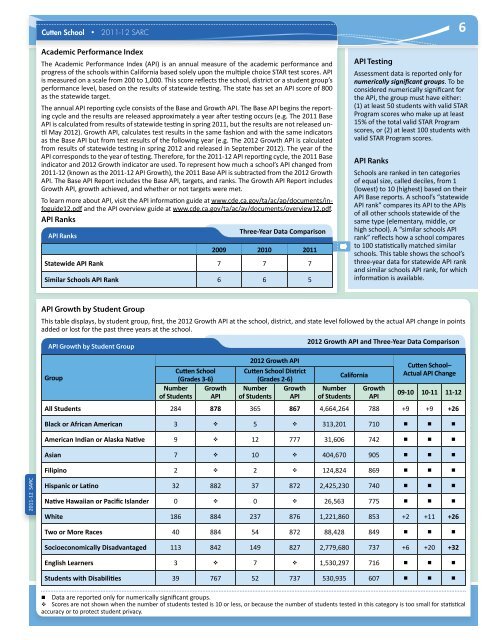
API Growth by Student Group<br />
This table displays, by student group, first, the 2012 Growth API at the school, district, and state level followed by the actual API change in points<br />
added or lost for the past three years at the school.<br />
2012 Growth API and Three-Year Data Comparison<br />
API Growth by Student Group<br />
Group<br />
Cuen <strong>School</strong><br />
(Grades 3-6)<br />
Number<br />
of Students<br />
Growth<br />
API<br />
2012 Growth API<br />
Cuen <strong>School</strong> District<br />
(Grades 2-6)<br />
Number Growth<br />
of Students API<br />
Number<br />
of Students<br />
California<br />
Growth<br />
API<br />
Cuen <strong>School</strong> –<br />
Actual API Change<br />
09-10 10-11 11-12<br />
All Students 284 878 365 867 4,664,264 788 +9 +9 +26<br />
Black or African American 3 5 313,201 710 • • •<br />
American Indian or Alaska Nave 9 12 777 31,606 742 • • •<br />
Asian 7 10 404,670 905 • • •<br />
Filipino 2 2 124,824 869 • • •<br />
2011-12 12 SARC<br />
Hispanic or Lano 32 882 37 872 2,425,230 740 • • •<br />
Nave Hawaiian or Pacific Islander 0 0 26,563 775 • • •<br />
White 186 884 237 876 1,221,860 853 +2 +11 +26<br />
Two or More Races 40 884 54 872 88,428 849 • • •<br />
Socioeconomically Disadvantaged 113 842 149 827 2,779,680 737 +6 +20 +32<br />
English Learners 3 7 1,530,297 716 • • •<br />
Students with Disabilies 39 767 52 737 530,935 607 • • •<br />
•Data are reported only for numerically significant groups.<br />
Scores are not shown when the number of students tested is 10 or less, or because the number of students tested in this category is too small for stascal<br />
accuracy or to protect student privacy.